Build a Simple xG-Difference League Table in a Spreadsheet
No code required - an xGD table in a spreadsheet.
The Premier League table tells you where everyone finished. The xG-difference table tells you whether they deserved to. Building one takes about twenty minutes, a free Understat account, and a spreadsheet. Once you have it, the stories it surfaces — teams propped up by luck, teams quietly punished for it — are worth more than a month of match reports.
Two numbers you need to understand first
Expected-goal difference, or xGD, is the simplest thing in the world once you say it out loud: xG for minus xG against. If a team generates chances worth 2.3 expected goals and concedes chances worth 1.1, their xGD for that match is +1.2. Over a season, xGD is the single most predictive number for future league position — better than actual goal difference, and far better than points. It strips out finishing variance and goalkeeper heroics and leaves behind the signal: which teams are genuinely manufacturing and suppressing good chances?
Expected points (xPts) go one step further. Rather than just totting up chances, Understat's model simulates each match using the shot-by-shot xG data and computes the average points outcome. A team that creates a 0.8 xG chance and concedes a 0.1 xG chance is in a comfortable position — but comfortable is not certainty, and xPts quantifies exactly how many points that shot profile should produce over the long run.
The gap between actual points and xPts is where the editorial interest lives. Big positive gap: the team is taking more from games than the chances suggest — finishing hot, winning tight ones, probably due to regress. Big negative gap: the underlying performance is better than the table shows, and things ought to improve. Both are flags, not verdicts, but they are flags worth planting.
Getting the data from Understat
Head to understat.com, select the competition and season — Premier League 2023-24 in our case — and navigate to the league table view. You want six columns per team: xG (for), xGA (against), xPts, and the matching actual-goals and points figures. Understat displays all of these in a single table. Select the whole thing, copy, and paste it into cell A1 of a new spreadsheet. Most paste operations drop the numbers cleanly into columns; if yours arrives as a single column, use your spreadsheet's "split to columns" or "text to columns" feature with a tab delimiter.
Name your columns. A workable header row looks like this:
| A | B | C | D | E | F | G | H | I |
|---|---|---|---|---|---|---|---|---|
| team | mp | pts | xpts | gf | ga | xgf | xga | gd |
Adding the xGD and pts-over-xPts columns
With data in rows 2 to 21 (one per team), add two derived columns.
Column J is xGD — xG for minus xG against:
=G2-H2Copy that formula down through J21. Column K is pts_over_xpts — how many actual points the team earned above or below expectation:
=C2-D2Copy that down through K21. Now sort the whole table descending by column K to rank teams from biggest over-performer to biggest under-performer. That is your xGD league table, and the whole build took under five minutes. The interesting part is reading what it says.
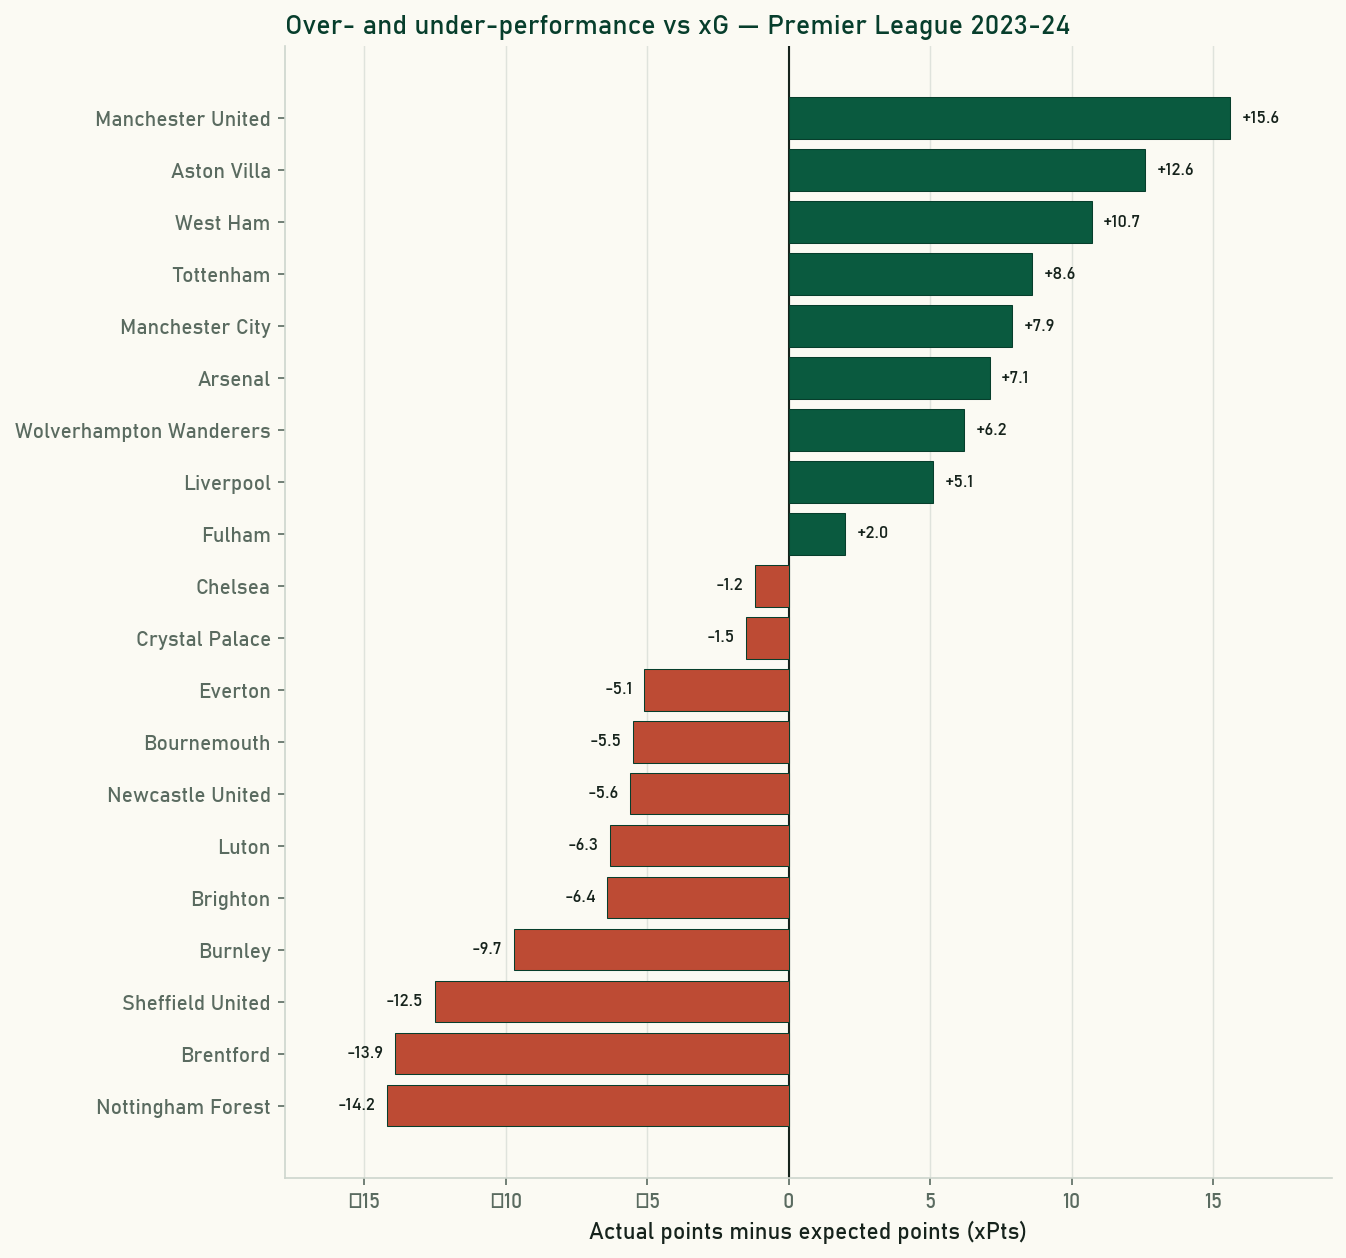
What the 2023-24 Premier League table says
Here is the full table, sorted by final points. The xPts, xGD, and pts_over_xpts columns are where the analysis lives.
| Team | Pts | xPts | GD | xGD | Pts − xPts |
|---|---|---|---|---|---|
| Manchester City | 91 | 83.1 | +62 | +52.3 | +7.9 |
| Arsenal | 89 | 81.9 | +62 | +52.6 | +7.1 |
| Liverpool | 82 | 76.9 | +45 | +47.4 | +5.1 |
| Aston Villa | 68 | 55.4 | +15 | +2.3 | +12.6 |
| Tottenham | 66 | 57.4 | +13 | +5.3 | +8.6 |
| Chelsea | 63 | 64.2 | +14 | +18.3 | −1.2 |
| Newcastle United | 60 | 65.6 | +23 | +22.0 | −5.6 |
| Manchester United | 60 | 44.4 | −1 | −14.4 | +15.6 |
| West Ham | 52 | 41.3 | −14 | −23.4 | +10.7 |
| Crystal Palace | 49 | 50.5 | −1 | −4.1 | −1.5 |
| Brighton | 48 | 54.4 | −7 | +1.0 | −6.4 |
| Everton | 48 | 53.1 | −11 | +0.5 | −5.1 |
| Bournemouth | 48 | 53.5 | −13 | −1.8 | −5.5 |
| Fulham | 47 | 45.0 | −6 | −14.1 | +2.0 |
| Wolverhampton Wanderers | 46 | 39.8 | −15 | −25.5 | +6.2 |
| Brentford | 39 | 52.9 | −9 | +4.0 | −13.9 |
| Nottingham Forest | 36 | 50.2 | −18 | −4.1 | −14.2 |
| Luton | 26 | 32.3 | −33 | −41.8 | −6.3 |
| Burnley | 24 | 33.7 | −37 | −32.3 | −9.7 |
| Sheffield United | 16 | 28.5 | −69 | −44.4 | −12.5 |
The biggest stories in the numbers
Manchester United are the season's most spectacular statistical anomaly. They finished eighth on 60 points, level with Newcastle. But their xPts was just 44.4 — a gap of +15.6, the largest overperformance in the division. Their xGD was −14.4: they conceded higher-quality chances than they created across the entire campaign. A team with negative xGD has no business finishing in the top half; United's goalkeeping, set-piece delivery, and the peculiar fragility of opponents in the decisive moments of tight games conspired to give Erik ten Hag's side a Europa League place dressed in Champions League qualifying clothes.
Aston Villa's +12.6 also deserves scrutiny. Their xGD was only +2.3 — barely positive, a team that neither dominated nor got dominated in chance quality — yet they finished fourth on 68 points. Ollie Watkins's elite finishing is the obvious explanation, and it is probably real, but a twelve-point bonus above xPts is a heavy expectation to carry into a following season. West Ham similarly banked +10.7 points above expectation despite an xGD of −23.4. Their underlying defensive profile was worrying all year; the points cushion masked it until it stopped.
At the other end of the ledger, Nottingham Forest's −14.2 is the sharpest downside gap in the league. Their xGD was only −4.1 — essentially neutral, a team that neither dominated nor was dominated in chance quality — yet they finished 17th on 36 points. Some of that is explained by finishing, some by goalkeeping, some by the sheer misfortune of results in close games. The model says they were a 50-point team. The table says 36. That gap is worth knowing before writing their squad off ahead of the following season.
Chelsea illustrate the reverse problem. Their xGD was +18.3 — third best in the league behind City and Arsenal — and their xPts was 64.2. They finished on 63. On underlying performance they were the third-best team in England; on points they were sixth. That is not a crisis, it is a reminder that the xG table and the real table are measuring slightly different things, and both are worth reading.
Making the table useful over time
The one-season snapshot is a start. The table becomes genuinely predictive when you update it each gameweek. Paste in the new Understat figures, let the formulas recalculate, and watch which teams are drifting away from the expected-points line and which are converging back. A team running +8 pts above xPts in November is not doomed, but it is carrying a weight the table does not yet show. A team that is −6 but with a positive xGD is a candidate to climb in the new year.
Two optional extensions worth adding once the basic table works. First, a rolling ten-game xGD column — paste only the last ten rounds of data into a second sheet and pull the sums — which tracks form more sensitively than the season average. Second, a conditional-formatting rule on the pts_over_xpts column: green for values above +5, amber for −5 to +5, red for below −5. The colour gradient does the analysis for you the moment you open the file on a Monday morning.
The point is not to replace watching football with watching spreadsheets. It is to arrive at the match with a cleaner prior — knowing that the team three points clear at the top has been living on borrowed luck, or that the team in the relegation zone is probably better than that. Twenty minutes of work, four formulas, and the next nine months of results make more sense.
Sources & further reading
- Free textbook: Chapter 4: Python Tools for Soccer Analytics — the theory behind this, at DataField.dev.
- Understat — the source for all xG, xGA, and xPts figures used in this article; free league tables for the top European divisions going back to 2014-15.
- FBref — xG and advanced squad data via Opta, useful for cross-checking figures and exploring individual player contributions.
- StatsBomb — methodological writing on xG model construction and what shot-level features actually drive chance quality.