World Cup 2026
The 2026 Dark-Horse Audit: Grading Our June Checklist
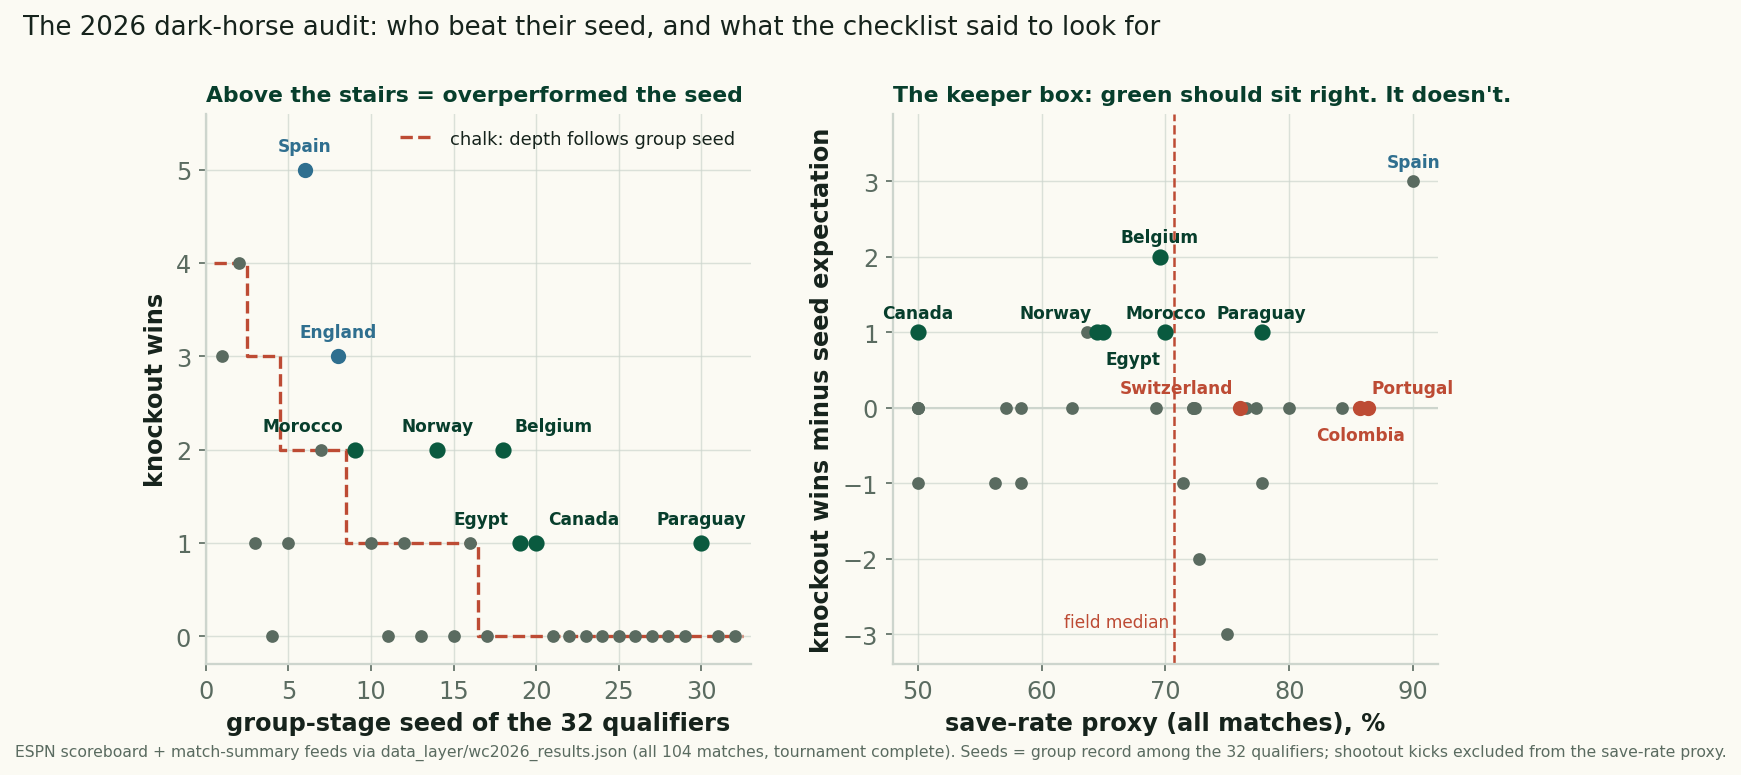
Six teams beat their group seed at the 2026 World Cup, scored against our pre-tournament checklist: the keeper box failed, the kind draw barely helped.
Category · 61 articles
The first 48-team World Cup, read through data.
The 2026 World Cup was the biggest the game has ever staged: 48 teams, 104 matches, three host nations, and a format football had never tried. This series grounds the whole thing in numbers — the arithmetic of the expanded bracket, what recent and historical tournaments say about goals, upsets and favourites, and then the tournament itself, read match by match off the completed record.
The tournament is over: Spain beat Argentina 1–0 in the final on 19 July 2026. The 61 pieces below span all three phases and are left standing as they were written. First the previews — the format explained, the history quantified, the methods that turn a draw into probabilities, each labelled as a model rather than a forecast of fact. Then the round-by-round coverage, written from finished matches as the bracket emptied. Then the retrospectives, which go back over the previews and grade them, including where they were wrong.
Every 2026 figure in this category is computed from the 104-match dataset this site publishes at /data/wc2026_results.json, so you can recompute any of it yourself. No number here describes a match that was not played.
Six teams beat their group seed at the 2026 World Cup, scored against our pre-tournament checklist: the keeper box failed, the kind draw barely helped.
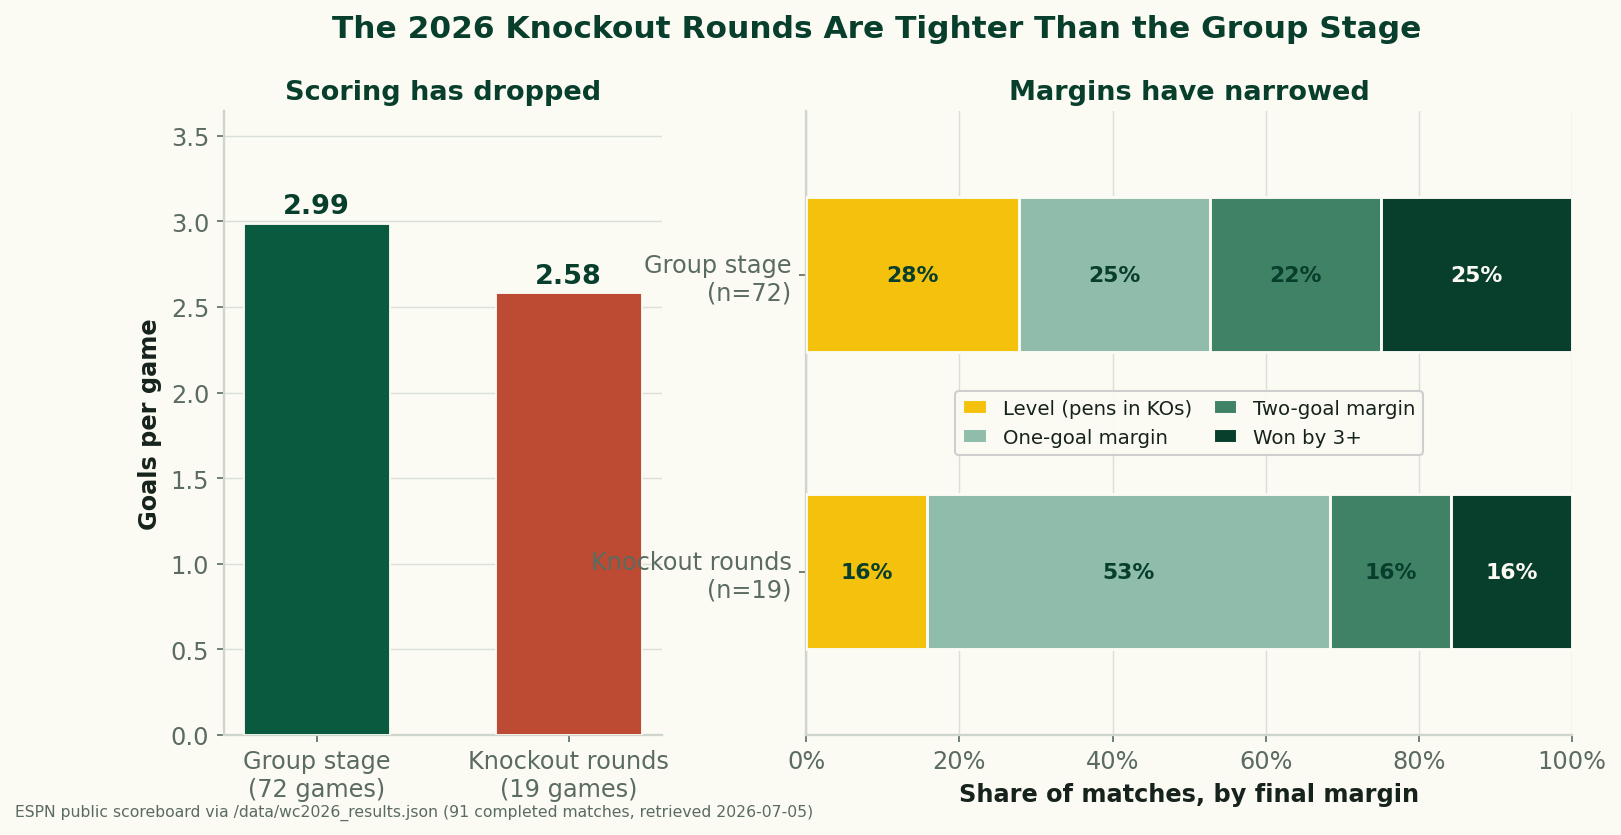
Retro #4 closes the series: the shootout rate fell to 12.5% of knockout games from 2022's 31%, all four came early, and survivors went 1-3 next time out.
Group-stage points strongly predicted knockout survival: 9-point teams went 3-for-3, 4-point teams 2-for-11, and the last four all ranked top-8.
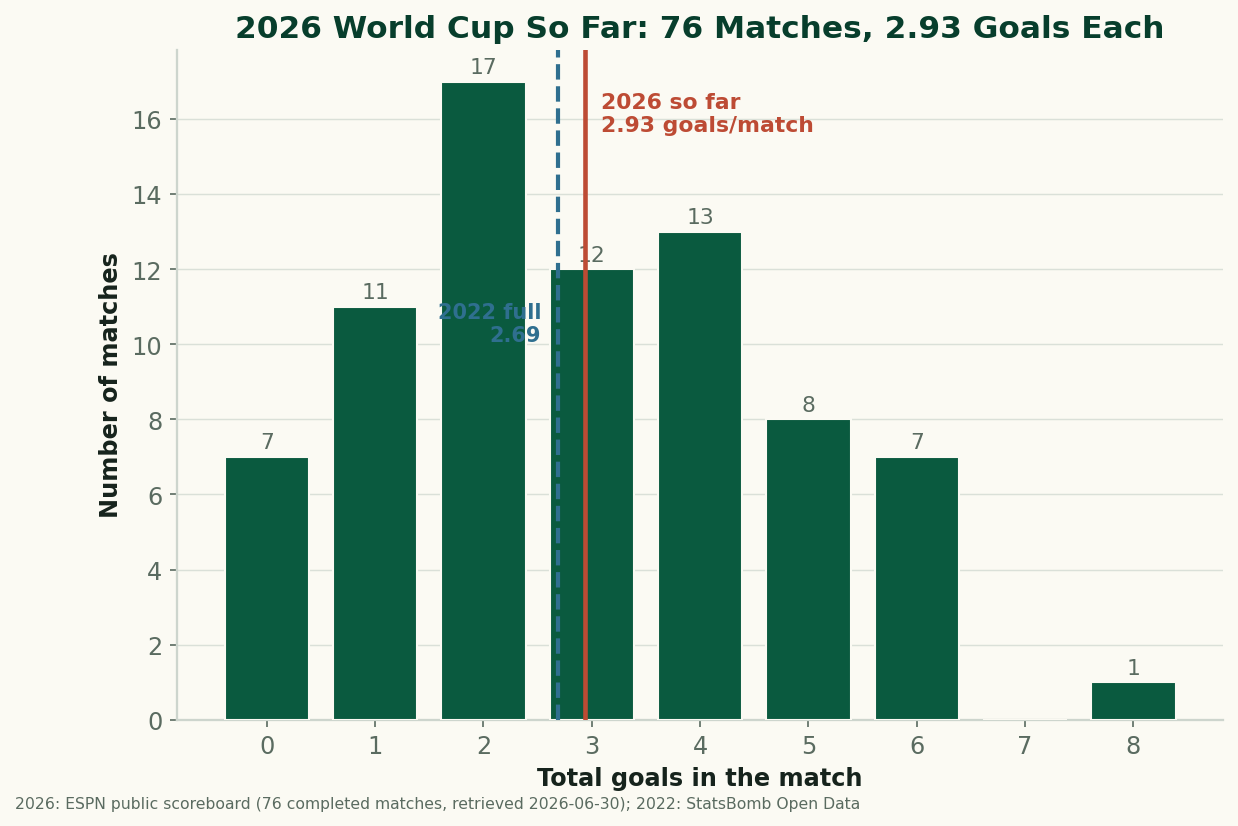
The 2026 World Cup, by the numbers from completed matches only: goals per game vs 2022, draws, and blowouts. The final numbers, across all completed matches.
The 2026 World Cup's last rounds: a 12-goal quarter-final round, the semi-finals previewed and reviewed, and Spain 1-0 Argentina in the final.
Spain concede their first goal of the tournament and win anyway, on 67.9% of the ball and 17 shots to 5. The quarter-final ledger, and the semi ahead.
France beat Morocco 2-0, the same scoreline as their 2022 semi-final, on 48% possession and 22 shots to 5. The tournament's first semi-finalist.
Switzerland completes the quarter-final field. The full bracket is set and the rest math is nearly fair, except for Belgium's three-day turnaround.
Spain haven't conceded in five games, Belgium shoot more than anyone, Argentina are perfect — and the eighth chair is one of two opposites, both profiled.
Argentina survive Egypt 3-2, Switzerland and Colombia play the knockouts' first 0-0, and the fourth shootout leaves the last quarter-final seat unnamed.
The host's file: 3W-2L, plenty of possession, and shots on target that read 6, 2, 7, 2, 2 — the American attack shrank each round until Belgium exposed it.
Canada, Mexico and the USA fell on three straight nights. Spain and Belgium join the last eight and round-of-16 scoring holds at 3.0 a game.
The team that wins the corner count wins the match 52% of the time — a coin flip. What 184 team-games say about football's most over-celebrated statistic.
Norway's first World Cup since 1998, quantified: four wins in five, a 22.6% conversion no rival matches, no clean sheets, and 66% of the ball against Brazil.
Full-tournament statistical profiles of Morocco, France, Norway and England — record, scoring, possession, shot volume and conversion across five games each.
Four of eight last-16 ties are done: Morocco, France, Norway and England advance, Canada and Mexico are out, and the busier attack lost three.
Every 2026 World Cup knockout result in one table, and a review of all 28 decided games: pre-match possession picked the winner 82% of the time.
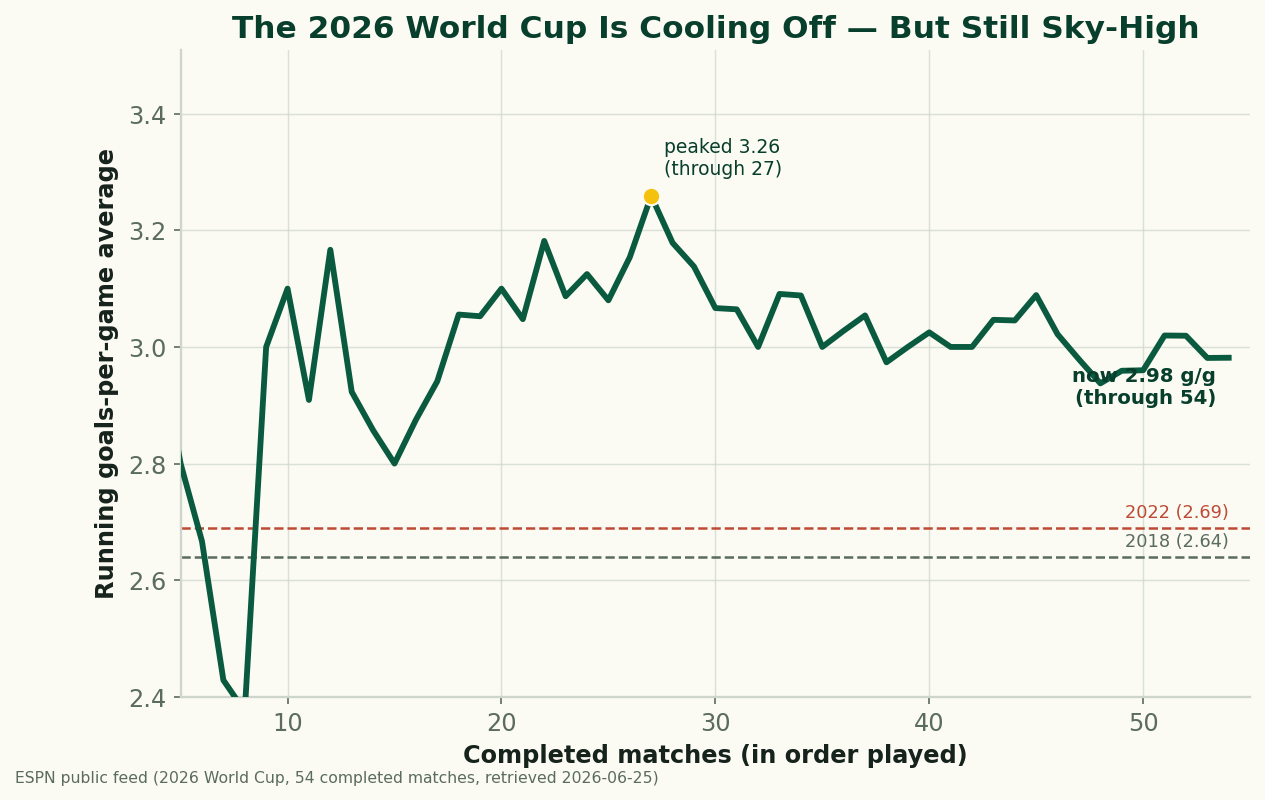
2026 World Cup scoring against ninety years of tournaments: cooling after a hot start, more draws and blowouts than 2022, and tighter knockouts.
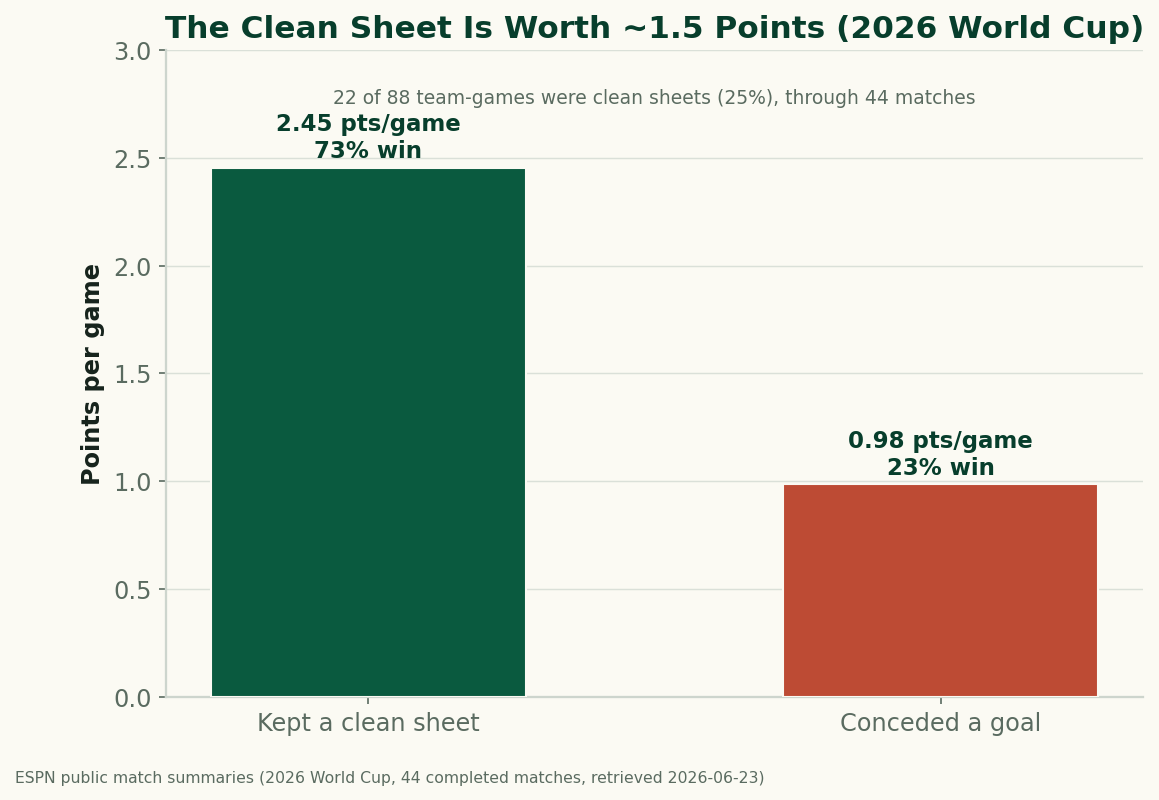
Through 44 matches, a team keeping a clean sheet at the 2026 World Cup averages 2.45 points and wins 73% of the time; a team that concedes averages under 1.
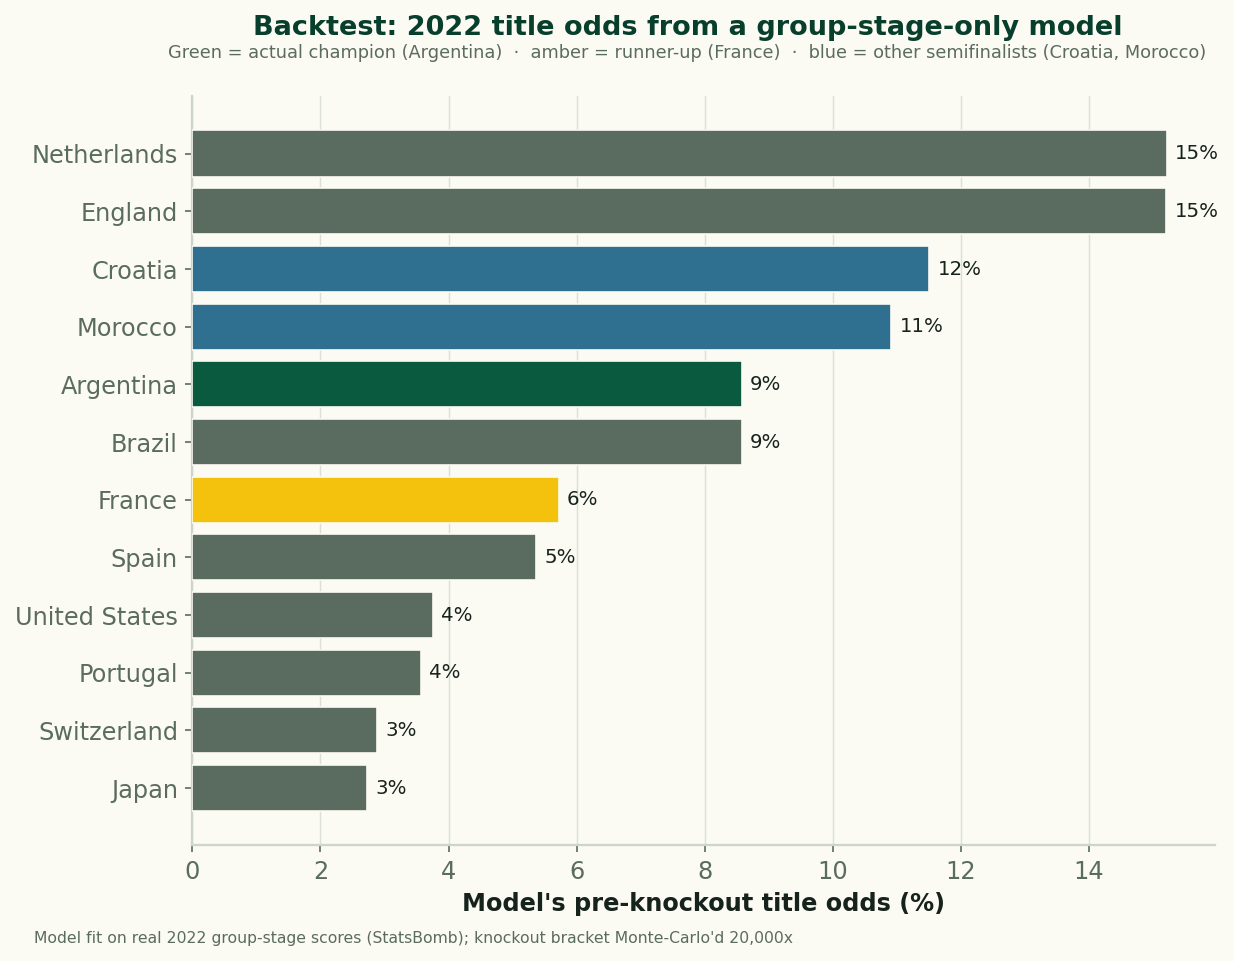
A transparent Poisson prediction model, fit only on 2022 group-stage scores and Monte-Carlo'd through the real knockout bracket 20,000 times.
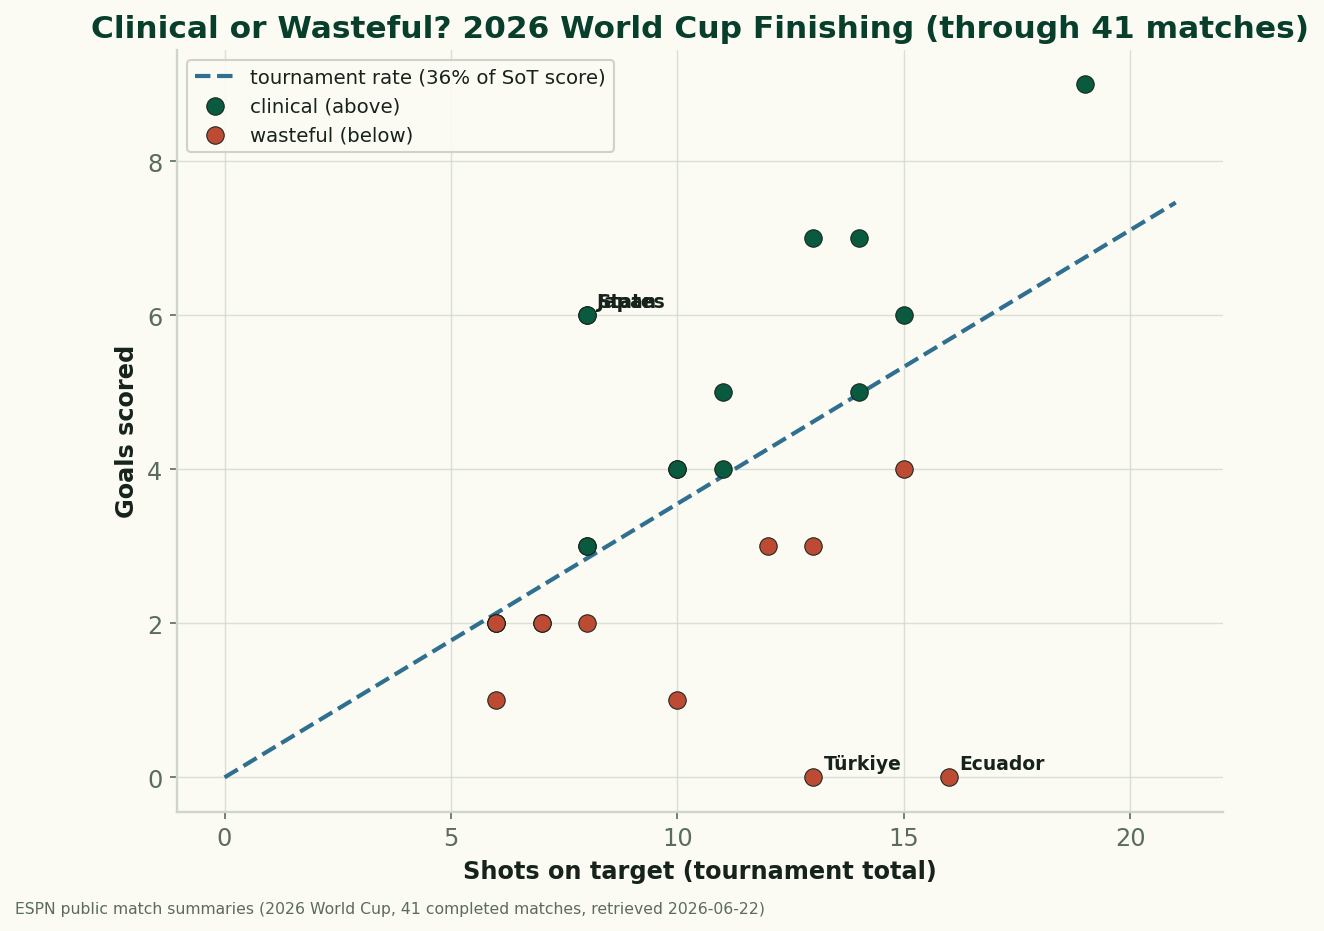
Through 41 completed matches, about 35% of shots on target at the 2026 World Cup have become goals. Why most team extremes are luck, not skill.
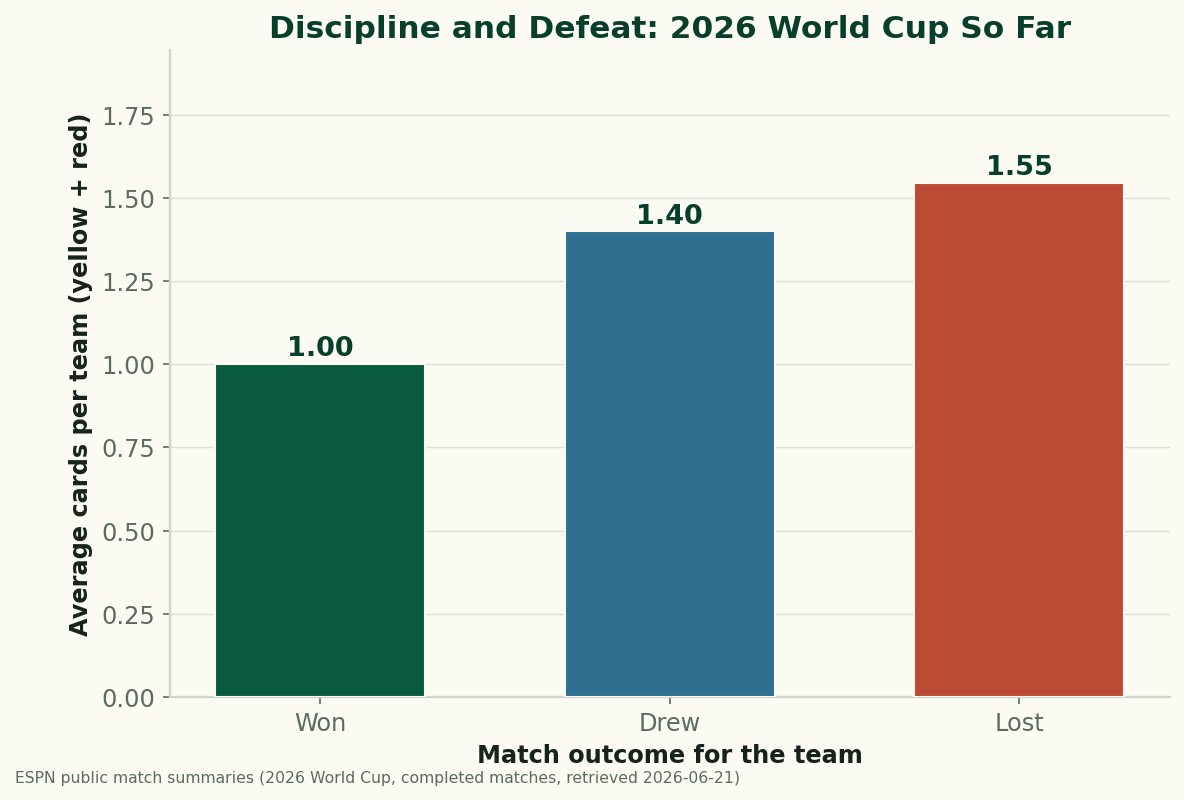
Through 32 completed matches the 2026 World Cup averaged 2.4 yellow cards and 22.8 fouls a game, and the losing teams were the most carded.
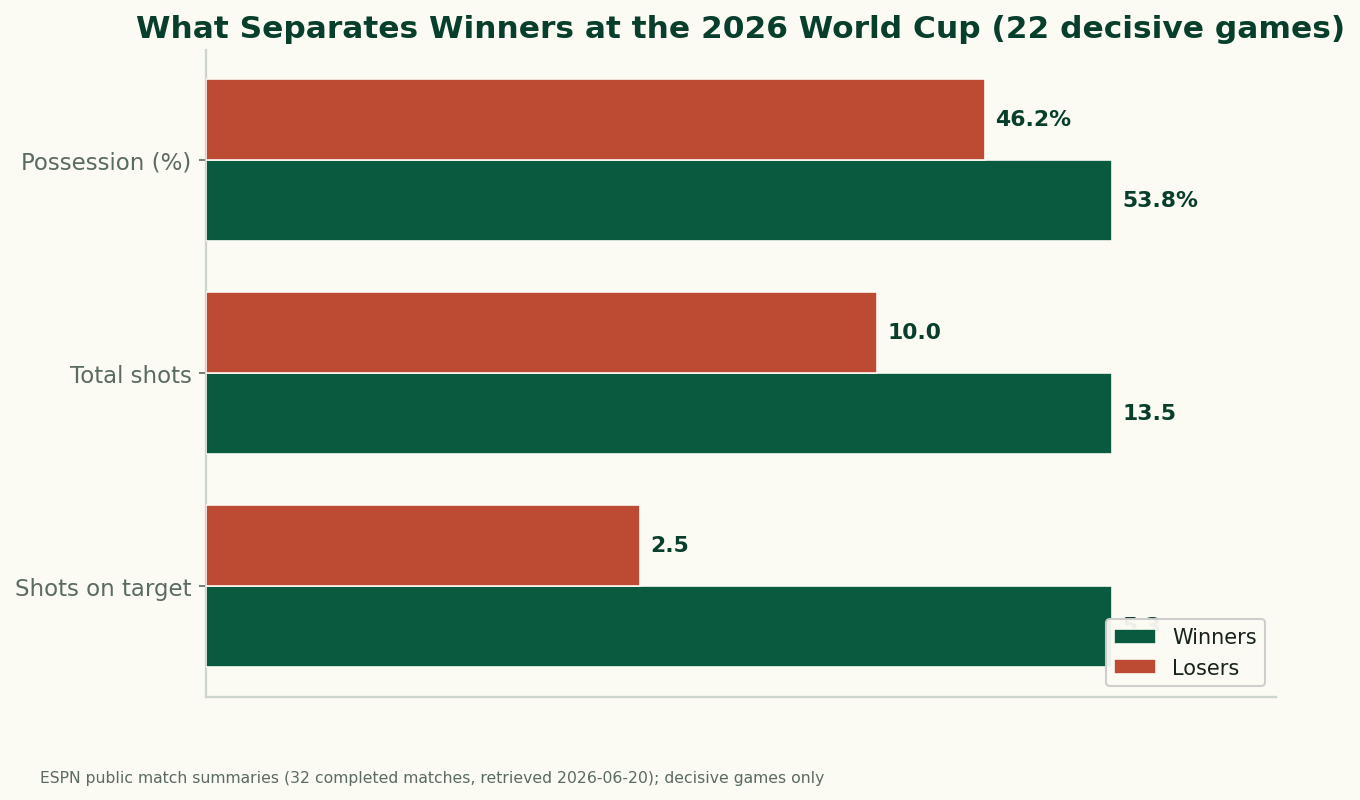
Across the first 32 completed 2026 World Cup matches, the higher-possession team won just 64% of decisive games — the team with more shots on target won 84%.
How to use expected goals while a tournament is happening without being fooled by one-match noise. What a single game's xG can and cannot tell you.
How a Monte Carlo World Cup simulation works, and why the best team wins a single-elimination bracket far less often than its match odds suggest.
Low-scoring, tense, and increasingly decided after 90 minutes. A data history of the World Cup final — goals, extra time, shootouts, and the 2022 epic.
Mexico City sits 2,240m above sea level; summer in Texas bakes. How altitude and heat have shaped past matches and could shape play at the 2026 venues.
Two from each group isn't enough to fill a 32-team knockout. How the eight best third-placed teams qualify, ranked across groups — and why it's awkward.
The biggest World Cup upsets, ranked by the gap between favourite and result, and the case on whether a 48-team field produces more of them.
From 32 teams to a champion, ten thousand times over. Build a World Cup knockout bracket simulator in Python and turn team ratings into title odds.
Box scores lie; xG keeps count. Build a tournament xG tracker in Python that turns a match-by-match xG table into cumulative team performance.
Ninety years of scoring in one chart. Use Python and matplotlib to plot World Cup goals per game by year - and learn to source and tidy a historical dataset.
Every champion has come from Europe or South America. How each confederation has fared, and whether expanded 2026 slots can finally break the duopoly.
Where to get real numbers during the tournament. The free and public data sources for following World Cup 2026 — xG, shot maps, and historical context.
Three group games and a coin-flip knockout aren't much to judge a team on. How to read a short tournament without overfitting to tiny samples.
Stoppage-time winners, golden goals, and 120-minute marathons. The data behind World Cup drama — when goals arrive, and how often knockouts go the distance.
The group-stage narratives to distrust (peaking at the right time, the dead rubber) and the numbers that actually carry into the knockouts.
How many points does it take to get out of a World Cup group? The historical thresholds — and what the new eight-best-thirds rule does to the math.
Hosts win more than they should. The record of World Cup host nations, the six who lifted it at home, and the data behind tournament home advantage.
Most first-timers go home after the group stage — but not all. How World Cup debutants have fared historically, and what 48 teams means for the newcomers.
Before a ball is kicked, a number rates every team. How Elo- and SPI-style power ratings build a World Cup pecking order, and how they turn into title odds.
The pre-tournament favourite lifts the World Cup less often than you would think. The base rate, and why a short knockout punishes the best team.
The teams that overperform share a profile: underrated quality, a hot keeper, a kind draw, and a set-piece edge. How to find a World Cup dark horse with data.
The scoreline is the headline; xG is the story underneath. How to watch World Cup matches through expected goals without mistaking one game for a verdict.
From the WM and Total Football to tiki-taka and the modern press, the World Cup has been tactics' biggest stage. How the ideas evolved.
With 48 teams in four-team groups, is the 'group of death' dead? The seeding-and-strength math behind how hard a group can really be.
Croatia's two finals from a country of four million, Morocco's 2022 semi-final, South Korea 2002: the most improbable World Cup runs, by the numbers.
A shootout isn't a lottery you can't prepare for. What the data says about penalty prep — order, keeper homework, where to aim, and the going-first edge.
Dots sized by danger. A quick visual guide to reading a World Cup shot map — what the circles mean, what to look for, and how it reveals a deserved result.
Qatar 2022 fit in one city; 2026 spans a continent. How travel, time zones, and a sprawling host map could quietly shape the tournament.
Tight games, dead balls, and the margins that decide tournaments. Why set pieces matter more at the World Cup, and the rise of the corner as a weapon.
Four teams, three matchdays, one qualification question. Simulate a World Cup group in Python with a Poisson model and find each team's odds to advance.
Five substitutes, a longer bracket, and summer heat. Why squad depth matters more at the 2026 World Cup than at any tournament before it.
Just Fontaine's untouchable 13, Klose's all-time 16, and the modern races won with six. A history of World Cup goalscoring and the Golden Boot.
From 32 teams to one. The 2026 knockout bracket adds a full extra round: what the path to the final looks like, and how many games the winner survives.
Squad quality, a good goalkeeper, and a kind draw. What actually predicts a deep World Cup run — and the things (recent form, friendlies) that don't.
The expanded World Cup runs 104 matches with only 16 more teams. The arithmetic of the new 48-team format, and where every extra game comes from.
More teams, more money, more dead rubbers? The case for the 48-team World Cup, the trade-offs, and the long history of the tournament getting bigger.
How shot-stopping above expectation swings knockout football, and how post-shot xG grades goalkeepers by how hard the shots they faced were to save.
Level on points? The order FIFA breaks World Cup group ties — points, goal difference, goals scored, and the criteria most fans forget.
Since 1982 the World Cup has been decided by penalties more than once. A statistical history — conversion rates, the going-first edge, famous misses.