Football, told in numbers

Read the game by its numbers.

Expected goals, pressing intensity, ball progression and projection models — explained in plain language and computed from public data, with every figure traceable to a script you can run yourself.

Latest analysis

All deep dives →
World Cup 2026

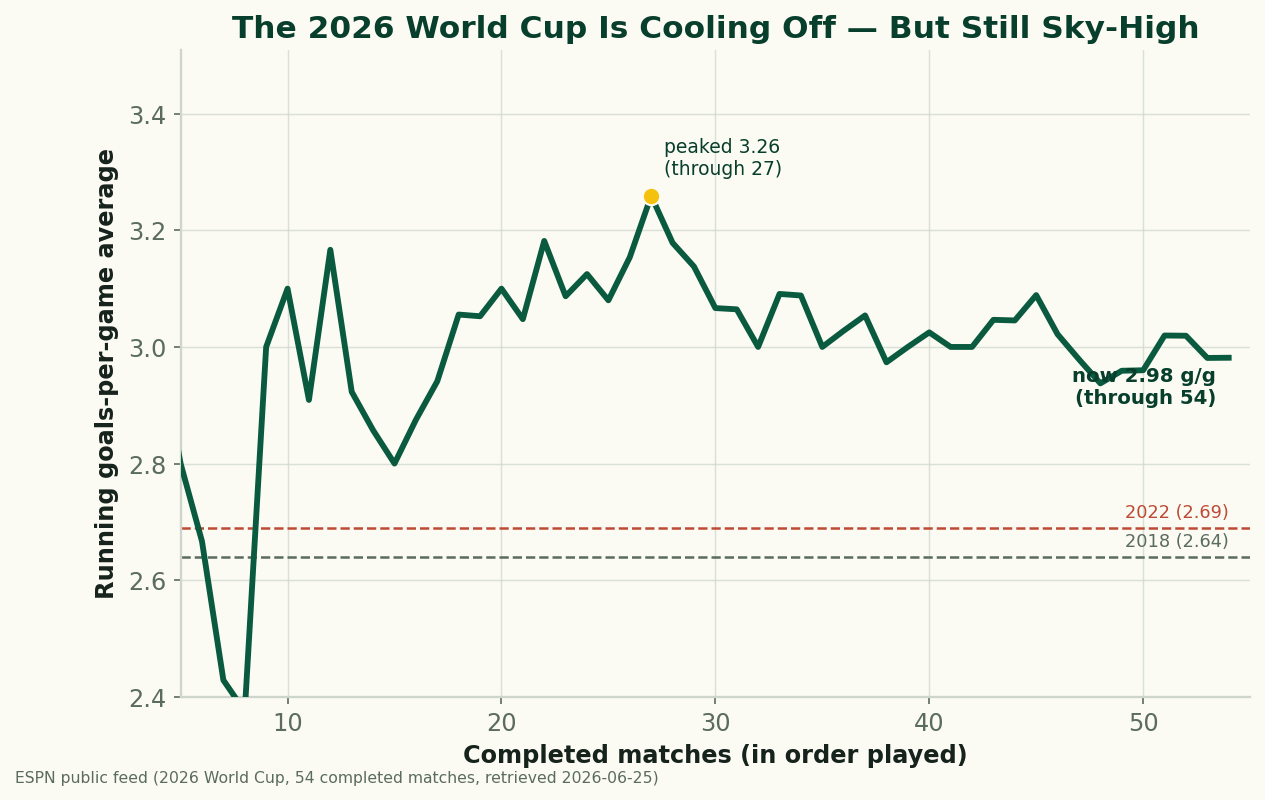
The 2026 World Cup So Far, By the Numbers: Just Under 3 Goals a Game

Through 76 completed matches, the 2026 World Cup is still outscoring 2022 — 2.93 goals a game to 2.69. After an early spike the rate has settled just under 3 a game. The real, sourced numbers on goals, draws, and the blowouts behind them, with honest caveats about a group-stage-only sample. (A living snapshot, refreshed as games are played.)

6 min read
Data Deep-Dives

Headers vs. Feet: Which World Cup Shots Actually Go In?

Using StatsBomb data for all 64 matches of the 2022 World Cup, headers and feet convert at almost the same rate (11.1% vs 10.5%) — but only because headers come from higher-quality positions. Relative to chance quality, foot finishing beat the model, and the left foot was the most clinical of all.

6 min read
Data Deep-Dives

Set Pieces, Open Play, and Counters: Where 2022 World Cup Goals Came From

Using StatsBomb's data for all 64 matches of the 2022 World Cup, we trace every goal back to how the possession began. Set pieces (corners and free kicks) originated 30% of non-penalty goals; open play 46%; and counter-attacks, though rare, converted at 17.9% — nearly double the open-play rate. Where goals really come from.

5 min read
Data Deep-Dives

When World Cup Goals Are Scored: The Timing of 2022's 152 Goals

Using StatsBomb's data for all 64 matches of the 2022 World Cup, we map exactly when the goals went in. The second half produced 61% of them to the first half's 39%, the busiest phase is the run-up to halftime, and stoppage time is wildly productive for the minutes it gets. The clock is not neutral.

4 min read

Numbers, with the working shown

SoccerAnalytics.net is an independent publication about the measurable side of football. The aim is simple: take the metrics that now shape how clubs recruit, coaches plan and broadcasters talk — expected goals, expected threat, PPDA, progressive actions, post-shot xG — and explain what they actually measure, where they come from, and where they break.

Nothing here is hand-waved. Every chart and table is built from public data — primarily StatsBomb open data, supplemented by Understat and FBref — and the Python script that produced it ships alongside the article so you can re-run the numbers or learn from the code. When a figure can't be sourced from a real data pull, it doesn't get published.

If you want the metrics explained honestly, the tutorials to compute them yourself, and the occasional argument about what the data does and doesn't prove, you're in the right place. Start with the stat explainers, or learn to pull the data yourself.