Do Football Goals Follow a Poisson? Testing the Standard Model on All 64 Games of 2022
Every scoreline prediction in football rests on the Poisson. We fit it to all 64 games of 2022 — it gets the shape right, but real goals are overdispersed.
Category · 19 articles
What the numbers actually measure, in plain language.
Every few years a new metric jumps from analytics Twitter to the broadcast graphics, usually with no explanation of what it means or how it was built. This is where those metrics get unpacked — not just the definition, but the data and the maths underneath, and the situations where each one quietly misleads you.
If you've ever wondered how an expected-goals model is actually trained, why raw tackle counts flatter passive teams, or what PPDA is really counting, start here.
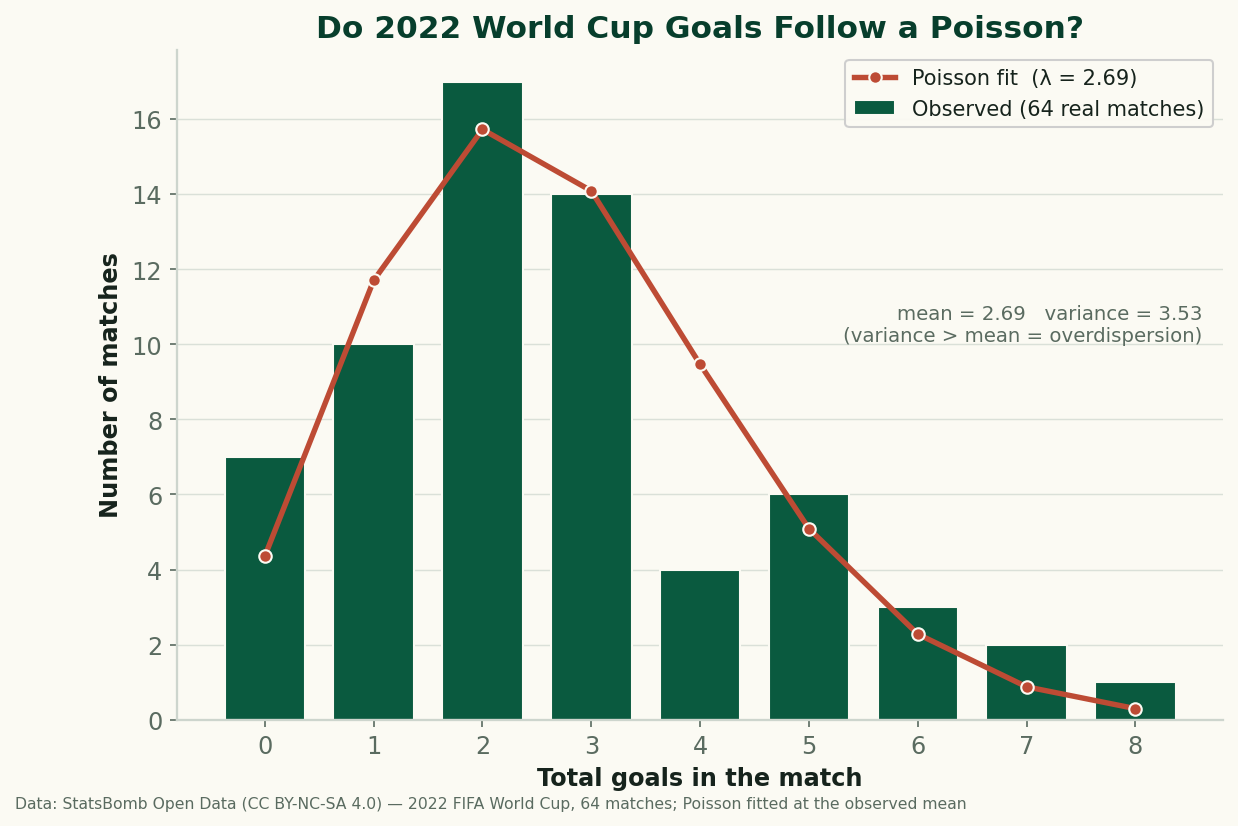
Every scoreline prediction in football rests on the Poisson. We fit it to all 64 games of 2022 — it gets the shape right, but real goals are overdispersed.
Aerial-duel win percentage, why raw counts mislead, and where aerial dominance actually matters — set pieces, target men, and defending crosses.
Expected points (xPts) simulates a match from its shot-level xG to get win, draw and loss odds — points that reward chances created, not goals that went in.
Short versus long goalkeeper distribution, launch %, pass completion under pressure, and how a keeper's distribution choices shape a team's buildup.
How field tilt is actually computed from event data — the measurement choices nobody documents, what the number predicts, and the three ways it fails.
A long throw-in into the box functions like a corner you can take from anywhere down the touchline. Why it works, and the xG case for and against it.
A field guide to score effects in the data you actually have: which metrics are worst hit, how to spot the distortion without event data, and what survives.
A PPDA number lands in front of you. Which way does the scale run, what counts as high, and what can you honestly conclude from it?
xG only values shots. Possession-value models score every action - a pass, a carry, a tackle - by how much it changes the odds of scoring. How VAEP works.
A defender who makes lots of tackles might be badly positioned. Why raw tackle and interception counts mislead, and how to read defensive actions in context.
You can dominate the ball and still play it nowhere dangerous. Field tilt measures territory — whose final third the game is actually being played in.
Shot- and goal-creating actions credit the two moves before a shot; expected assists and expected threat measure the creativity raw assist counts miss.
A team dominating possession might just be losing. Why you can't read match stats without the scoreline — and how good analysis adjusts for game state.
Corners feel dangerous and mostly aren't: what a set piece's expected-goals value really is, and the trade-offs of zonal, man and hybrid marking.
Most of the players who create a goal never touch it last. xGChain and xGBuildup credit the whole possession - here's how they work and who they reveal.
A plain-language guide to expected goals — what xG measures, how the model is trained on shot features like distance and angle, and how to read it.
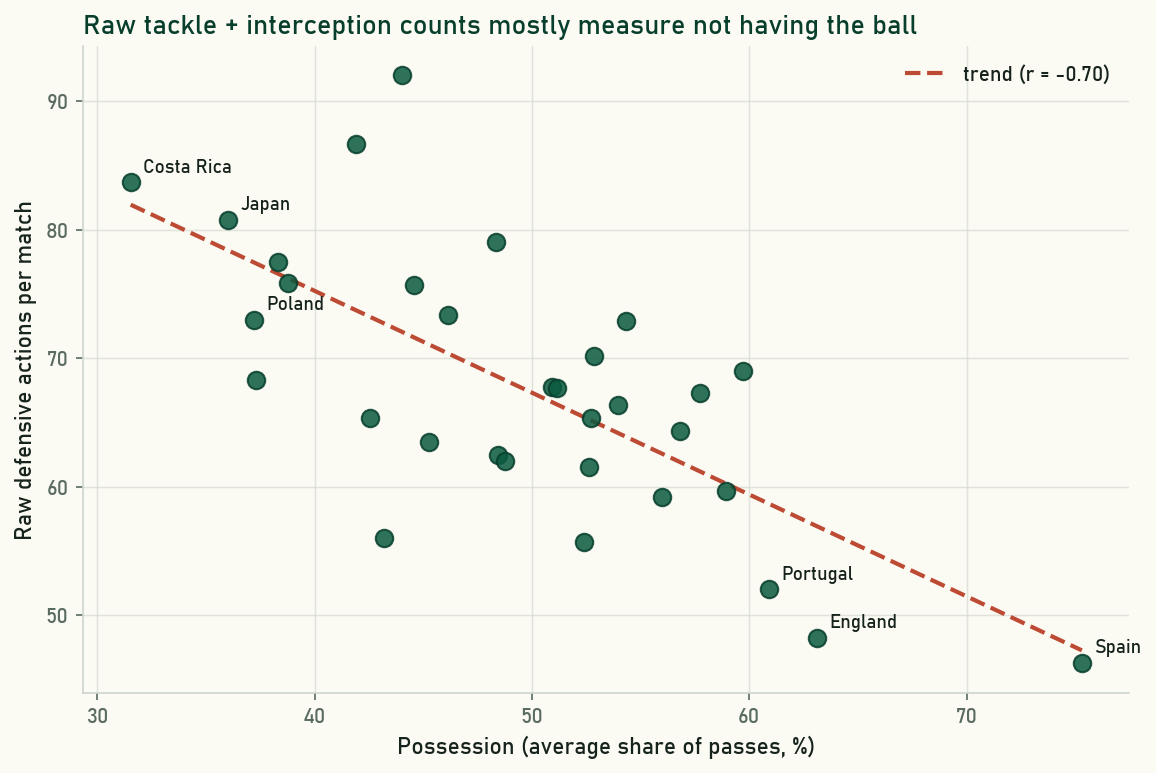
Raw tackle and interception counts mostly measure how little a team has the ball. Possession-adjustment fixes that: the problem and a worked example.
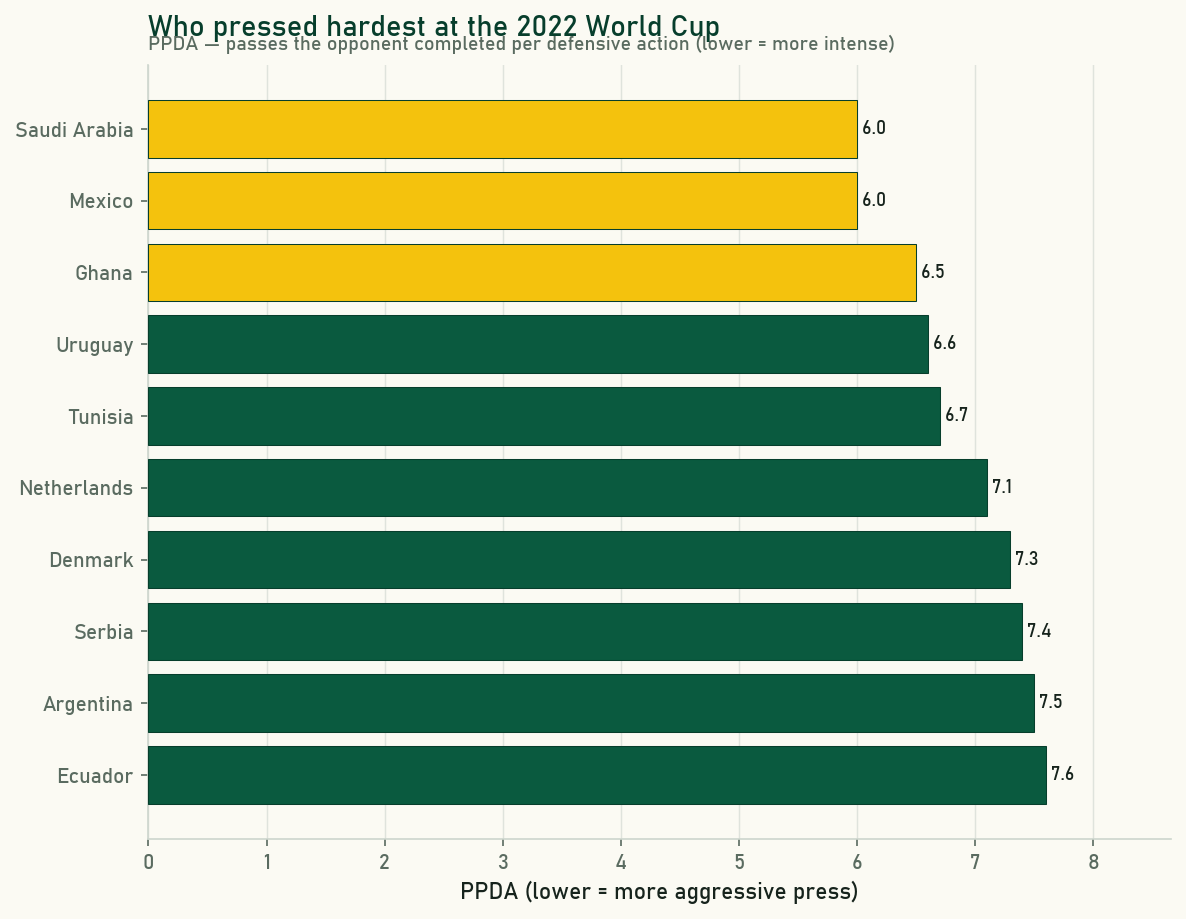
PPDA - passes allowed per defensive action - is how analysts put a number on pressing. What it measures, exactly how it is computed, and where it misleads.
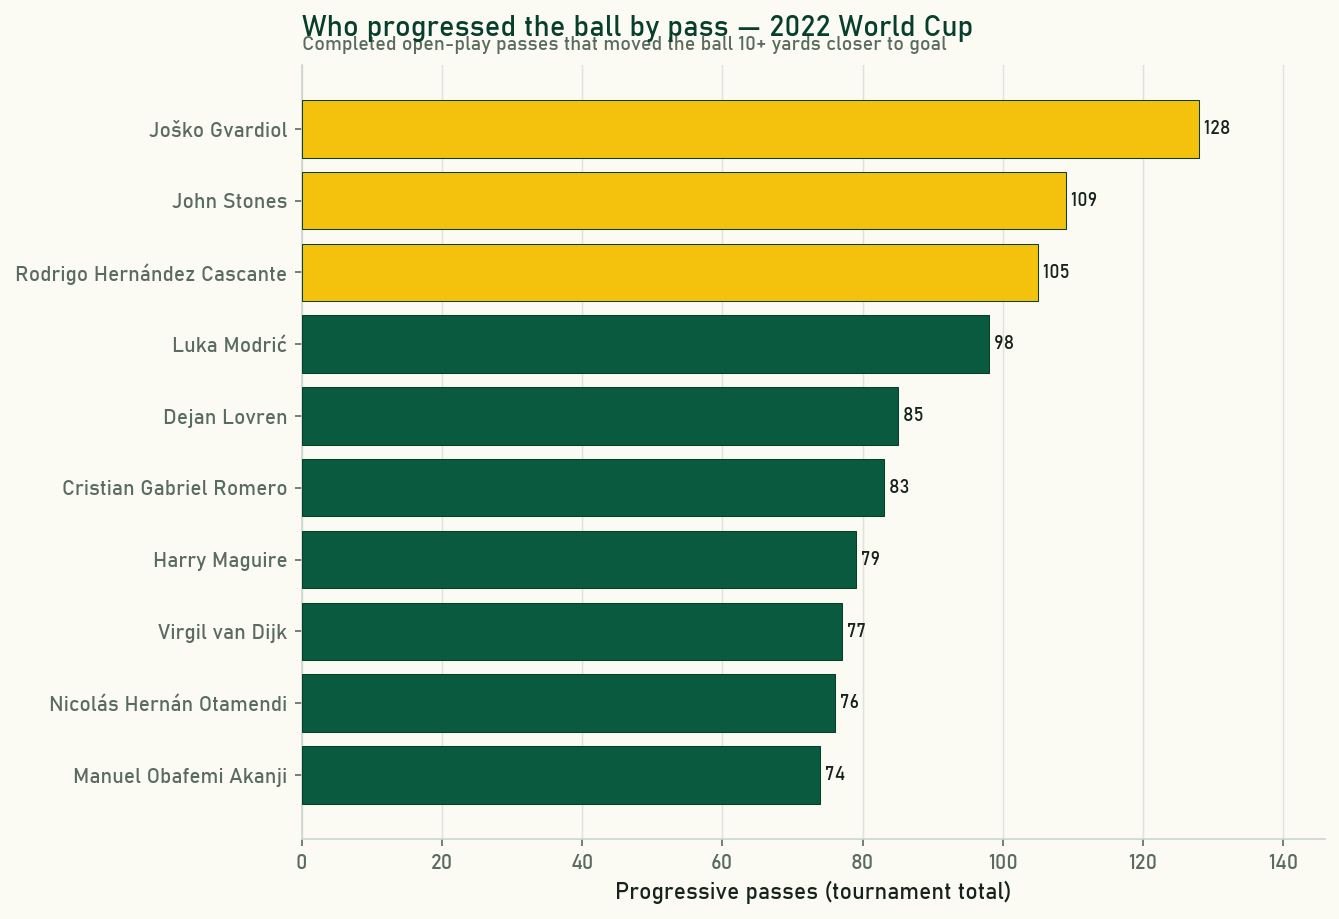
Progressive passes and carries measure who actually moves the ball toward goal. The definitions, and why centre-backs and deep midfielders dominate.