Tutorials
Build a Player Radar (Pizza) Chart in Python with mplsoccer
A radar (pizza) chart turns a player's percentile profile into one glance. Build one in Python with mplsoccer's PyPizza, from a handful of per-90 metrics.
Category · 8 articles
Pull the data and draw the charts yourself.
Reading analysis is one thing; producing it is another. These tutorials take you from a blank file to a real pass map, shot map or xG table, using free public data and free open-source tools — mostly Python with statsbombpy and mplsoccer, with a spreadsheet option for those who'd rather not write code.
Every code block is real and runnable. Copy it, change the team, and you're doing your own analysis by the end of the afternoon.
Get the data first. Every free public soccer data source, ranked is the map: what each feed actually contains, what it costs you in licence terms and scraping etiquette, and which questions it simply cannot answer. Then getting started with StatsBomb open data gets a real event dataset onto your machine with statsbombpy.
Then draw it. Your first pass map and shot map covers the two charts every analyst makes first, and the player radar covers the one everyone makes next — including why percentile radars mislead as often as they inform. The rolling xG form chart is the same skill applied to a season instead of a match.
Then model it. The xG-difference league table needs nothing but a spreadsheet and is the cheapest useful model in football. Expected points from xG turns shot quality into a table you can compare with the real one, and the Poisson goals model goes from two team strengths to a full grid of scoreline probabilities — the engine underneath most published match forecasts.
A recent Python install, pandas, and either mplsoccer or matplotlib, except for the spreadsheet piece, which needs a spreadsheet. Every dataset used is free and public; nothing here depends on a paid feed or an API key. What these tutorials will not do is hand you a finished opinion: they stop at a working chart or a fitted model and then say plainly where its assumptions break, because a model you cannot argue with is a model you cannot use. When you want the analysis rather than the machinery, the stat explainers and player and team analysis pick up where these leave off.
A radar (pizza) chart turns a player's percentile profile into one glance. Build one in Python with mplsoccer's PyPizza, from a handful of per-90 metrics.
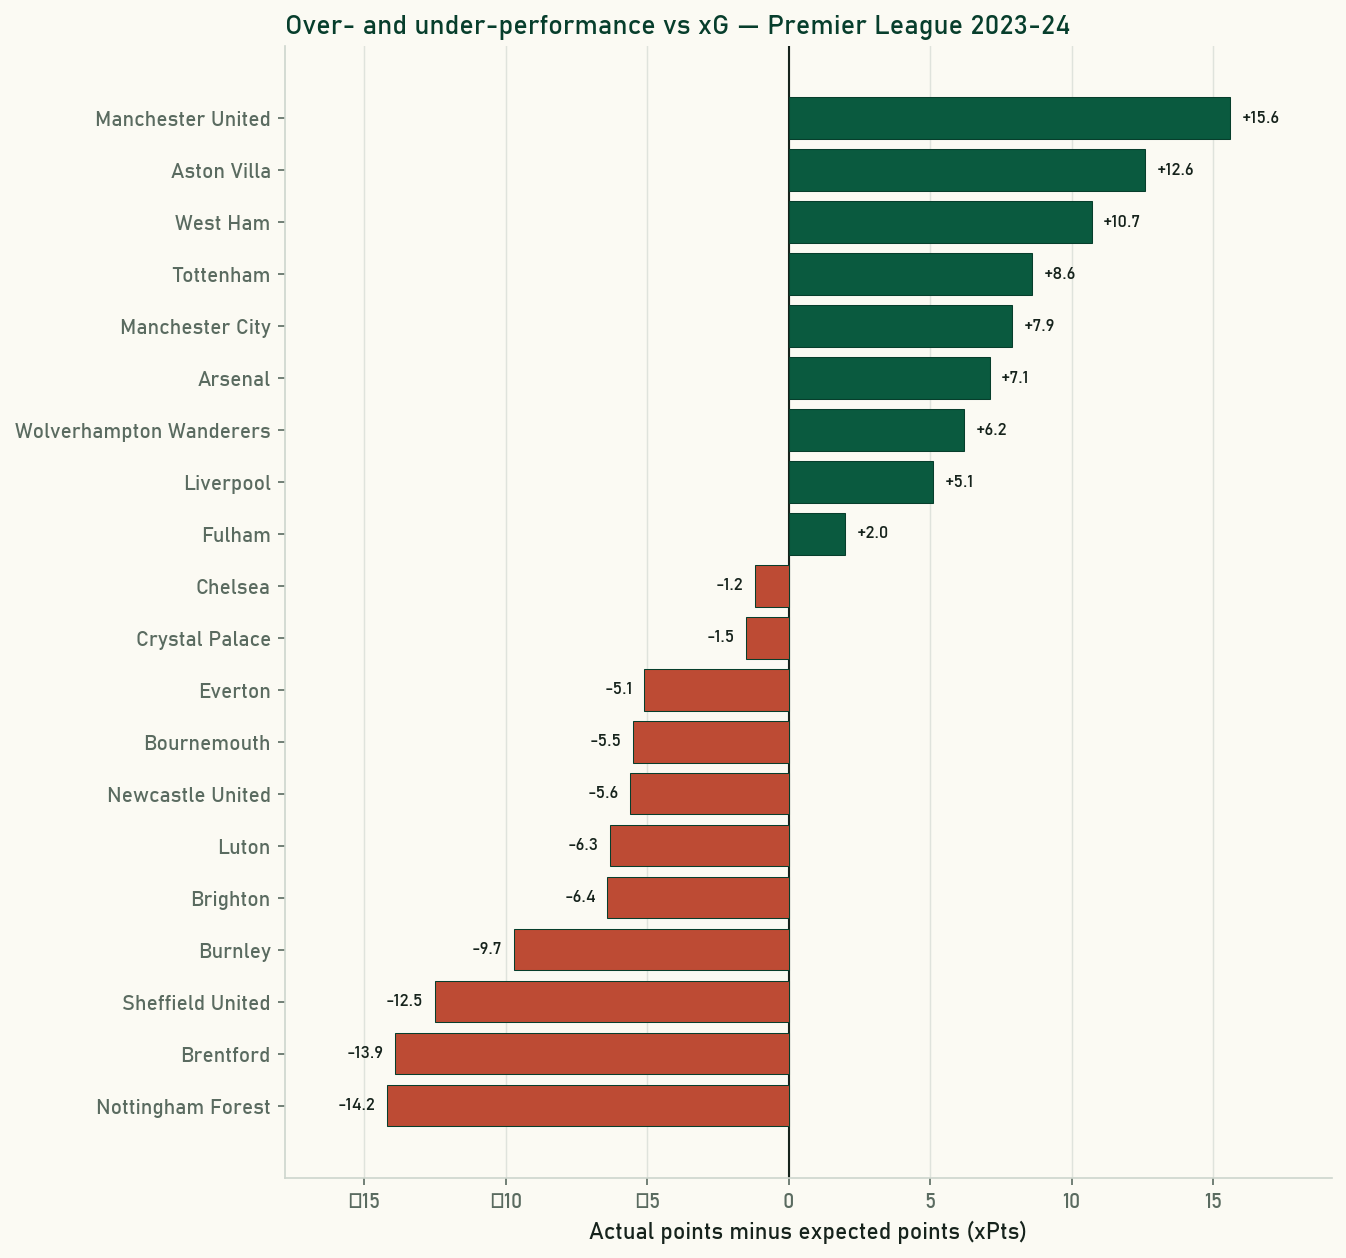
A league table rewards results; an xG table rewards process. Turn each match's xG into expected points in Python to see who's over- or under-achieving.
Goals in football are close to random, but not quite. Build a Poisson model in Python that turns attack and defence strengths into scoreline odds.
A league table hides whether a team is improving or living on borrowed time. Build a rolling expected-goals form chart in Python to see the real trend.
A no-code tutorial: build an expected-goal-difference (xGD) league table in a spreadsheet from Understat data, and spot who is over- or under-performing.
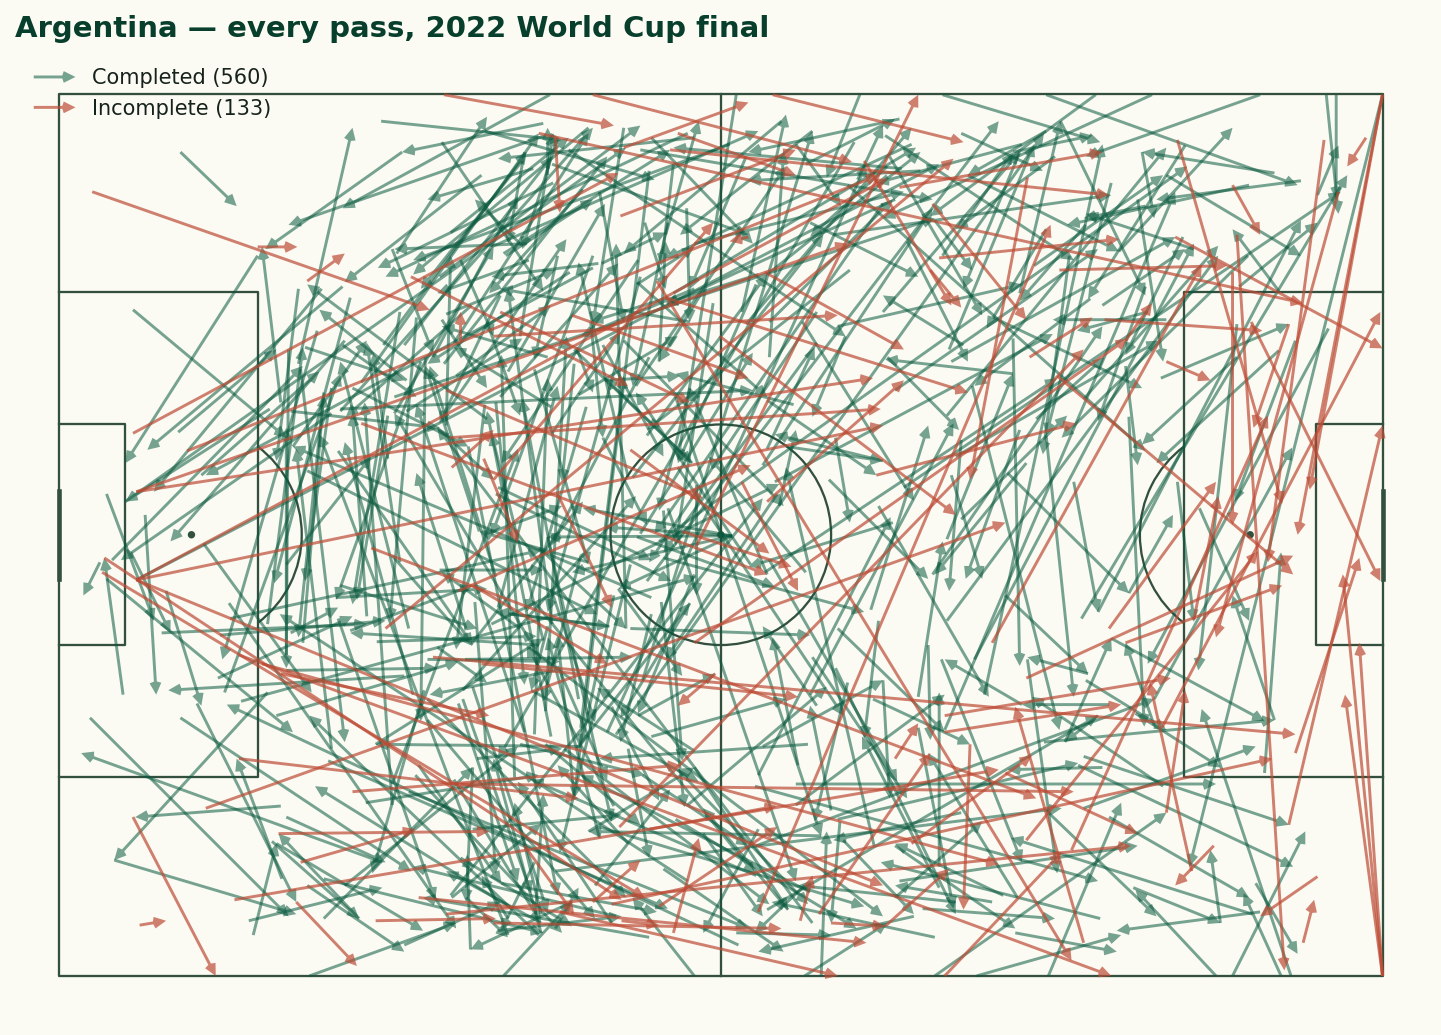
A copy-pasteable tutorial: load a real match with statsbombpy, then draw a pass map and an xG-sized shot map with mplsoccer from the 2022 final.
A practical, ranked guide to the free public soccer data sources worth your time — StatsBomb open data, Understat, FBref and more — and the catch with each.
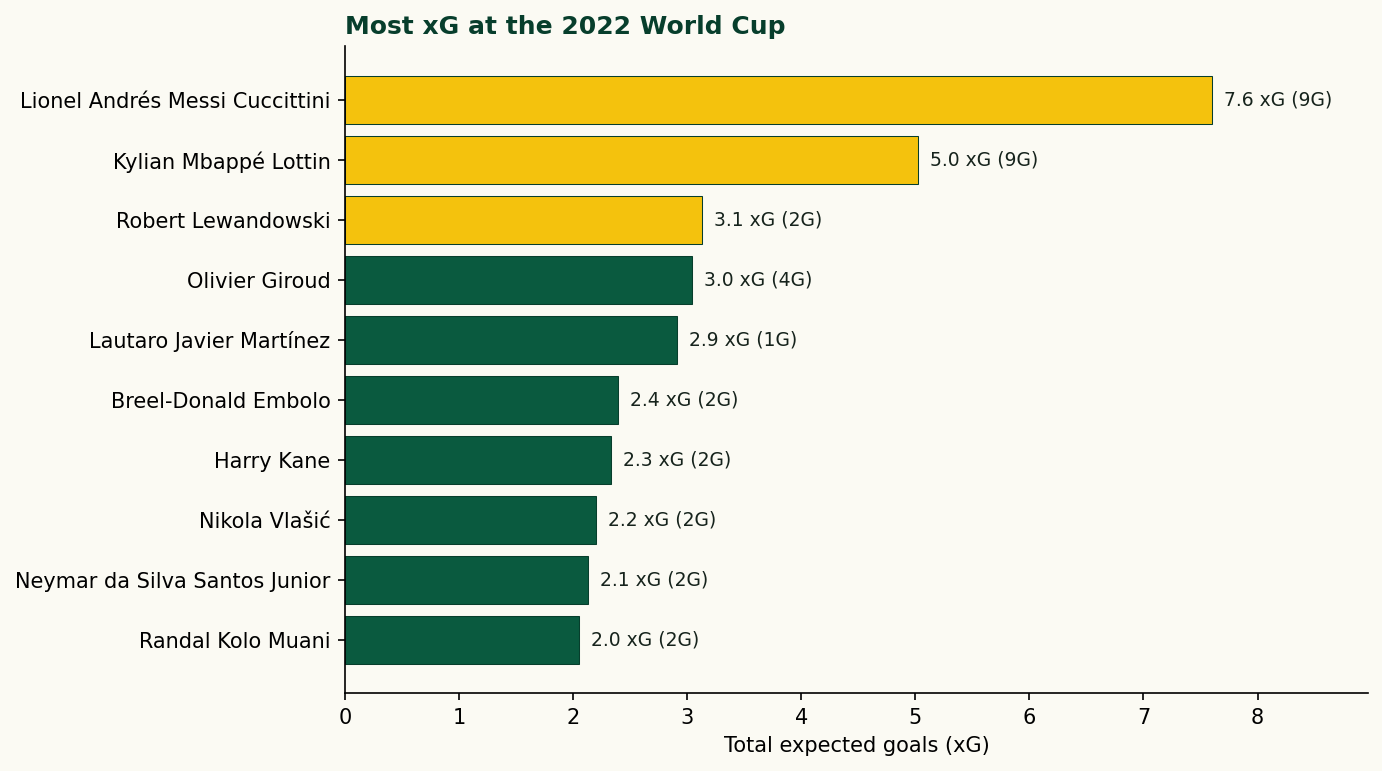
A beginner-friendly tutorial: install statsbombpy, understand the competitions-matches-events data model, and build a top-xG leaderboard in Python.