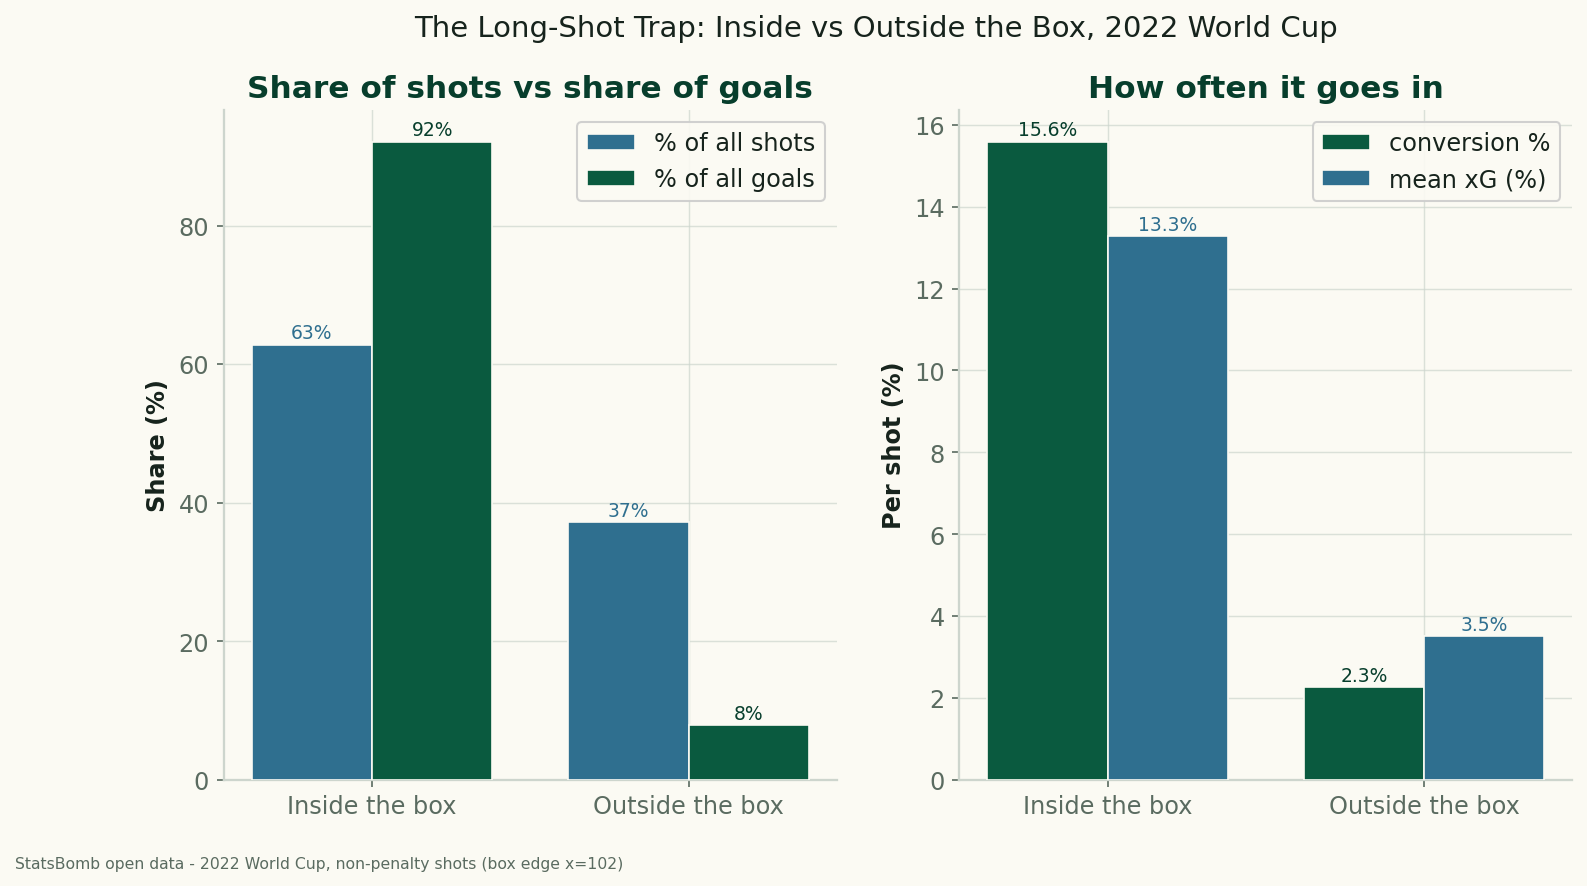
Category · 19 articles

Data Deep-Dives

Long-form analysis, built from the raw event data.

These are the longer pieces — the ones that start with a question (Is home advantage really fading? What does a World Cup actually look like in the numbers?) and answer it by pulling thousands of events and letting the distribution speak.

Each deep-dive ships with the chart, the table, the source, the as-of date and the script. No vibes, no cherry-picked single games — just the data, aggregated honestly and visualised clearly.

Data Deep-Dives

Headers vs. Feet: Which World Cup Shots Actually Go In?

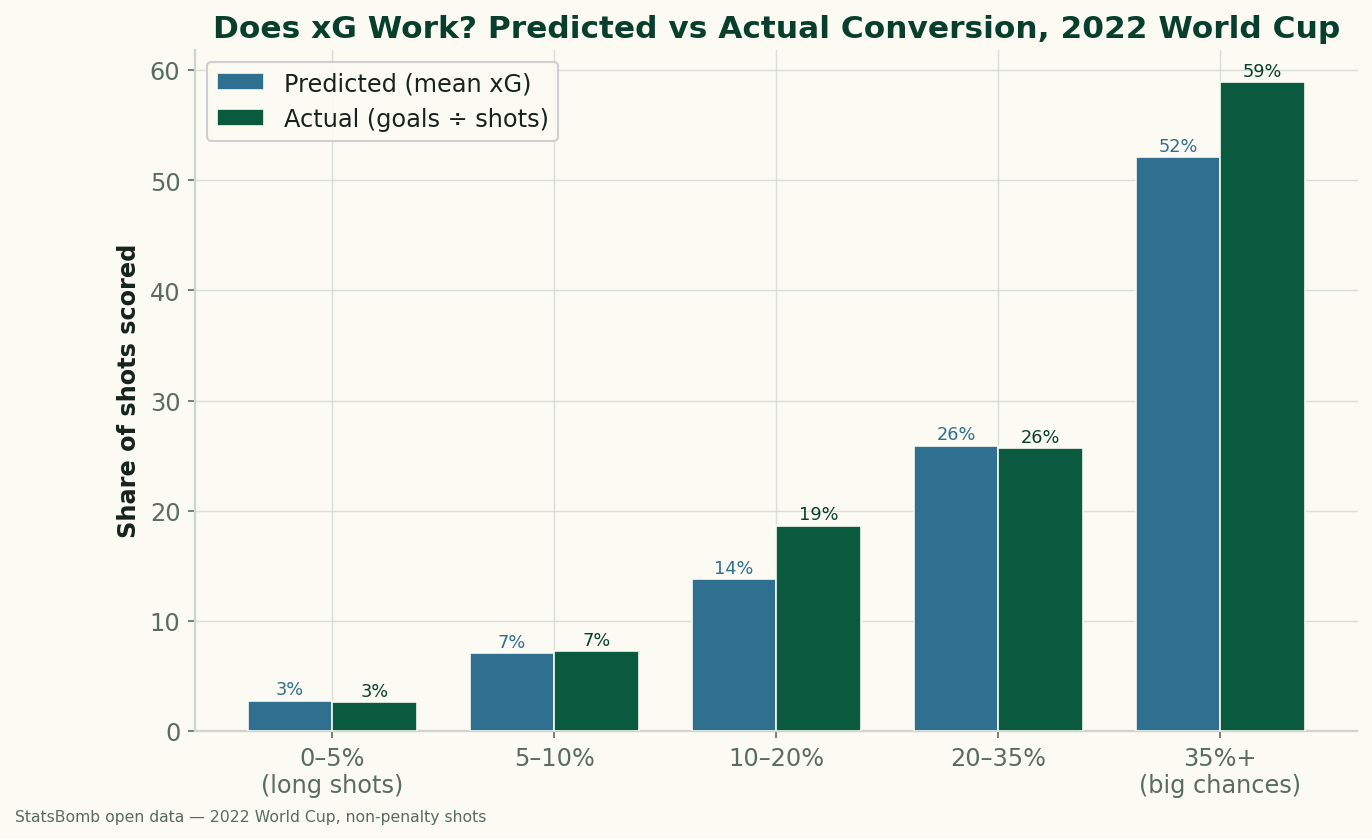
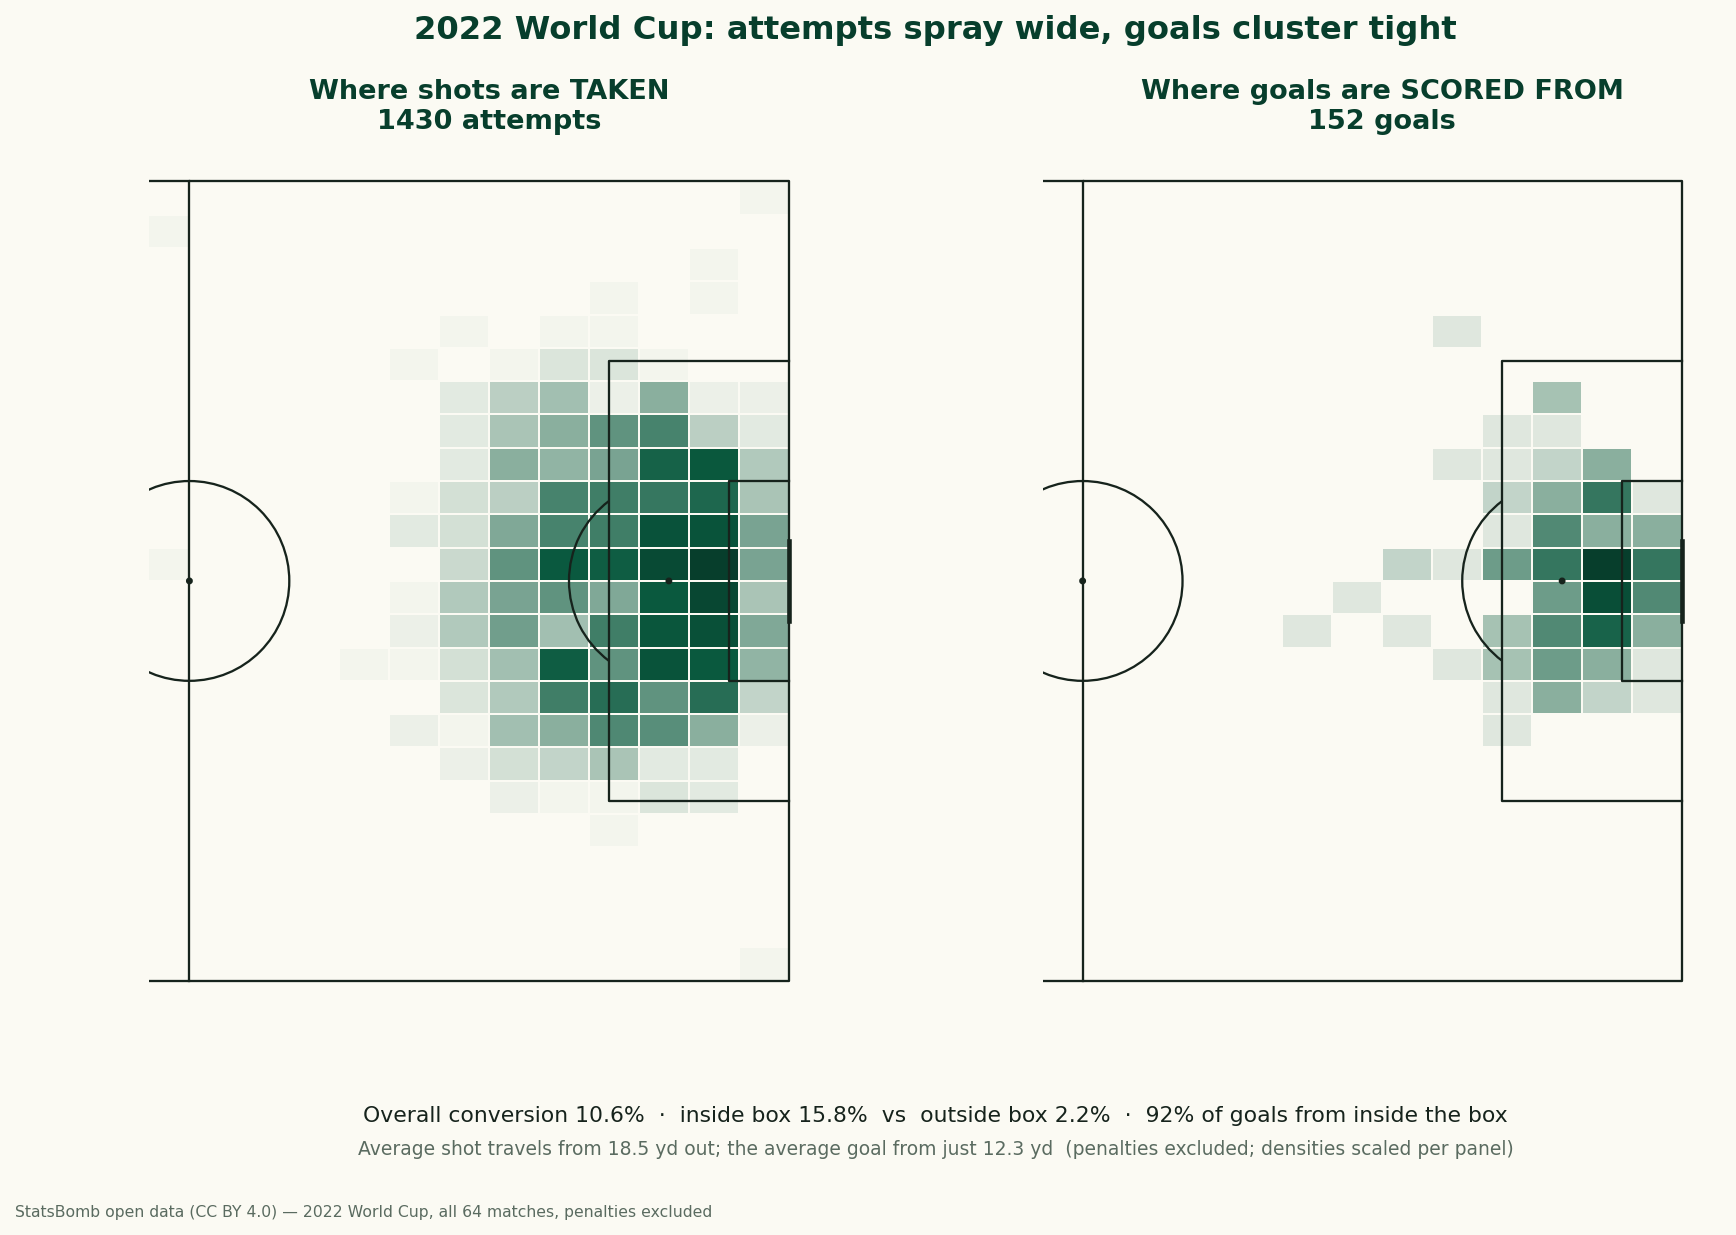
Using StatsBomb data for all 64 matches of the 2022 World Cup, headers and feet convert at almost the same rate (11.1% vs 10.5%) — but only because headers come from higher-quality positions. Relative to chance quality, foot finishing beat the model, and the left foot was the most clinical of all.

6 min read
Data Deep-Dives

Set Pieces, Open Play, and Counters: Where 2022 World Cup Goals Came From

Using StatsBomb's data for all 64 matches of the 2022 World Cup, we trace every goal back to how the possession began. Set pieces (corners and free kicks) originated 30% of non-penalty goals; open play 46%; and counter-attacks, though rare, converted at 17.9% — nearly double the open-play rate. Where goals really come from.

5 min read
Data Deep-Dives

When World Cup Goals Are Scored: The Timing of 2022's 152 Goals

Using StatsBomb's data for all 64 matches of the 2022 World Cup, we map exactly when the goals went in. The second half produced 61% of them to the first half's 39%, the busiest phase is the run-up to halftime, and stoppage time is wildly productive for the minutes it gets. The clock is not neutral.

4 min read
Data Deep-Dives

Where World Cup Players Aim: The Goal-Mouth Map of 2022's Goals

Using StatsBomb's end-location data for every goal of the 2022 World Cup, we map exactly where inside the goal frame the ball crossed the line. Goals cluster in the corners — especially the bottom corners (the two deadliest zones at 12% and 14%) — while the middle of the goal, where keepers stand, is nearly empty. A keeper's-eye view of finishing.

4 min read
Data Deep-Dives

Who Beat Their xG at the 2022 World Cup — and Who Wasted It

Using StatsBomb's open-play shot data for all 64 matches of the 2022 World Cup, we compare every team's goals to its expected goals. The deep-run teams finished clinically — Netherlands +5.0, France +3.7 — while Belgium (one goal on 3.7 xG) and Brazil wasted theirs. Finishing skill, hot streak, or luck?

5 min read
Data Deep-Dives

Where World Cup Shots Are Taken vs. Where Goals Are Scored From

Using StatsBomb's free shot data for all 64 matches of the 2022 World Cup, we map where every shot was taken against where goals were actually scored from. Attempts spray across the final third; goals collapse into a tight central band. Outside the box you convert 2.2%; inside, 15.8%.

6 min read