Why League Projection Models Disagree: A Look Under the Hood
Same league, different forecasts - here is why.
Two reputable forecasting models publish their Premier League title odds on the same Monday morning. One puts the leader at 72%. The other puts them at 51%. Same league, same fixtures played, same table. How? The short answer is that a projection model is a long chain of modelling decisions, and every link introduces its own error bars. This is what lives inside those chains and why small disagreements compound into very different headlines.
The basic architecture: ratings, fixtures, simulations
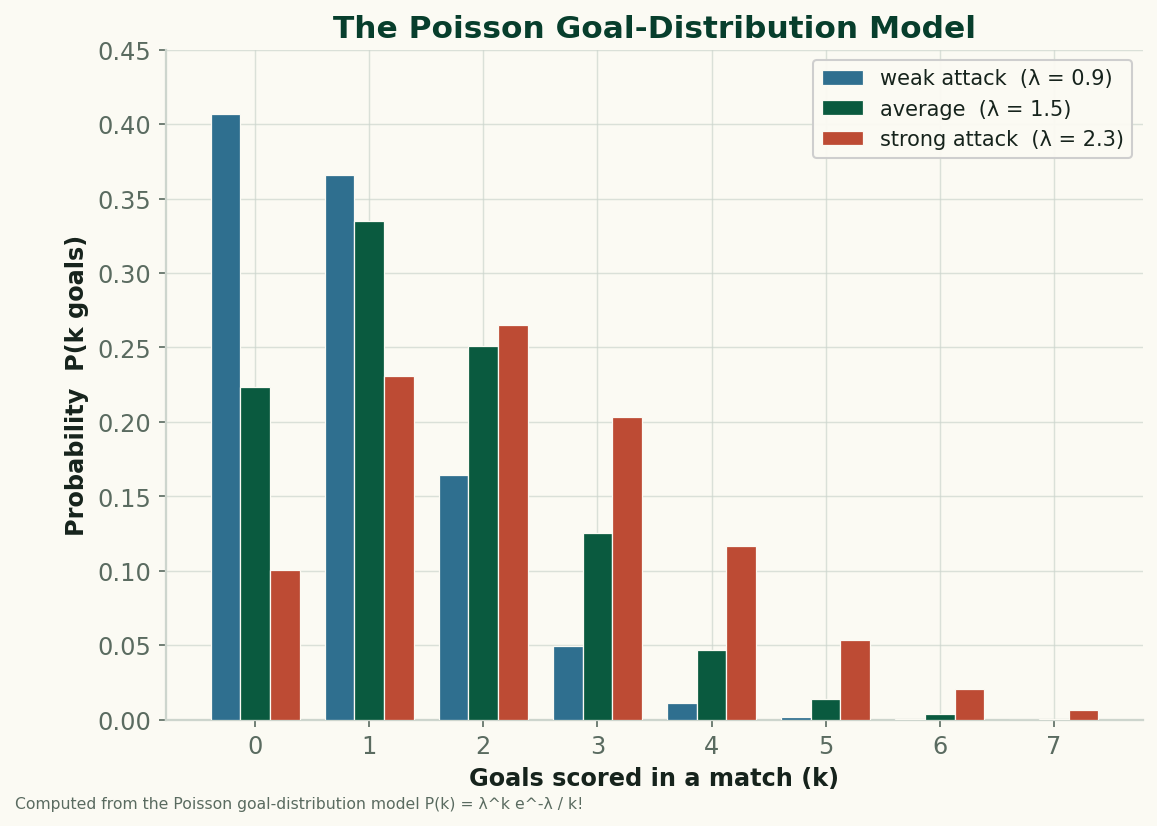
Almost every serious league projection follows the same three-step skeleton. First, it assigns each team a strength rating — a single number (or a pair: attack and defence) expressing how many goals they are expected to produce and concede. Second, it feeds those ratings into a match-level model: combine two teams' ratings, add a home-advantage adjustment, and you get a forecast for that fixture — typically a Poisson-distributed goal expectation for each side. Third, it simulates the remaining schedule. Each unplayed match is run thousands of times by sampling from those distributions, and the final table is recorded. Do that ten thousand times and you have a probability distribution over every possible finish: title probability, top-four probability, relegation probability.
That skeleton is largely agreed upon. What is not agreed upon is how to fill in the flesh — and those choices, quietly, are enormous.
Where the ratings come from
The most consequential decision a model makes is what evidence it uses to build team ratings. There are three broad philosophies, and they can produce meaningfully different numbers for the same team.
Results-based ratings (the Elo family) update a team's rating after every match based purely on the scoreline and the implied expectation. Beat a strong team and your rating rises; lose to a weak one and it falls. The appeal is simplicity and longevity — Elo-style systems work over any era and any data environment. The problem is that football scoreboards are noisy. A 1–0 win built on a penalty and a desperate goalline clearance counts the same as a 1–0 win built on nineteen shots and relentless possession. The model cannot tell them apart.
Expected-goals-based ratings use xG instead of actual goals: they ask not "did you score?" but "what quality of chances did you create and concede?" This strips out some of the luck in finishing and gives a cleaner read on the underlying team. The trade-off is model dependency — your rating is now downstream of your xG model, with its own assumptions about shot location, body part, and chance type. Two models using different xG sources for the same game will disagree on how strong each team is.
Market-based ratings take transfer market valuations (from databases such as Transfermarkt) as a proxy for squad quality. The appeal is that markets aggregate huge amounts of information — wages, agent negotiations, scouting networks — that a model built on shots never sees. The drawback is that valuations update slowly and encode backward-looking information; a team that has recently changed system or manager may be mispriced for months.
Many well-regarded models blend all three, weighting each source. The exact blend is a free parameter, and different teams optimise it differently.
Priors and preseason weighting
Before a ball is kicked in a new season, every team needs a starting rating. That prior is informed by the previous campaign, but how much should a twelve-month-old result affect today's forecast? This question of memory length is one of the most debated in projection methodology.
A model with a long memory treats promotion sides as roughly as bad as their third-tier record implies, and gives last season's champions significant credit even after a slow start to the new campaign. A model with a short memory updates aggressively: six strong weeks can drag a team's rating up quickly, and a bad winter can erase a title-winning reputation almost entirely.
Neither is obviously correct. Short memory is responsive; long memory is stable. The practical difference shows up most clearly mid-season: if a historically strong club is sitting eighth in November, a long-memory model may still see them as a title contender on the strength of three previous seasons, while a short-memory model has mostly moved on.
Preseason weightings also shape how signings and manager changes are treated. A model that incorporates market data can update a team's attacking rating the moment a striker is signed; a pure results-based model has to wait for evidence on the pitch. In the meantime, the two models will quote different title odds for the same club.
A worked example: how a 0.1-goal rating shift moves the needle
The relationship between a rating change and a title probability is non-linear and depends heavily on how competitive the league is, but the following illustration captures the qualitative shape.
Suppose a model rates the current leader at 1.65 expected goals per home game and 1.40 away, and their nearest rival at 1.55 and 1.30. The leader is favoured in most remaining fixtures, and across ten thousand simulations they win the title roughly six times in ten. Now suppose a second model rates the leader 0.1 goals per game lower — perhaps it is more sceptical about their underlying xG, or gives less weight to their August form. The leader is now 1.55 and 1.30: similar to the chasing pack. That gap closes their simulated title share considerably.
The intuition is that title races are decided in the close matches — the direct six-pointers, the away days at the top six. In those games, a 0.1-goal edge is a difference between being a modest favourite and being roughly evenly matched. Compounded across a season of such matches, the probability shifts are disproportionate to the rating change. This is why small methodological choices produce headline differences.
Home advantage: a number nobody agrees on
Every model adds a home-advantage term to its match predictions. Historically, playing at home in top European leagues has been worth roughly 0.35 to 0.45 additional expected goals per game — enough to shift a coin-flip fixture into a meaningful favourite-underdog structure. But that number is not fixed.
Home advantage contracted measurably during the Covid-19 period when matches were played behind closed doors, and some researchers argue it has not fully returned to pre-pandemic levels in all leagues. Whether a model uses a long-run historical average, a rolling recent estimate, or allows each club its own home-advantage value (stadiums and atmospheres vary) will shift projections, particularly for clubs whose home records diverge from the league norm.
A model that assigns a static league-wide home-advantage figure to a club with an unusually noisy home record will systematically misprice their home fixtures — and because home fixtures are roughly half the remaining schedule, that error compounds quickly.
Regression to the mean: how hard, how fast
No model takes current-season data at face value without pulling it toward a prior. A team that has won seven straight is probably good — but some fraction of that run is variance, and a model needs to decide how much of the table represents signal versus noise.
Aggressive regression treats a side on a hot streak as less dominant than the table implies; conservative regression credits the results more fully. The right answer depends on sample size: eight games into a season, regression is clearly appropriate. Forty games in, the evidence is more reliable and should be trusted further. Most models reduce the weight on preseason priors as matches accumulate, but the schedule for that reduction is itself a free parameter.
Why this matters beyond academic interest
If you follow multiple projection systems — and I would argue you should — treat the disagreements as a diagnostic tool, not a source of confusion. When two models converge on a title probability, that is relative confidence; when they diverge by twenty percentage points, one of them has made a different assumption about something meaningful. The question to ask is which assumption seems more defensible, not which number is higher.
The models worth paying attention to are the ones that publish their methodology: what ratings system, what home-advantage estimate, what regression schedule, what prior. A black-box projection that refuses to explain itself is not mysterious — it is just difficult to stress-test. Methodological transparency is the quality signal, not raw accuracy on a single season, which is dominated by luck anyway.
The disagreements between models are not a flaw — they are an accurate reflection of how much genuine uncertainty remains in a game where the best team loses roughly a third of its matches. Own the range; resist the false precision of a single number.
Sources & further reading
- Free textbook: Chapter 20: Predictive Modeling — the theory behind this, at DataField.dev.
- FiveThirtyEight — pioneered publicly documented club soccer projections with a published methodology; archive is a useful reference for how such systems evolved.
- FBref — xG and advanced team-level statistics across European leagues, via Opta; the raw material for xG-based ratings.
- Understat — season-long xG and xGA tables for the major European leagues.
- Transfermarkt — squad market valuations used by market-based rating systems.
- StatsBomb — detailed xG and event data; their written research covers model calibration and what event data adds over results alone.