Soccer Power Ratings: Elo, SPI, and Why They Disagree
One number per team, several systems, and built-in disagreement.
Can you really squeeze a football team — eleven players, a manager, a style, a collective mood that swings week to week — into a single number and learn anything true from it? Power ratings answer yes, and the strange thing is that they are mostly right: feed two of those numbers into a formula and you get a defensible read on who would probably win. The stranger thing, and the one this piece is really about, is that the major systems take the same matches and deliberately hand you different numbers. They are not making mistakes. They are making different bets, and once you see which bets they are placing, you can use any of them well.
How Elo works
Elo is the foundation, and it was borrowed wholesale from chess, of all places. Every team carries a rating, and the system is zero-sum: after each match, points are transferred from one side to the other. Beat a team and you take rating points from them; lose and you hand points over. Crucially, the size of the transfer depends on the surprise. Before the match, the rating gap implies an expected result — the favourite is “supposed” to win. Perform exactly as expected and ratings barely move. Pull off an upset and a large chunk of points changes hands, because the system has learned something new.
How fast it learns is set by the K-factor, a single knob governing how much any one result moves the needle. A high K makes the rating twitchy and quick to react to recent form; a low K makes it sluggish and stable, trusting the long-run history over the latest ninety minutes. Every Elo implementation has to pick a point on that responsiveness-versus-stability spectrum, and that choice alone makes two Elo systems disagree.
Football-specific Elo systems then add two adjustments the chess version never needed. The first is margin of victory: winning 4–0 is stronger evidence than scraping a 1–0, so most football Elos scale the points transfer by the goal margin rather than treating every win identically. The second is home advantage: because playing at home is worth a real and measurable edge, the expected result is computed with a bonus added to the home side before the match, so beating a strong team away earns more than the same result at home. The best-known public implementations — clubelo.com for clubs and the World Football Elo project for international sides — differ precisely in how they set K, how they weight the margin, and how big a home bump they apply. For why that home edge exists and roughly how large it is, see home advantage quantified.
Try it: turn a rating gap into a win expectancy
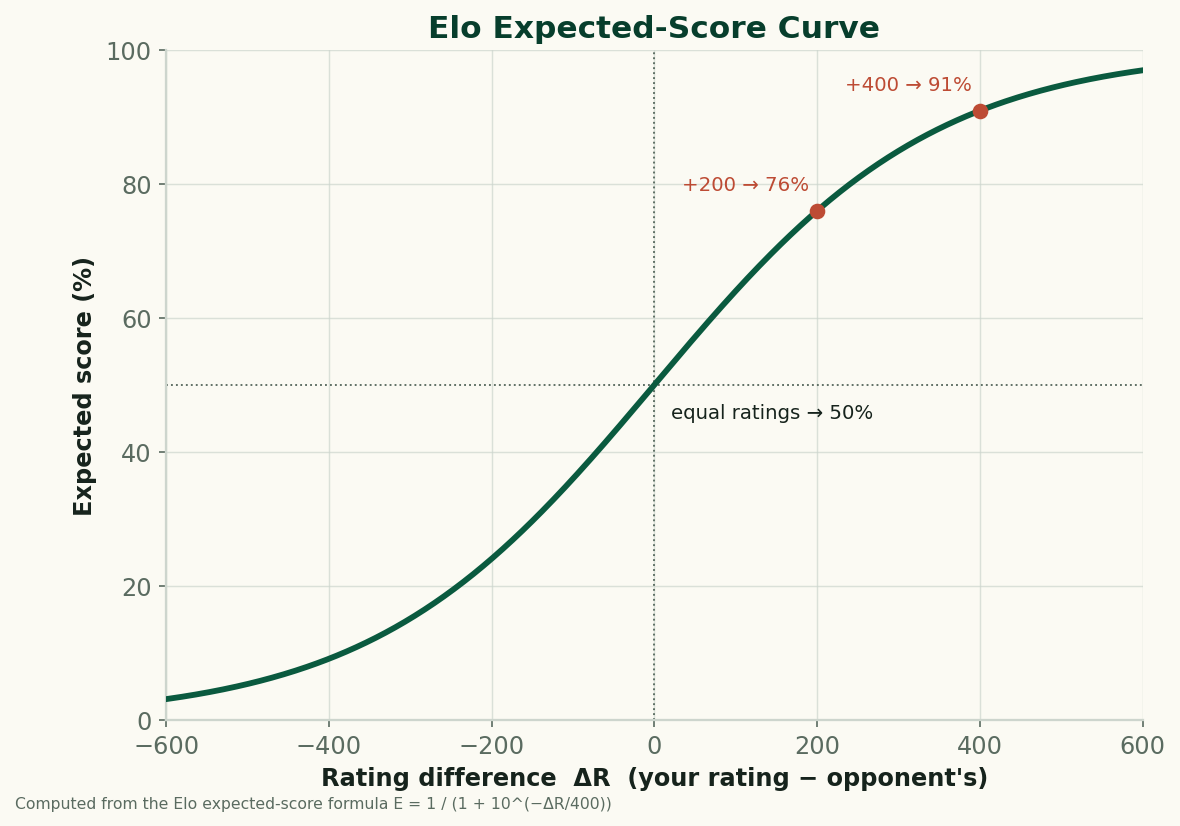
Put in two ratings and read the expected score straight off the curve. A 200-point edge (say 1700 vs 1500) comes out around 76%; a 400-point gap is roughly 91%; equal ratings sit at 50%.
This calculator needs JavaScript. The formula is E = 1 / (1 + 10^(−ΔR/400)), where ΔR is your team's rating minus the opponent's.
Open this calculator on the tools page →
The Soccer Power Index idea
The Soccer Power Index, or SPI, took a different angle on the same problem. Where classic Elo carries one rating per team, SPI’s central idea was to split a team into two numbers: an offensive rating — how many goals it would be expected to score against an average opponent — and a defensive rating — how many it would be expected to concede. A team’s overall strength is then derived from how those two ratings would play out against another team’s.
That separation buys real expressiveness. A devastating attack with a leaky defence and a dour side that wins 1–0 can land at a similar overall level by very different routes, and the two-number representation captures that where a single Elo figure cannot. SPI was also designed to lean on goals and chance-quality information rather than results alone, the better to estimate true strength from a limited number of matches.
One important note of historical framing: SPI was published by FiveThirtyEight, and FiveThirtyEight wound down in 2023, so its public SPI ratings and forecasts are best treated as a landmark in the history of public soccer modelling rather than a live feed you can pull today. The idea — separate offence and defence, blend goals and chance quality — remains influential and is echoed in plenty of systems still running. Treat SPI here as a design philosophy, not a current product.
Other approaches
Between pure Elo and the SPI philosophy sits a broad family of hybrid systems, and they are where most of the action is now. The defining move of the modern approach is to stop trusting results alone and feed the rating expected goals as well. The reasoning is the one that runs through this whole site: a single scoreline is a noisy, low-sample reading of how a match actually went, and a team that loses 1–0 having created the better chances has given you evidence its result hides. An xG-aware rating updates on the underlying performance, not just the final number on the board.
Providers such as Opta and others build ratings in exactly this spirit — results-plus-xG hybrids that blend who won with how comprehensively they out-created the opponent, often layering in possession-value or shot-quality signals on top. The common thread across the whole landscape is a sliding scale from results-only at one end (pure Elo: all that matters is the scoreline) to performance-aware at the other (ratings driven substantially by xG and chance quality). Where a system sits on that scale is the single biggest reason it will disagree with its neighbours, which is the subject of the next section.
Why they disagree — on purpose
Two well-built rating systems can look at an identical set of matches and rank the same teams differently, and this is a feature of their design choices rather than a bug in any of them. The disagreements cluster around a handful of decisions.
- Results-only vs. xG-aware inputs. A results-only system rewards a team for grinding out 1–0 wins; an xG-aware system may rate that same team lower if the underlying chances were poor. Same matches, different verdict.
- How they treat margin of victory. Systems that scale heavily by goal margin will rank a team that wins big above one that wins narrowly; systems that cap or ignore margin will not.
- Responsiveness (the K-factor and its analogues). A twitchy system reacts to a hot streak; a stable one trusts the body of work. They will disagree most about teams whose form has recently changed.
- Preseason priors. Where a team’s rating starts each season — carried over from last year, regressed toward the mean, or adjusted for transfers — tilts its number for weeks until results outweigh the prior.
- Transferring strength across leagues. Calibrating how a mid-table side in one division compares to a strong side in another is genuinely hard, and systems make different assumptions, so cross-league comparisons are where they diverge most.
I want to be clear that none of these choices is “wrong.” They are different bets about what best predicts the future: recent form or long-run quality, the scoreline or the performance beneath it. That is exactly the dynamic explored in why league projection models disagree — the disagreement between ratings is the disagreement between modelling philosophies, made numeric. When two reputable systems part ways on a team, the honest read is not “one is broken” but “they are weighting recent form, margin, and chance quality differently, and the truth is probably between them.”
Reading a rating gap as a win probability
A rating is only useful if you can turn the gap between two teams into something actionable, and the whole apparatus is built to let you. The core property of an Elo-style system is that the difference between two ratings maps to an expected result — the bigger your edge in rating points, the higher your win probability, along a fixed curve the system defines. A modest gap means a slight favourite and a likely close game; a large gap means a heavy favourite and a result that would barely move the ratings if it goes to form.
Two cautions make that mapping trustworthy. First, fold in the venue: because home advantage is real, the same rating gap implies a higher win probability for the home side than the away side, which is why every serious system applies a home adjustment before reading off the odds. Second, remember that football has draws and is low-scoring, so even a large rating edge translates into a meaningfully less-than-certain win probability — the favourite is favoured, not guaranteed, and a single match is a small sample. For how those match-level probabilities are constructed and how they shift as a game unfolds, see how win probability models work. Used with that humility, a power rating is what it always promised to be: not the last word on a team, but a fast, honest, single-number prior to argue with.
Sources & further reading
- Free textbook: Chapter 20: Predictive Modeling — the theory behind this, at DataField.dev.
- ClubElo — a long-running public Elo rating system for club football, with its methodology documented.
- FBref — results and xG data (via Opta) that feed performance-aware rating systems.
- Understat — season-level xG tables useful for building or sanity-checking xG-aware ratings.
- StatsBomb — research on possession value and chance quality, the inputs behind modern hybrid ratings.