How Pep, Klopp, and the Data Era Rewired Tactics: A Statistical History
Positional play, the press, and the numbers that chased them.
Two coaching philosophies, one from Catalonia and one from the Ruhr Valley, between them made the football of the 1990s look like a museum exhibit. But the tactical revolution they drove did not happen in isolation: a parallel data revolution gave clubs the instruments to measure what was changing, decide what to copy, and pay for it. The metrics we now reach for instinctively — xG, PPDA, progressive passes, high turnovers — were invented to track the exact shifts those two men forced. Here is the history of the transformation, and of the numbers born from it.
The world before positional play: parking in straight lines
For most of football's professional history, shape meant a formation number, and formation meant fixed positions on a vertical ladder. The 4-4-2 that dominated English football through the 1980s and into the 2000s was organised around defensive solidity and a clear division of labour: two banks of four, two forwards, a shape that stayed largely intact whether the team had the ball or not. Possession was a means to an end — something you held briefly before delivering it forward.
What Arrigo Sacchi's AC Milan began to break in the late 1980s — a pressing, high-line 4-4-2 built around collective structure rather than individual genius — anticipated a lot of what followed, though the analytical language to describe what made it unusual barely existed at the time.
Guardiola and the space-control revolution
Pep Guardiola did not invent positional play, or juego de posición. The concept has its deepest roots in Johan Cruyff's vision of space as football's real commodity, and Guardiola absorbed that at Barcelona as a player under Cruyff. What he did from 2008 onwards was operationalise the idea at a level of tactical clarity it had never before reached.
The principle is geometric: position your players to outnumber opponents in the relevant zone, and you control transitions, reduce defensive exposure, and use the ball as a tool to disorientate rather than merely deliver. Guardiola's Barcelona kept the ball not just because they were comfortable on it — they were — but because holding it in specific spaces denied the opponent any opportunity to attack.
The coaching concepts that made this legible — the five-second press after losing possession, positional rotations designed to maintain numerical superiority in every zone — were new ways of thinking about an old game. The question was how to measure them.
Klopp, the press, and the controlled chaos model
Jürgen Klopp arrived at Borussia Dortmund in 2008 — the same year Guardiola took Barcelona — carrying a different solution to the same underlying problem of how to beat technically superior opponents. Where Guardiola believed in controlled ball possession as a defensive weapon, Klopp believed that moments of transition, the chaotic seconds immediately after a team loses the ball, were the most dangerous and most exploitable in the game.
Gegenpressing — counter-pressing — described pressing immediately and intensely after losing the ball, hunting to win it back before the opposition could organise. The logic was simple: immediately after a turnover, defending players are often ball-watching, not in shape. Win it back in those seconds and you launch attacks against a disorganised defence.
Dortmund's 2011 and 2012 Bundesliga titles demonstrated that the model worked at the highest level. Klopp then took the same principles to Liverpool, where the 2018-19 Champions League and the 2019-20 Premier League title validated what had looked like a system built more on intensity than craft.
What made the Klopp model analytically interesting was the way it collapsed the defensive and offensive phases into a single mechanism. Traditional football thinking separated them. Gegenpressing made the press itself an attacking weapon, and the data industry eventually built a metric to capture it.
PPDA: the number that learned to see the press
PPDA — passes allowed per defensive action — is the simplest metric the analytics world devised to measure pressing intensity. It asks: how many passes does the opposition complete in their own defensive third before your team makes a defensive action (tackle, interception, foul)? A low PPDA means you press aggressively. A high one means you sit off.
The metric was popularised by Colin Trainor at StatsBomb in the mid-2010s. Its appeal was immediate: calculable from standard event data, correlated with observable pressing behaviour, and comparable across squads, leagues and seasons. Clubs running Klopp-style systems could now show in a single number what their scouts had been explaining in words.
PPDA does not capture everything about a press — its location, whether the traps are well-designed, whether the ball-winners are good enough — but as a gateway metric it was the right tool for the moment. See the stat explainers section for a deeper look at pressing metrics.
xG and the recruitment feedback loop
Expected goals arrived in the public analytics conversation in the early 2010s, circulating on analytics blogs before reaching club recruitment departments. The timing was not coincidental. Both Guardiola's and Klopp's systems were, in different ways, about manufacturing high-quality chances from specific areas of the pitch. A metric that valued every shot — evaluating chance quality independently of whether those chances were converted — was exactly what clubs needed to assess whether a positional or pressing system was working.
What the widespread adoption of xG did to recruitment was specific: clubs could identify forwards generating better chances than their goal tallies suggested, and defenders whose teams conceded fewer high-xG shots rather than merely fewer goals. It gave analysts a lever against the conventional scouting report built on goals and assists, both of which variance and team context distort considerably.
Liverpool's transfer business under Michael Edwards and Ian Graham became a reference point for data-informed recruitment. The logic was not that algorithms picked the players — Klopp clearly played a central role — but that the analytical framework made it easier to identify undervalued players whose underlying numbers outran their results. Several clubs restructured their football operations departments in the same image.
Tracking data and the third wave
Event data — the sequence of on-ball actions — was the first wave. Derived metrics like xG and PPDA were the second. The third, which is still unfolding, is player tracking: the continuous location of every player and the ball, typically sampled multiple times per second.
Tracking data made a new class of question answerable. You could now measure off-ball positioning — where a winger runs when the centre-back has the ball, whether a striker stretches the defensive line, how far a full-back presses and how quickly they recover. The geometric intuitions underpinning positional play became, for the first time, directly measurable rather than inferred from outcomes.
The immediate effect was to reveal how much of what made elite teams different was invisible in event data. A defensive midfielder's PPDA contribution depended heavily on whether their positional structure was funnelling passes toward them. A striker's xG said nothing about whether they were creating the spaces their teammates exploited. Tracking data began to close those gaps.
The imitation game: when the revolution becomes the baseline
By the early 2020s, what Guardiola and Klopp had introduced as distinctive approaches had become the default expectation. High lines, high pressing, positional rotations and detailed in-possession structures were no longer a competitive edge; they were the baseline every serious challenger had to meet before the contest even began.
The analytics industry had kept pace. Progressive passes became a standard FBref column. Pressing intensity metrics appeared in broadcast graphics. Clubs that had been early xG adopters were by then looking for advantages in tracking-data models, set-piece analytics, and physical load management. The cutting edge had moved, as it always does, to whatever the market had not yet priced in.
The pattern is now clear enough to state as a rule: tactical innovation and data innovation have moved together, each making the other legible. Guardiola's teams created demand for positional metrics. Klopp's teams created demand for pressing metrics. Tracking data created demand for spatial and off-ball metrics. What the next cycle looks like depends on what the next coaching generation decides football is for. The analysts will build the numbers to follow.
Sources & further reading
- Free textbook: Chapter 22: Match Strategy and Tactics — the theory behind this, at DataField.dev.
- StatsBomb — original research on PPDA, pressing metrics, and event-data methodology.
- FBref — historical league and player data including progressive passes, pressures and advanced defensive statistics.
- Understat — season-level xG tables across the major European leagues going back to 2014-15.
- StatsBomb open data — free match event data including a broad range of competitions for analysts and researchers.
- mplsoccer — the Python visualisation library used to draw pitches, pass maps and pressing diagrams on this site.
More from Football History
Total Football, Quantified: What the Metrics Would Have Captured
Cruyff's Ajax and the 1974 Netherlands played a game decades ahead of the data. What Total Football was — and what modern metrics would have captured.
The 10 Most Statistically Improbable Seasons in Modern Football
Ten seasons that defied the numbers - from Leicester 5000-1 to unbeaten title runs - and what made each one a genuine statistical outlier rather than just a good story.
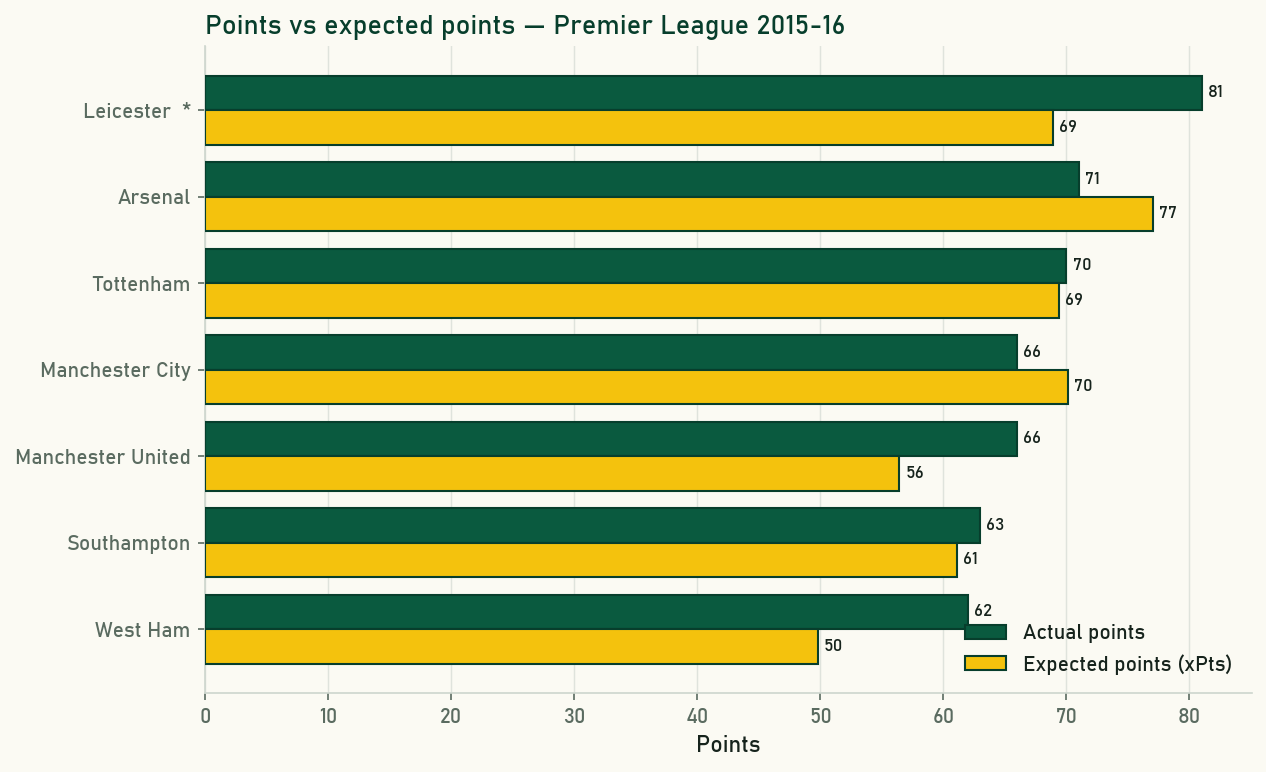
Leicester 2015-16 Revisited: What the Underlying Numbers Really Said
Leicester won the title at 5000-1 on 81 points - but their expected points ranked only fourth. Revisiting 2015-16 through xG shows a more complicated, and more interesting, story.