Total Football, Quantified: What the Metrics Would Have Captured
A system built decades before the data that could have measured it.
There were no tracking cameras over the Olympic Stadium in Amsterdam in 1972, and no event database recording where the ball went in the 1974 World Cup final. The football those Dutch teams played has come down to us through grainy footage and the memories of the people who watched it. Which leaves a tantalising question for anyone raised on modern numbers: if you could point today’s data at Total Football, what would it show? You cannot recover the statistics — they were never recorded. But you can say, with some confidence, what they would have looked like.
What Total Football actually was
Total Football was the system associated with the coach Rinus Michels and the player Johan Cruyff, developed at Ajax and carried into the Netherlands national team around the late 1960s and early 1970s. Its defining idea was positional interchange: rather than fixed roles on a fixed grid, any outfield player could take over the duties of a team-mate who had vacated a zone, with someone else immediately filling the space left behind. A full-back might surge into midfield, a midfielder drop into defence, a forward drift wide — and the structure held because the movement was collective rather than individual.
Three structural features made the system coherent, and all three are described consistently in the historical accounts:
- Positional interchange — players rotating through one another’s roles, so the team’s shape was fluid rather than fixed.
- A high defensive line with an aggressive offside trap — the back line pushed up the pitch and stepped forward in unison to leave attackers offside, compressing the space available to the opponent.
- Relentless pressing — when the ball was lost, the nearest players hunted it immediately rather than retreating, aiming to win it back high up the pitch.
Stated like that, the system sounds strikingly modern, which is rather the point. It is essentially the conceptual ancestor of the pressing, possession-and-territory football that dominates today — arrived at decades before anyone could measure it.
The history you can be sure of
Before reaching for what the data would have shown, it is worth being clear about what is solid historical record rather than inference. A few markers are well established and beyond dispute.
Ajax, with Cruyff at the centre of the side, won the European Cup — the competition that preceded the Champions League — three years in succession in the early 1970s. Cruyff himself was among the most decorated and celebrated players of the era, recognised repeatedly as the best in Europe. And the Netherlands, playing a version of the same football under Michels, reached the final of the 1974 World Cup, where they were beaten by the hosts, West Germany. Those are the load-bearing facts: a dominant club side, a transcendent central figure, and a national team that reached the sport’s biggest final playing in this style.
What the historical record does not give us is anything resembling modern data. There was no expected goals, no pass-completion logging, no field tilt, no record of where on the pitch defensive actions occurred. Everything that follows is therefore inference about what such metrics would have captured — reasoning from the well-documented description of how the teams played, not the recovery of numbers that exist somewhere. No figures are quoted here because none were recorded, and inventing them would betray the whole exercise.
What a line-height metric would have shown
The clearest inference concerns the defensive line. The system’s aggressive offside trap is among its best-documented features, and an offside trap is, by definition, a high line stepping forward in unison. Any modern measure of defensive line height — the average position of the back line, or the height at which defensive actions occur, as discussed in defensive line height and compactness — would almost certainly have placed these teams unusually high up the pitch for their era.
The qualifier “for their era” matters. The point is not that the line would read as high by the standards of a modern pressing side, but that against the deeper, more cautious defensive lines typical of 1970s football, the contrast would have been stark. The metric would have flagged exactly what contemporaries described in words: a team defending far from its own goal, deliberately surrendering the space behind in exchange for compressing the game into the opponent’s half.
What a pressing metric would have shown
The same reasoning applies to the press. The defining out-of-possession behaviour of Total Football was immediate counter-pressure — hunting the ball the instant it was lost rather than dropping into a block. That is precisely the behaviour PPDA, passes allowed per defensive action, was invented to capture: a team that challenges the ball after very few opposition passes would post a low PPDA, the signature of an intense, high press.
It is fair to infer, qualitatively, that these teams would have read as aggressive pressers on such a metric, again especially relative to the more passive norms around them. What cannot be claimed is any specific value — PPDA depends on event logging that simply did not exist, and the modern definition, restricted to the opponent’s build-up zone, was never designed with this football in mind. The honest statement is directional, not numerical: the press would have shown up as intense, but how intense is unknowable.
Territory, and the average-position map
A high line and a relentless press both point in the same direction territorially. A team that defends high and wins the ball back quickly tends to keep play in the opponent’s half, which is what field tilt — a side’s share of final-third activity — is built to measure. It is reasonable to infer that these teams would have dominated territory by that definition, pinning opponents back and playing most of the game in the attacking half.
The most evocative modern artefact, though, would have been the average-position map. Plot each player’s mean location over a match and a rigid, role-bound side resolves into a tidy grid. A team built on constant positional interchange would resolve into something far blurrier: overlapping clusters, players whose average positions sit far from their notional roles, a shape that looks less like a formation and more like a swarm. That fluidity is the single hardest thing to convey in words and the thing a position map would have rendered instantly — though even here the inference has limits, since an average flattens exactly the dynamic rotation that made the system work. The map would hint at the fluidity; it could never fully show the movement that produced it.
The lineage to Barcelona — and to Pep
The reason this thought experiment is more than nostalgia is the through-line it traces. Cruyff retired as a player, became a coach, and in the early 1990s built a Barcelona side around the same principles — possession, positional structure, a high line, pressing — that became known as the club’s “Dream Team.” Those principles were absorbed into Barcelona’s identity and its academy, and they shaped the positional-play football that Pep Guardiola later took to its most refined form and exported across Europe, the lineage traced in how Pep, Klopp, and the data era rewired tactics.
That last article makes the irony explicit: the metrics we now reach for instinctively — xG, PPDA, progressive actions, territory — were largely invented to track the football this lineage produced. Total Football sits at the head of the line, a system whose ideas the modern game spent decades catching up to and whose effects the modern toolkit was, in a sense, built to measure. The data would not have explained those Dutch teams — the footage and the testimony do that well enough. But it would have confirmed, in the language we now use for everything, what the people who watched them already knew: they were playing the future, several decades early.
Sources & further reading
- Free textbook: Chapter 22: Match Strategy and Tactics — the theory behind this, at DataField.dev.
- StatsBomb — the modern event and tracking data, and the metrics, this article imagines applying to the past.
- StatsBomb open data — sample of the kind of location-level data that did not exist in the 1970s.
- FBref — historical results and squad records alongside modern advanced data (via Opta).
- Understat — an example of the season-long xG data the modern era takes for granted.
More from Football History
The 10 Most Statistically Improbable Seasons in Modern Football
Ten seasons that defied the numbers - from Leicester 5000-1 to unbeaten title runs - and what made each one a genuine statistical outlier rather than just a good story.
How Pep, Klopp, and the Data Era Rewired Tactics: A Statistical History
How positional play, gegenpressing and the analytics revolution reshaped modern football tactics - and how the metrics we now take for granted both drove and tracked the change.
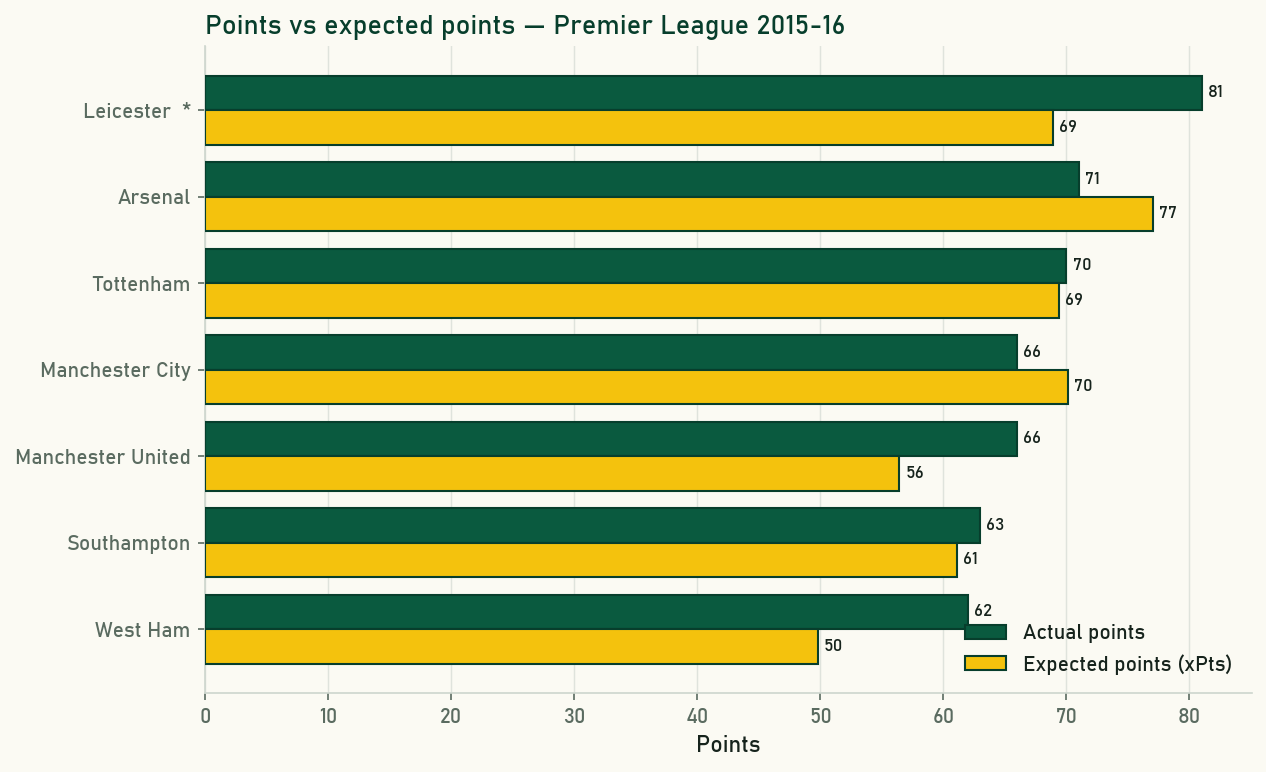
Leicester 2015-16 Revisited: What the Underlying Numbers Really Said
Leicester won the title at 5000-1 on 81 points - but their expected points ranked only fourth. Revisiting 2015-16 through xG shows a more complicated, and more interesting, story.