Leicester 2015-16 Revisited: What the Underlying Numbers Really Said
The fairytale, re-read through expected goals.
Leicester City won the Premier League. You know that. Everybody knows that. The 5000-1 shot, Claudio Ranieri, Jamie Vardy's scoring run, Riyad Mahrez gliding past full-backs, the fox in the box — it is the cleanest sporting narrative of the past two decades. What fewer people know is what the underlying numbers were quietly recording while all that was happening. They tell a story that is more complicated than the fairytale, and ultimately more interesting.
The historical record, plainly stated
Leicester finished the 2015-16 Premier League season with 81 points — twelve clear of Arsenal in second, thirteen ahead of Tottenham in third. They scored 68 goals and conceded only 36. Vardy ended the campaign as the league's joint top scorer with 24 goals. Mahrez won PFA Players' Player of the Year. N'Golo Kanté covered every blade of grass in England, apparently simultaneously. The team played with deliberately low possession and compact defensive lines, counter-attacking with a directness and pace that made Vardy the most effective striker in the country throughout the second half of the season.
Nothing in what follows is an attempt to argue that the title was unearned. The 81 points were real. The 68 goals were real. The trophy was real. But xG's question is not "did they win?" — it is "what would a typical team have accumulated from the same chances and defensive situations?" That question has a precise answer, and it changes the picture.
The expected-points gap
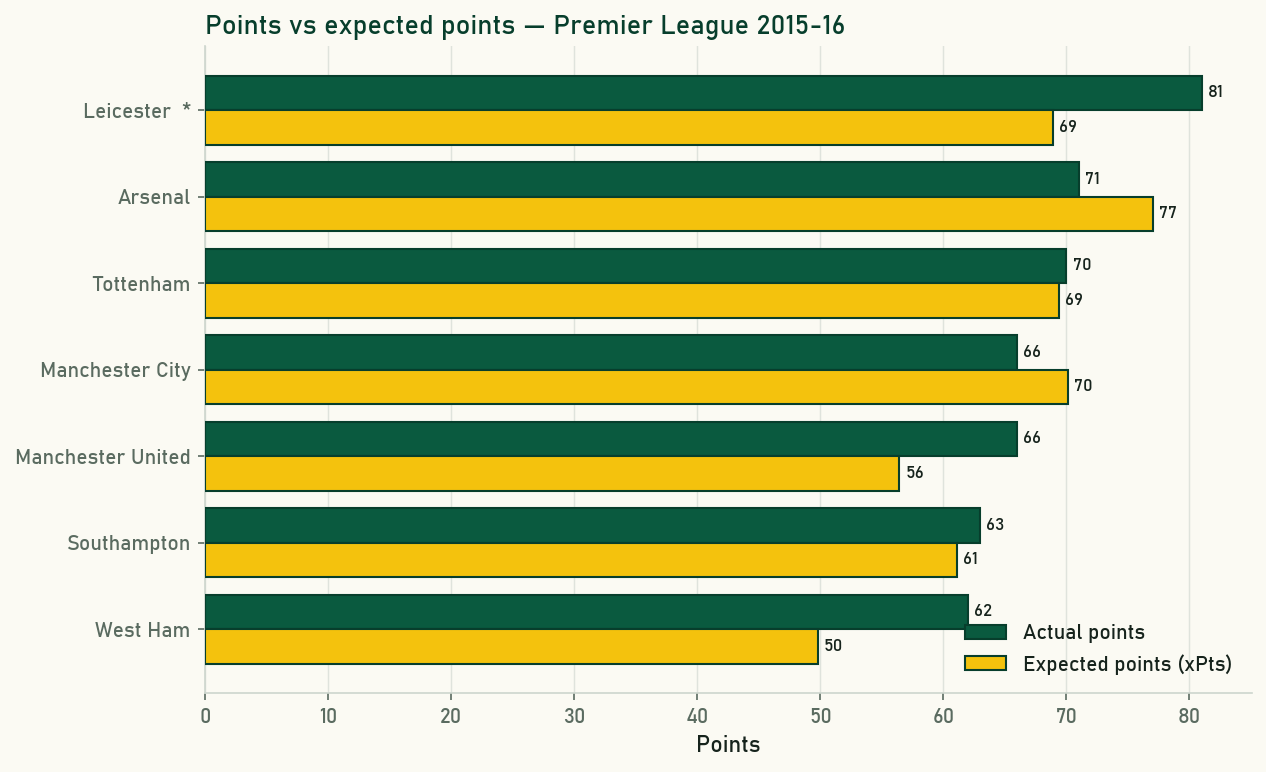
According to Understat's expected-points model for the 2015-16 Premier League, Leicester's underlying performance across the season was worth 68.9 xPts. They banked 81 actual points. That is a gap of 12.1 points — the largest positive overperformance among the top clubs that season.
Expected points works from shot quality upwards: given the chances created and conceded over 38 matches, how many points would an average team expect to accumulate? It smooths out the noise — the great save at a critical moment, the post that kept a scoreline level, the counter-attacking finish that a slightly less clinical forward converts once every three attempts rather than every time. Strip out that variance and Leicester ranked fourth, not first. Arsenal led the xPts table on 77.0; Manchester City were third on 70.1; Tottenham's 69.4 was fractionally ahead of Leicester's 68.9.
To put the overperformance in context: the next largest gap among the top eight was Manchester United, who beat their 56.4 xPts by 9.6 points on the way to 66. West Ham overperformed by 12.2 on the same 62 actual points but against an xPts of just 49.8. Neither was close to a title challenge. Leicester did it from fourth on xPts to first on the table, across a full season.
The full table, in numbers
The xGD column below — expected goal difference — is worth a careful look. It measures chance quality created and conceded, independent of conversion. It is the cleanest single indicator of whether a team was generating genuine attacking and defensive superiority across the season.
| Team | Pts | xPts | Pts − xPts | xGD |
|---|---|---|---|---|
| Leicester | 81 | 68.9 | +12.1 | 23.4 |
| Arsenal | 71 | 77.0 | −6.0 | 39.7 |
| Tottenham | 70 | 69.4 | −0.4 | 26.3 |
| Manchester City | 66 | 70.1 | −4.1 | 28.7 |
| Manchester United | 66 | 56.4 | +9.6 | 5.8 |
| Southampton | 63 | 61.1 | +1.9 | 11.9 |
| West Ham | 62 | 49.8 | +12.2 | −1.1 |
| Liverpool | 60 | 63.3 | −3.3 | 16.5 |
Arsenal's row is striking. An xGD of 39.7 — sixteen clear of Leicester — meant they had the best underlying attack-and-defence combination in the division. Their 71 actual points fell six short of what 77.0 xPts implied, largely because their conversion rate undershot. Finishing cost them the title, not chance creation. Tottenham and Manchester City both carried an xGD comfortably above Leicester's 23.4. By the measure the model uses — the quality of chances generated and prevented — Leicester were not the best team in England in 2015-16. They were fourth.
Where exactly the overperformance came from
Separating attack and defence makes the story sharper. On the attacking side, Leicester scored 68 goals against an xGF of 68.4 — almost exactly what the model expected. Vardy's finishing, Mahrez's creativity, and the counter-attacking system were generating and converting chances at almost precisely the rate the numbers predicted. No unexplained finishing windfall on that end.
The defence is where the gap opens up. Leicester conceded 36 goals against an xGA of 45.0. They kept out nine more goals than their own chance-concession profile said they should have allowed. Kasper Schmeichel had arguably the finest individual season of his career; Robert Huth and Wes Morgan were organised and aggressive; the back line defended their box with a discipline that made them difficult to score against even when opponents created reasonable chances.
Some of that nine-goal gap represents genuine defensive excellence — consistent organisation, a goalkeeper performing above his average, a defensive system that made shot-to-goal conversion harder than the xG coordinates suggested. But a nine-goal gap between goals conceded and xGA, sustained across 38 matches, is also exactly the kind of figure that almost never survives a second season. Variance played here. The only question is how much.
2016-17 and what the numbers predicted
The answer to that question arrived quickly. Leicester finished the 2016-17 season in twelfth place on 44 points. Ranieri was sacked in February 2017 with the club sitting one position above the relegation zone.
Regression to the mean is not a post-hoc rationalisation. It is a specific, forward-looking prediction that follows directly from a large positive gap between actual and expected performance: hold everything else equal, and the overperforming numbers will tend back toward the model. Leicester's 12.1-point surplus over xPts and their nine-goal defensive overperformance together formed exactly that profile. The xG ledger for 2015-16 was, in effect, a warning about 2016-17 — written before a ball of that season was kicked.
The departure of Kanté to Chelsea removed the defensive engine of the press. Vardy's goal rate fell back. The tactical novelty of the counter-attacking system — which opponents had not fully mapped in 2015-16 — dissipated as Premier League defences adapted. Some of the collapse was personnel and tactics. Some of it was the reversion that the numbers had already signalled.
What this does and does not say about the achievement
The analytical reading of Leicester 2015-16 risks being mistaken for mean-spiritedness: "the numbers say it was lucky, therefore it didn't really count." That misreads what xG actually tells you. Luck and skill are not opposites; every title in every season is some mixture of both. What the model does is disaggregate them.
The skill was real. An xGD of 23.4 is the mark of a team that genuinely created more than it conceded in terms of chance quality — better than Southampton, better than Liverpool, better than Manchester United on 5.8. The tactical discipline of Ranieri's system, the work rate of Kanté, the movement of Vardy, the invention of Mahrez — these were not illusions that xG exposed. What the numbers add is that these real skills were accompanied by variance falling consistently in Leicester's favour: opponents converting less often than expected, Schmeichel saving more than his expected goals allowed, the scoreboard repeatedly recording outcomes that sit at the fortunate end of the probability distribution.
That is not a diminishment. It is a description of how rare the achievement was. A genuinely good team and a genuinely fortunate season coincided for nine months. The 5000-1 price was about the probability of that combination occurring. The xG retrospective is about understanding, precisely, what the combination consisted of.
The fairytale survives the analytics. It just reads differently — less straightforwardly heroic, more specifically improbable, which is arguably more interesting.
Sources & further reading
- Free textbook: Chapter 15: Player Performance Metrics — the theory behind this, at DataField.dev.
- Understat — season-level xG and xPts data for the Premier League and other major European leagues, including the full 2015-16 table used throughout this article.
- FBref — advanced stats and historical league tables, with xG supplied via Opta.
- StatsBomb — methodology and context for how expected-goals and expected-points models are built and validated.