Home Advantage, Quantified: What a Decade of Data Says
How big the home edge really is, in the data.
The phrase "home advantage" is used so casually it has almost stopped meaning anything. Pundits invoke it as an afterthought; broadcasters mention it while filling airtime before kick-off. But it is a real, quantifiable effect — and when you actually run the numbers on a large sample of matches, you find that the size, the shape, and perhaps the trend of that edge are more interesting than the cliché suggests.
The numbers, straight
Across 3,425 domestic-league matches in the StatsBomb open-data corpus, the home side won 44.4% of the time. Draw rate was 22.2%. The away side won the remaining 33.4%. That is not a small gap: the home team wins about a third more often than the visitor. On a basic points-per-game basis, the home side earns 1.55 PPG — a comfortable mid-table return without ever leaving your own stadium.
Goals tell the same story more granularly. The home team scores 1.62 goals per match on average; the away team scores 1.31. That 0.31-goal differential per game compounds across a season into something structurally decisive — it is roughly the difference between a team with genuine title credentials and one fighting to avoid the drop.
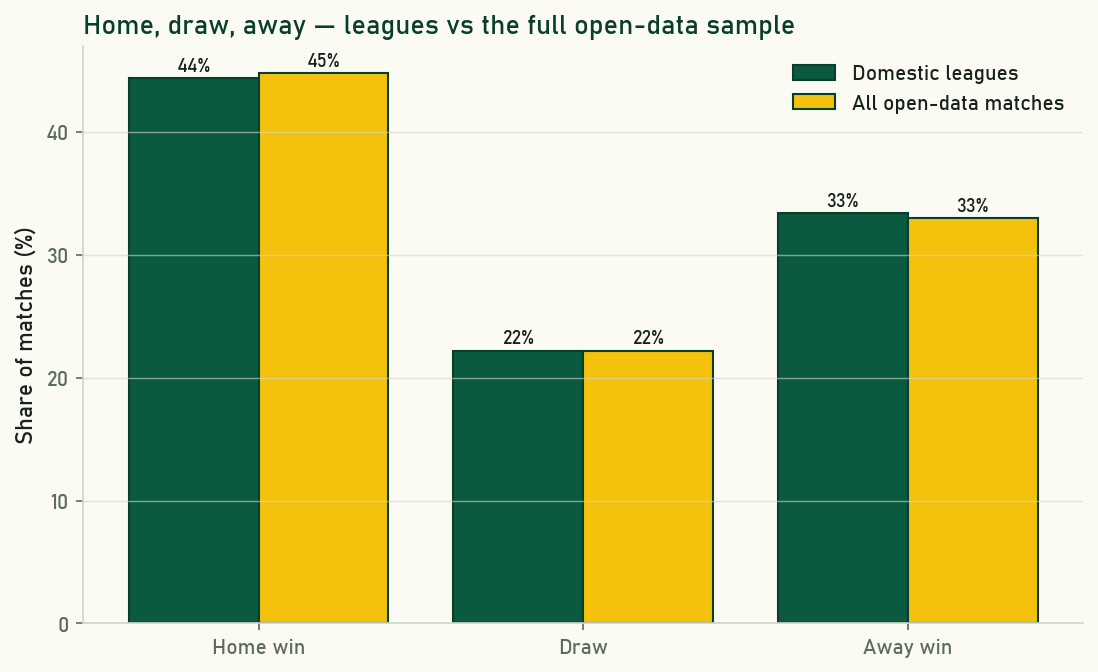
When neutral-venue tournament matches are folded into the sample — bringing the total to 3,961 matches across 24 competitions — the home-win figure edges up to 44.8%. That is worth pausing on: adding matches where one side is designated "home" at a neutral ground nudges the rate slightly upward rather than diluting it. It suggests the open-data sample's tournament designation leans toward seeded or historically dominant sides, and it is a good reminder that corpus composition matters. The domestic-league figure of 44.4% is the cleaner, more interpretable number.
| Sample | Matches | Home win % | Draw % | Away win % |
|---|---|---|---|---|
| Domestic leagues | 3,425 | 44.4 | 22.2 | 33.4 |
| All open-data matches | 3,961 | 44.8 | 22.2 | 33.0 |
Four explanations, not all equal
Home advantage is usually explained through four channels. They are not equally evidenced, and collapsing them into one vague "home advantage" effect obscures what is actually driving the numbers.
Travel and fatigue. Away teams travel. Longer trips mean disrupted sleep, tighter preparation windows, and legs that have done more work before the match begins. This effect exists and is directionally sensible — studies of European competition have repeatedly found that trans-continental travel correlates with worse performance. But within a single domestic league, the distances are often modest. Fatigue probably explains a slice of the gap, not the majority of it.
Familiarity with the environment. Home players know their pitch's bounce, the width of the tunnel, the dimensions of the dressing room, the slope they have been training on since pre-season. Away players adapt in warm-up. The effect is real but hard to isolate — it is confounded with everything else happening at the home ground simultaneously.
The crowd. The intuitive explanation, and the one everybody reaches for first. Seventy thousand people cheering every forward pass, whistling every visiting touch, generating the kind of ambient noise that makes communication near-impossible for the away team. The crowd clearly matters — but how much?
Referee bias. This is, to be blunt, the best-evidenced mechanism of the lot. A large body of research going back to the early 2000s has found that referees systematically award more stoppage time when the home team is losing, show more yellow cards to visitors than to hosts in equivalent challenges, and are more likely to award home-team penalties. The direction is consistent across decades and leagues. Nobody thinks referees are deliberately dishonest; the effect is almost certainly unconscious, driven by social pressure from the crowd. But the size of the effect — measurable and robust across thousands of matches — makes it hard to hand-wave away.
The COVID experiment
The most useful natural experiment in the history of home advantage research arrived, grimly, in March 2020. Football leagues across Europe played out their 2019–20 seasons and most of 2020–21 in empty stadiums. For the first time in the sport's history, you could watch a top-flight match with no crowd noise whatsoever, the players' calls to each other echoing off empty concrete.
The results were directionally clear across multiple analyses: home advantage shrank when the crowds disappeared. The effect did not vanish entirely — which is consistent with the travel, familiarity and referee-familiarity mechanisms still operating — but it fell. Without specifying a precise figure (the exact magnitude varied by league, study and sample), the research community found a meaningful reduction that pointed a firm finger at the crowd as a genuine contributor to the effect, not merely a colourful backdrop to it.
What the empty-stadium era could not do was cleanly separate the referee-bias channel from the direct crowd-noise channel on player performance. Referees, presumably, were also affected by the eerie quiet — they had fewer thousands of voices cueing their perceptions. Teasing those threads apart remains an open research question, but the direction of the evidence is not in doubt.
Is the edge shrinking?
Home advantage at the aggregate level has been declining over the long term in most of the major European leagues, at least as measured by pre-pandemic data. The reasons are debated: better sports science for away teams, tactical sophistication that reduces the importance of local familiarity, improved travel logistics, more professional preparation standards across the board. The professionalization of football has, slowly, levelled some of the playing field.
The pandemic dip complicated this trend-line considerably. Home advantage collapsed during the empty-stadium period, then appeared to rebound — and, according to some analyses, partially overshot — as fans returned. Disentangling "long-run structural decline" from "pandemic noise" requires very careful time-series work on data the open corpus does not currently cover in full. The honest reading of the evidence is: the trend is probably downward over decades, but the signal is noisy.
What this sample can and cannot tell you
The StatsBomb open-data corpus is a rich resource and a genuinely large sample — 3,961 matches across 24 competitions — but it carries structural quirks worth naming. It mixes eras: the competitions represented span multiple decades, with varying tactical norms, rules (the back-pass change in 1992, for instance, would alter how home teams conserve leads) and competitive environments. It over-represents showpiece competition: World Cups, Champions League matches, high-profile domestic seasons from the elite leagues. Smaller domestic pyramids, which might show different home-advantage patterns, are mostly absent.
What the corpus tells you confidently is the gross rate — 44.4% home wins in domestic leagues — and the goals differential. What it cannot tell you reliably is whether 2024 looks like 2004, or whether the Bundesliga looks like the Eredivisie. For those questions you would want a purpose-built longitudinal dataset with consistent competition coverage. The macro numbers here should be treated as a robust baseline, not as the final word on every league at every moment.
Still: 44.4% home wins from over three thousand league matches, 1.62 goals scored at home versus 1.31 away. The advantage is real, it is not going to disappear, and it is doing something more interesting than just "the crowd cheering". That seems like a reasonable place to start.
Sources & further reading
- Free textbook: Chapter 16: Team Performance Analysis — the theory behind this, at DataField.dev.
- StatsBomb open data — the match-level data underlying all figures in this article.
- StatsBomb — methodology documentation and research notes.
- FBref — season-by-season home/away splits for major European leagues.
- Understat — xG-adjusted home and away performance tables for the top five leagues.
More from Data Deep-Dives
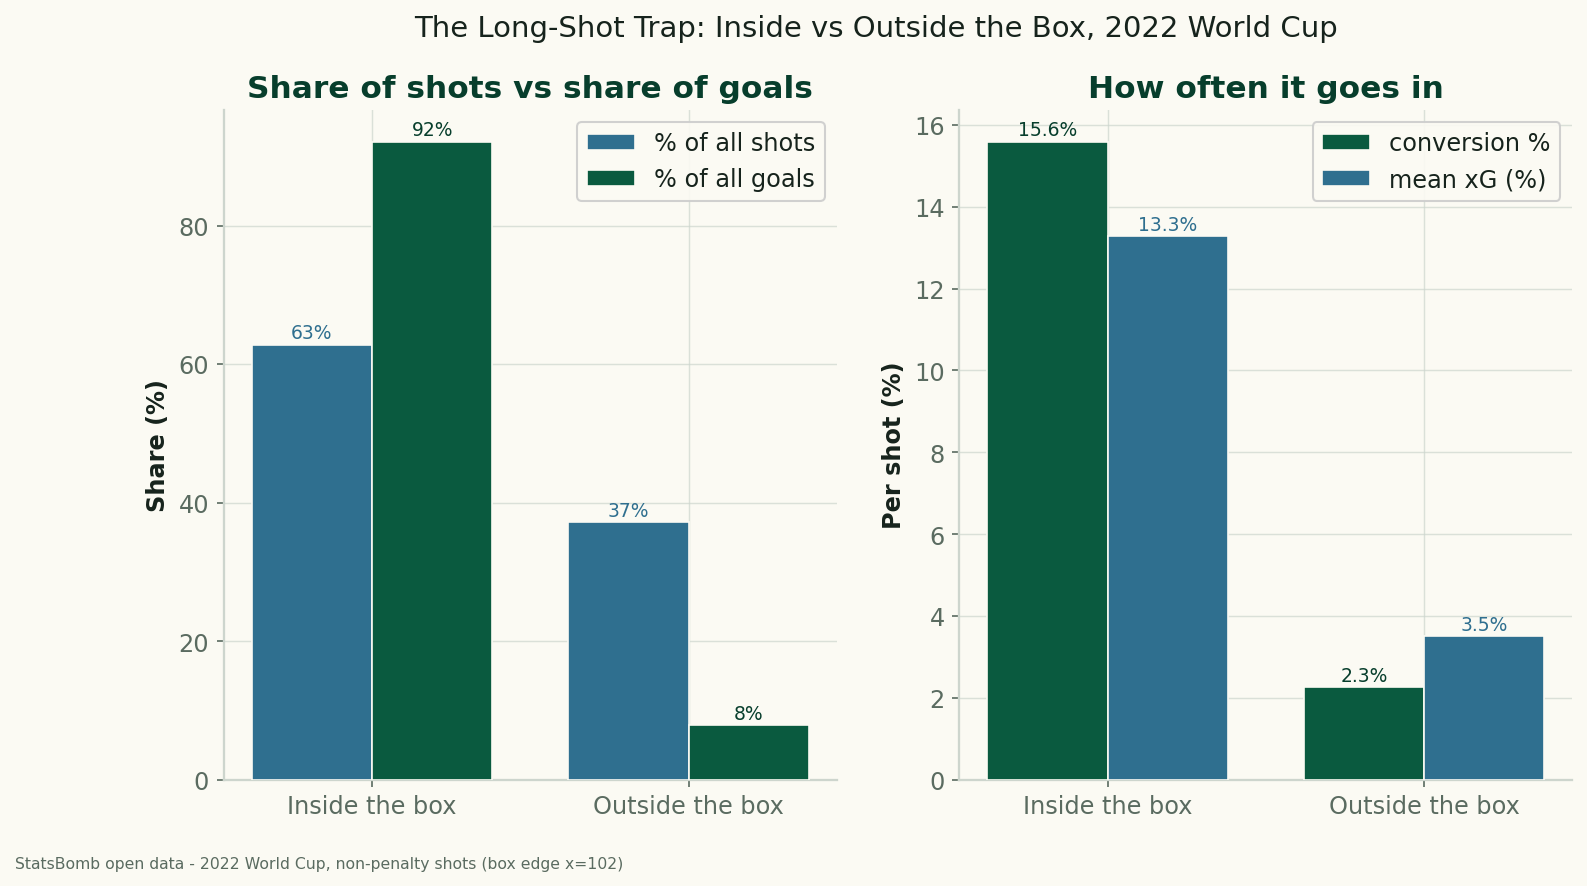
The Long-Shot Trap: Inside vs Outside the Box at the 2022 World Cup
Using StatsBomb data for all 64 matches of the 2022 World Cup, shots from outside the penalty box were 37% of all attempts but produced just 8% of the goals — a 2.3% conversion rate against 15.6% from inside. The data behind 'stop shooting from there.'
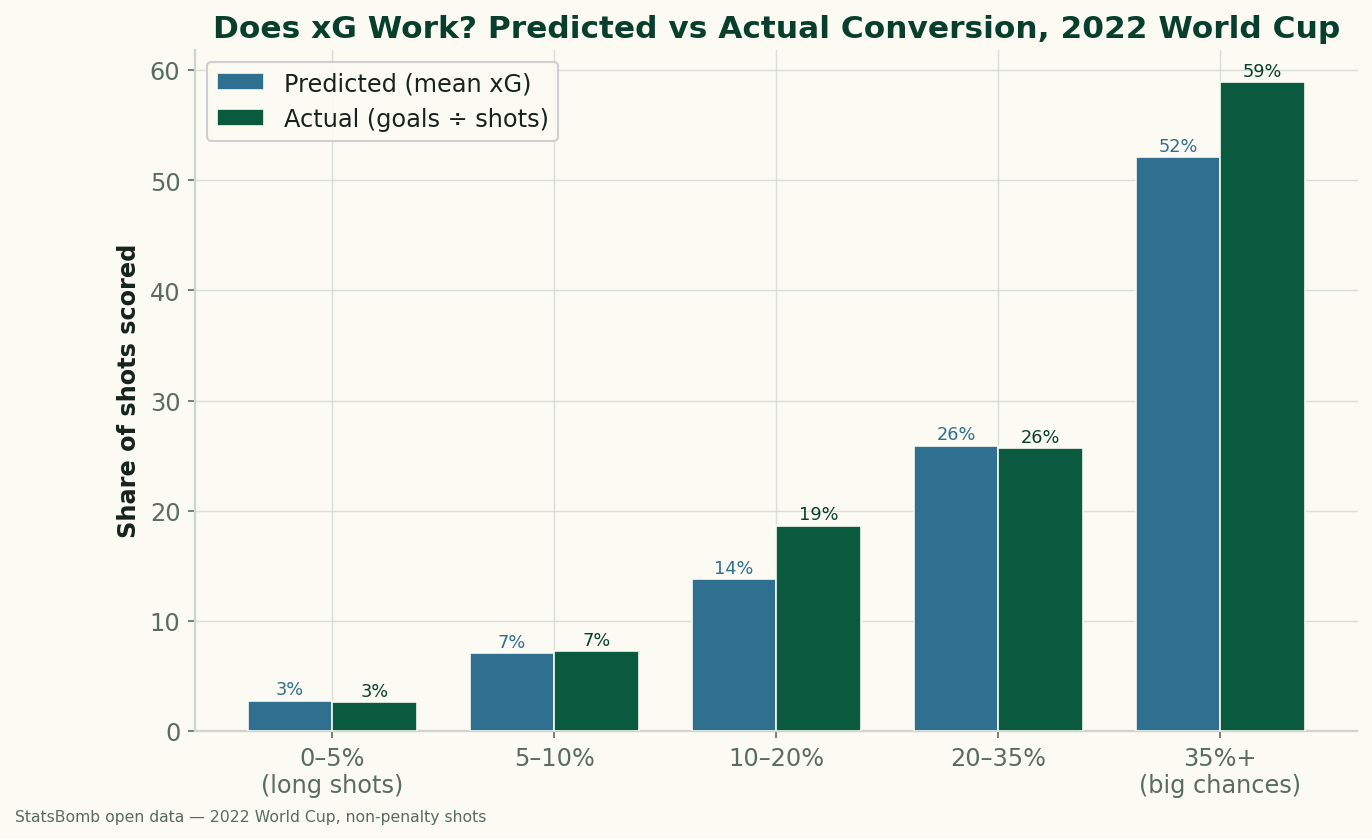
Does xG Actually Work? Big Chances vs Long Shots at the 2022 World Cup
We sorted every non-penalty shot from the 2022 World Cup by its expected-goals value and checked how often each band actually went in. xG holds up well: a 0–5% shot scored 2.6% of the time, a 'big chance' of 35%+ went in 58.9%. The calibration, and what a big chance is really worth.
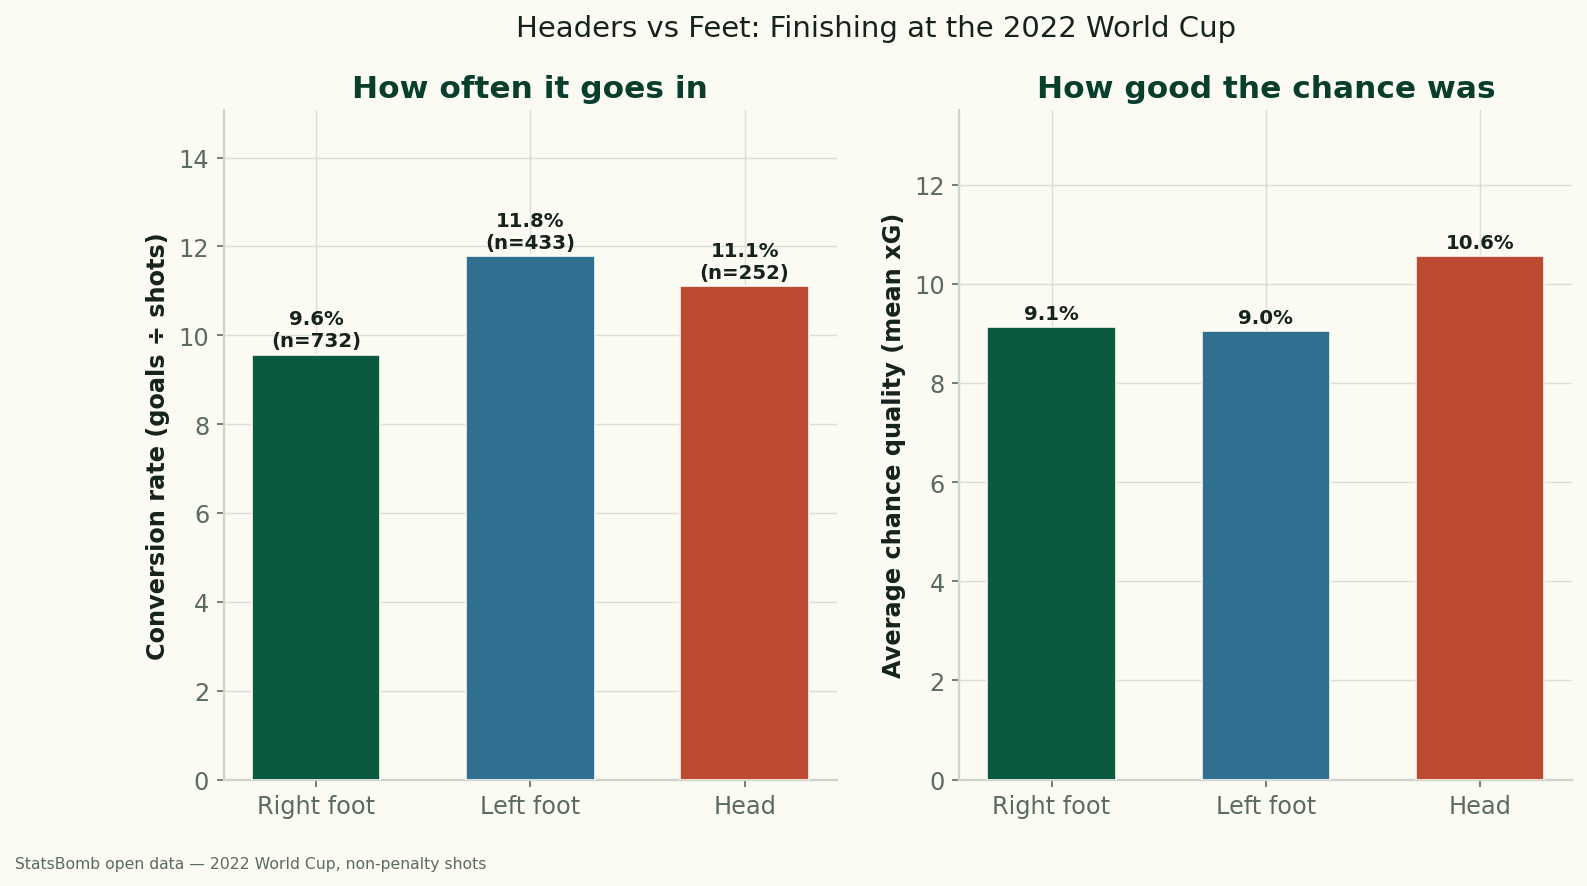
Headers vs. Feet: Which World Cup Shots Actually Go In?
Using StatsBomb data for all 64 matches of the 2022 World Cup, headers and feet convert at almost the same rate (11.1% vs 10.5%) — but only because headers come from higher-quality positions. Relative to chance quality, foot finishing beat the model, and the left foot was the most clinical of all.