Four Points From Six Games Usually Sinks a Promoted Club. Not the Rest
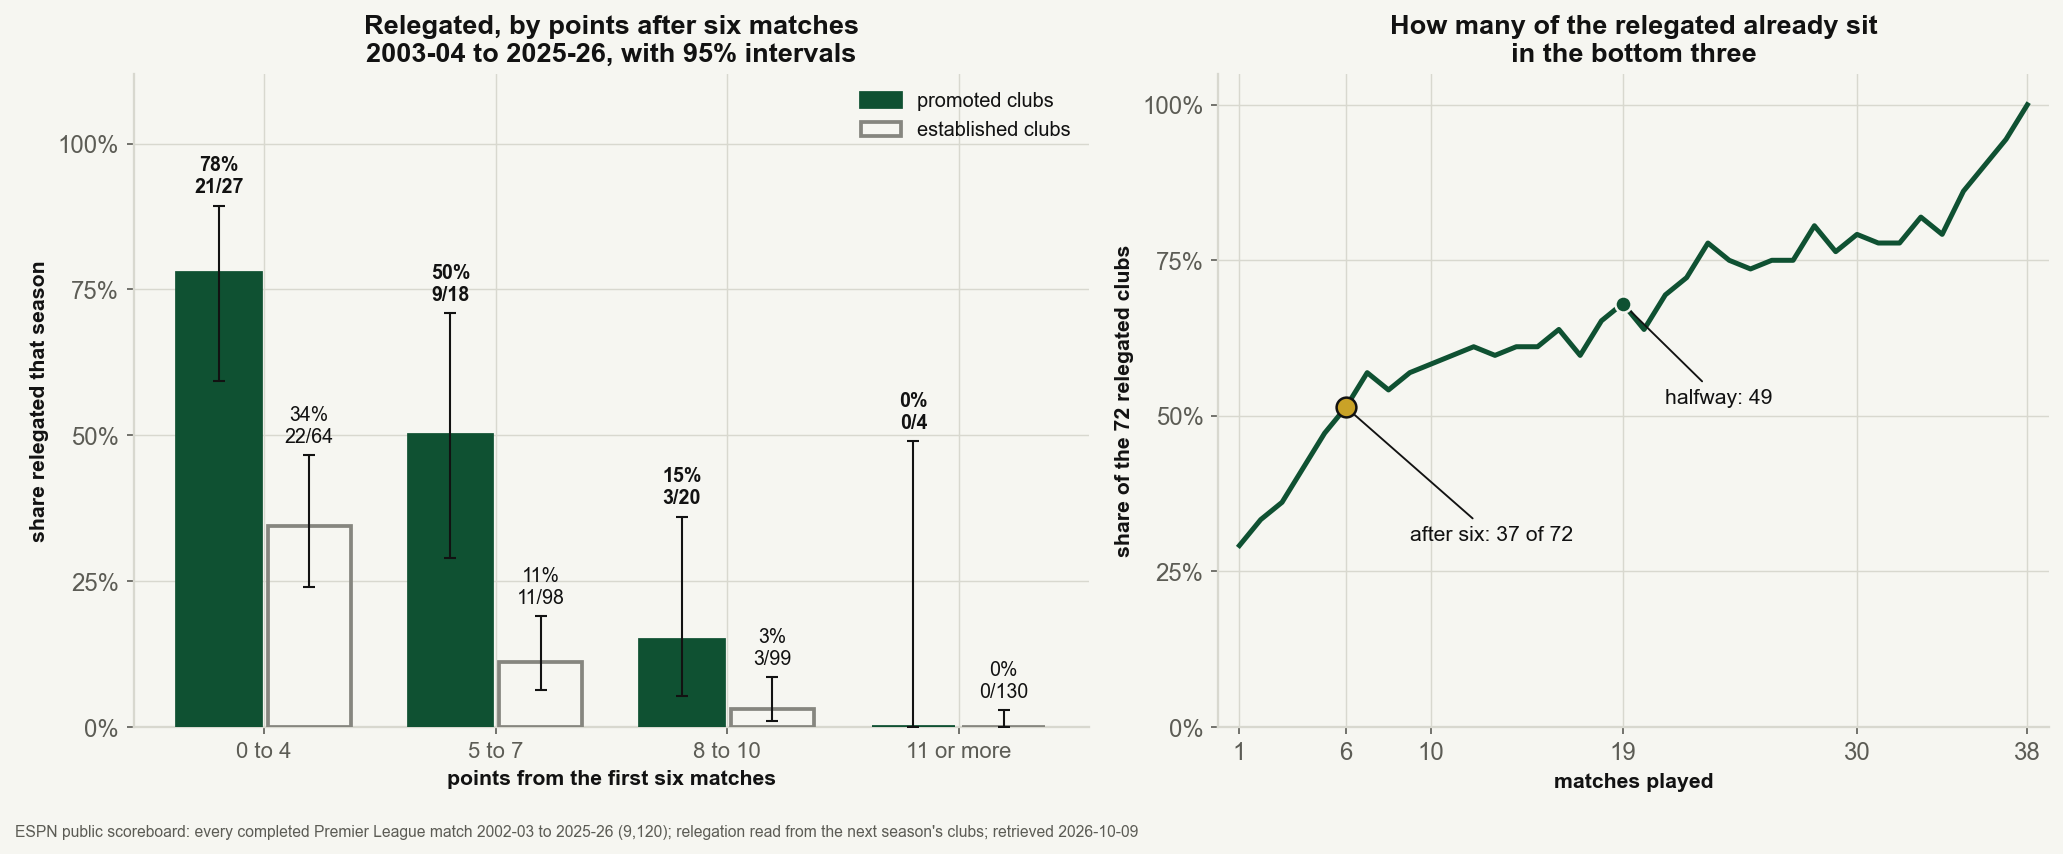
Since 2003-04, 21 of 27 promoted clubs with four points or fewer after six matches went down. Established clubs on the same total: 22 of 64.
Next Premier League match: Monday 12 October
Since 2003-04, 21 of 27 promoted clubs with four points or fewer after six matches went down. Established clubs on the same total: 22 of 64.
| # | Club | P | W | D | L | GD | Pts | Shots |
|---|---|---|---|---|---|---|---|---|
| 1 | Manchester City | 6 | 6 | 0 | 0 | +11 | 18 | 13.8 |
| 2 | Arsenal | 6 | 5 | 0 | 1 | +5 | 15 | 13.0 |
| 3 | Brighton & Hove Albion | 6 | 4 | 1 | 1 | +13 | 13 | 18.0 |
| 4 | Brentford | 6 | 2 | 4 | 0 | +6 | 10 | 15.8 |
| 5 | Everton | 6 | 2 | 4 | 0 | +3 | 10 | 15.8 |
| 6 | Chelsea | 6 | 3 | 1 | 2 | +2 | 10 | 13.7 |
| 7 | Leeds United | 6 | 2 | 3 | 1 | +3 | 9 | 12.0 |
| 8 | Hull City | 6 | 2 | 3 | 1 | +2 | 9 | 11.3 |
| 9 | Liverpool | 6 | 2 | 3 | 1 | 0 | 9 | 14.8 |
| 10 | Ipswich Town | 6 | 3 | 0 | 3 | −3 | 9 | 11.5 |
| 11 | Newcastle United | 5 | 2 | 2 | 1 | 0 | 8 | 10.2 |
| 12 | Crystal Palace | 6 | 2 | 1 | 3 | −3 | 7 | 11.0 |
| 13 | Manchester United | 6 | 1 | 3 | 2 | 0 | 6 | 20.8 |
| 14 | Nottingham Forest | 6 | 1 | 2 | 3 | −3 | 5 | 17.7 |
| 15 | Aston Villa | 6 | 1 | 2 | 3 | −5 | 5 | 11.3 |
| 16 | Sunderland | 6 | 1 | 1 | 4 | −6 | 4 | 13.0 |
| 17 | AFC Bournemouth | 6 | 0 | 3 | 3 | −6 | 3 | 12.8 |
| 18 | Tottenham Hotspur | 6 | 0 | 3 | 3 | −6 | 3 | 14.0 |
| 19 | Coventry City | 5 | 1 | 0 | 4 | −9 | 3 | 10.2 |
| 20 | Fulham | 6 | 0 | 2 | 4 | −4 | 2 | 14.2 |
Kick-off times as ESPN’s public scoreboard listed them on 25 September 2026.
In 767 first matches after an international break since 2003, underdogs won 145 times against 174.5 expected. The favourite's edge lasts one match.
For 21 seasons, Premier League sides a goal up at 90:00 won 93.3% of the time. Since added time grew in 2023-24: 85.3%. Two-goal leads are as safe as ever.
After a European night, English clubs took 1.56 league points a match against 1.62 expected. Within the same club and season the gap is -0.024: not measurable.
United take 22.6 shots a game and have 5 points. Across 2025-26, a club's five-game shot count predicted its next results better than its points did.
Home and away split the first 40 matches of 2026-27 evenly, yet the shot, corner and card columns keep the home edge. Plus a decade of home-advantage data.
Last season a club's finishing and saving rates at halfway said nothing about its second half. Four rounds into 2026-27, those rates explain most of the table.
The one metric that reshaped how football is watched — what it measures, where it comes from, and where it breaks.
A transparent Poisson model, backtested on a tournament we already know before it was allowed near the one we don't.
Every 2022 World Cup shot mapped against where the goals actually came from: attempts spray everywhere, goals collapse into a tight central band.
The honest map of where free football data actually lives — what each source covers, and what it doesn't.
The 5,000-to-1 season, re-read through the underlying numbers — how much was skill, and how much was a miracle.
When players actually peak, what fades first, and why sprinting dies before passing does.
Monte Carlo over the real 48-team format. You set the team strengths; it reports advance and title odds.
Two xG totals become a Poisson scoreline grid, win, draw and loss odds, and expected points.
A rating gap turned into a win expectancy with the logistic Elo curve.
Best of five plus sudden death, worked out exactly from one conversion rate.
All 1,494 shots on an interactive pitch, each sized by its xG. StatsBomb open data.
Every 2026 World Cup figure on the site comes from this one public JSON file.
SoccerAnalytics.net is an independent publication about the measurable side of football. The aim is simple: take the metrics that now shape how clubs recruit, coaches plan and broadcasters talk — expected goals, expected threat, PPDA, progressive actions, post-shot xG — and explain what they actually measure, where they come from, and where they break.
Nothing here is hand-waved. Every chart and table is built from public data — primarily StatsBomb open data, supplemented by Understat and FBref — and each piece names the dataset it was computed from and writes the computation out step by step, with those datasets served on this site so you can re-derive the numbers yourself. When a figure can't be sourced from a real data pull, it doesn't get published.
If you want the metrics explained honestly, the tutorials to compute them yourself, and the occasional argument about what the data does and doesn't prove, you're in the right place. Start with the stat explainers, or learn to pull the data yourself.