The 2026 World Cup So Far, By the Numbers: Just Under 3 Goals a Game
The group stage is higher-scoring than 2022, and after an early spike the rate has settled near 3 a game. The real data, and why the knockouts will still pull it down.
For the first time on this site, I can write about the 2026 World Cup with results instead of projections — the tournament is underway, and games have actually been played. This is a living snapshot, refreshed as the matches come in; here is the data-only picture through the first 76 completed matches (as of June 30). The 2026 World Cup is, so far, a higher-scoring tournament than 2022 was. The completed games have produced 2.93 goals a match, against the 2.69 that the entire 2022 World Cup averaged. That gap is real — and the rate has done what a small sample should: it spiked early, then settled. The running average peaked around 3.26 a game (through game 27) and now sits at 2.93 — still a clear step above 2022.
A note on sourcing. Every figure here comes from the completed matches only, pulled from ESPN's public results feed and refreshed June 30, 2026. Matches not yet played are excluded entirely — there are no predictions, no projected standings, and no invented numbers anywhere in this piece. As the tournament continues I refresh the data; treat every figure as “through 76 games.”
The headline: more goals than 2022
Across the 76 completed games, teams have combined for 223 goals — an average of 2.93 per match. The 2022 World Cup, all 64 games, averaged 2.69. So the 2026 rate is running about a quarter of a goal per game higher than its predecessor's full-tournament mark. Here's the distribution of total goals per match so far, with the 2026 running mean and the 2022 average marked for comparison.
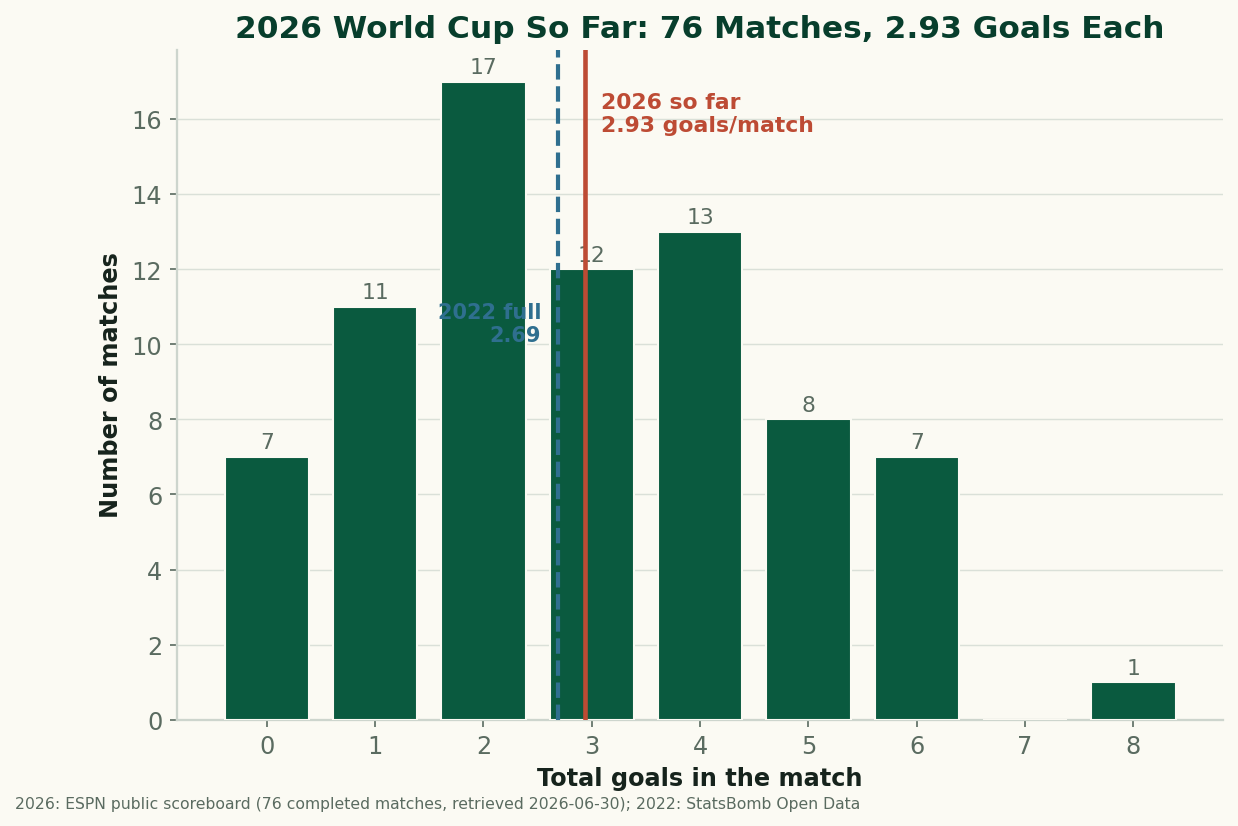
The shape is familiar — most games cluster at two to four goals — but the whole thing is shifted right of 2022, and the tail is fatter. There have been some five- and six-goal games and the odd blowout, which a 64-match tournament in 2022 produced more sparingly. At the same time, the left side of the chart has filled in: 18 of the 76 games finished with one goal or none, so this is a wide distribution, not a uniformly high-scoring one.
What's driving it: blowouts in a bigger field
Before calling 2026 a goal-fest, look at where the goals are coming from. The biggest scorelines so far are lopsided ones:
- Germany 7–1 Curaçao
- Sweden 5–1 Tunisia
- England 4–2 Croatia
- Canada 6–0 Qatar
- Netherlands 5–1 Sweden
- Morocco 4–2 Haiti
This is the expanded-format effect showing up in the data. The 2026 World Cup is the first with 48 teams, which means a wider range of quality in the field and, especially in the group games, more mismatches between heavyweights and debutants. Lopsided games are high-scoring games, and a handful of them pull the average up. Strip out the three or four most lopsided results and the average drops to right around 2022 territory. The higher scoring isn't necessarily “better, more open football” — a good chunk of it is simply bigger gaps between teams. (I dig into this polarization — more blowouts and more draws — in a companion piece.)
It hasn't been all blowouts, though
The other side of the ledger: 22 of the 76 matches — 29% — have been draws, several of them tight, evenly-matched affairs. So the tournament has split into two stories at once: a set of mismatches producing cricket scores, and a set of genuinely competitive games ending level. The 2.93 average sits on top of both. A single mean hides that the distribution is unusually wide — lots of blowouts and lots of draws — which is itself a fingerprint of a 48-team field's uneven quality.
Why it's still likely to fall
I'd still bet against 2.93 surviving to the final whistle of the tournament, for three honest reasons:
- The knockouts have begun. 4 of the 76 completed games are knockout matches, where scoring historically drops as caution rises and the mismatches disappear — so expect the average to keep easing from here.
- Group openers are the wild ones. Early group-stage matches historically run higher-scoring than what follows. As the group stage finishes and the knockouts begin — win-or-go-home games where caution rises and mismatches disappear — scoring almost always falls. In 2022 the tournament's goals-per-game drifted as the field narrowed, and the early spike here (around 3.26, now 2.93) has already partly given that back.
- The mismatches dry up. The 48-team field's quality gaps are widest in the opening round. Once the weakest teams are eliminated, the surviving games are between better-matched sides, and the biggest blowouts stop happening. The expanded-format scoring boost is, by design, a group-stage phenomenon.
Put together: the honest read is “the 2026 World Cup has opened higher-scoring than 2022, largely because a bigger field front-loads mismatches” — not “2026 will be the highest-scoring World Cup ever.” The early gap has narrowed and steadied; check back once the knockouts are in.
The limits of this snapshot
- Completed matches only. This is a moving target; every figure is “as of 76 games” and refreshed as more are played.
- One source. The results come from a single public feed (ESPN). Scores are about as verifiable as data gets — they're widely reported and easy to cross-check — but I'm not triangulating multiple providers, and finals after extra time are recorded as the post-ET score (penalty-shootout winners aren't separated here).
- Goals are a blunt lens. Total goals say nothing about chance quality. A 1–1 can be a thriller and a 3–0 can be a bore; the underlying expected goals would tell a richer story, but shot-level data for 2026 isn't in hand yet, so this piece stays at the scoreline level.
- No projections. Nothing here forecasts results, qualification, or a winner. It's a description of games already played, full stop.
The takeaway
Through 76 games, the 2026 World Cup is outscoring 2022 by about a quarter of a goal a match — 2.93 to 2.69 — with the gap powered by the lopsided games a 48-team field produces, even as 29% of the matches have ended level. After an early spike the rate has settled. It's a real, sourced snapshot, and it's genuinely interesting. It's also shaped by group-stage forces (group openers, mismatches) that fade once the knockouts arrive. The number to watch isn't 2.93 today; it's where it settles once win-or-go-home football begins.
Reproduce it
The completed-match results are bundled in data_layer/wc2026_results.json (pulled from ESPN's public scoreboard API, refreshed 2026-06-30, completed matches only). Goals per match is just home_score + away_score; the distribution, the 2026 mean, and the 2022 comparison are drawn by charts/chart_wc2026_so_far.py against that file and the bundled wc2022_matches.json. This page itself is regenerated from the live data by data_layer/refresh_worldcup.py each daily build, so the numbers and the chart can never drift apart. No network at build time, nothing hand-entered.
Sources & further reading
- Free textbook: Chapter 5: Introduction to Soccer Metrics — the theory behind this, at DataField.dev.
- 2026 results: bundled
data_layer/wc2026_results.json— ESPN public scoreboard feed (soccer/fifa.world), 76 completed matches, refreshed 2026-06-30. Charted bycharts/chart_wc2026_so_far.py. - 2022 comparison: bundled
data_layer/wc2022_matches.json— StatsBomb Open Data (CC BY-NC-SA 4.0), all 64 matches. - Companion: More draws and more blowouts: 2026 is more polarized than 2022 and what actually wins games.
- Context: Inside the 2022 World Cup: what all 64 results say — the predecessor this is measured against.
More from World Cup 2026
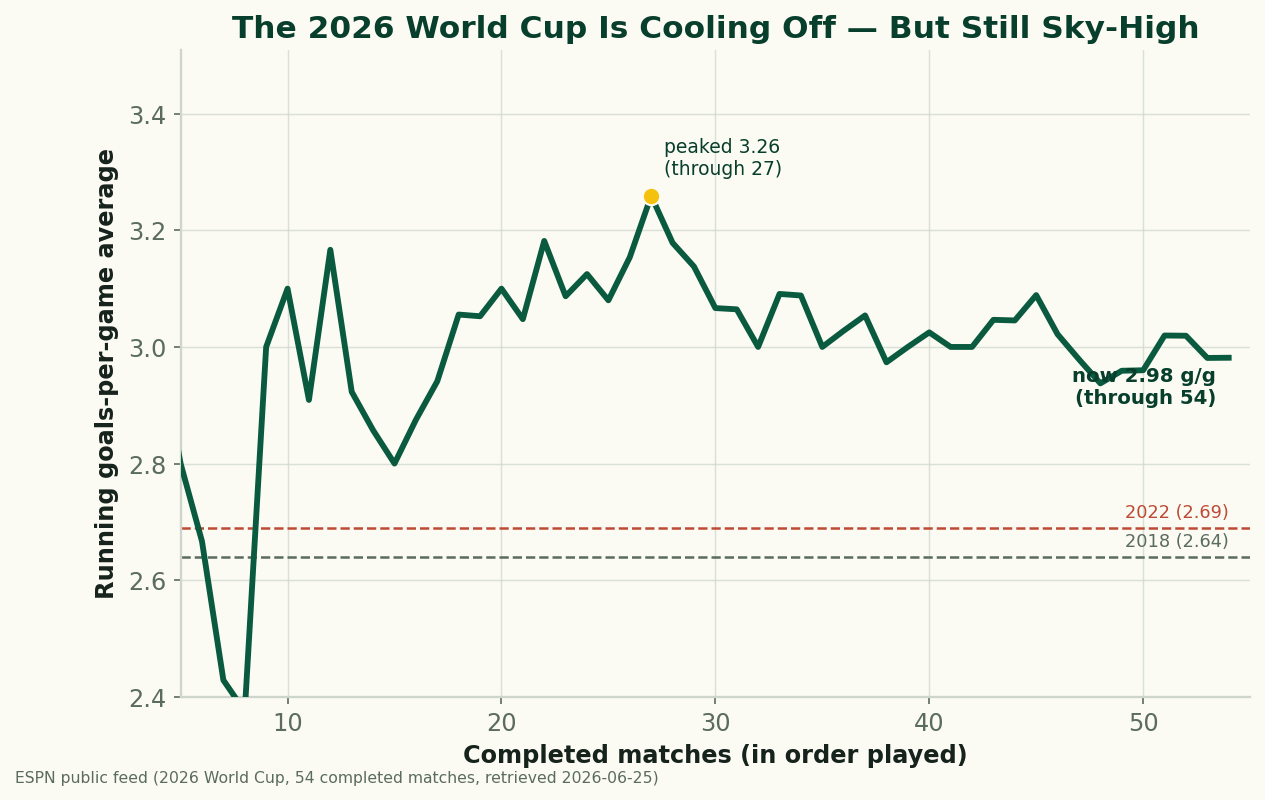
The 2026 World Cup Is Cooling Off — and Still the Highest-Scoring in Generations
Through 54 completed matches, the 2026 World Cup is averaging 2.98 goals a game — down from a blistering 3.26 early on, but still comfortably above 2022 (2.69) and 2018 (2.64), and the highest-scoring World Cup since 1970. A refreshed look at where the goals are going as the group stage closes.
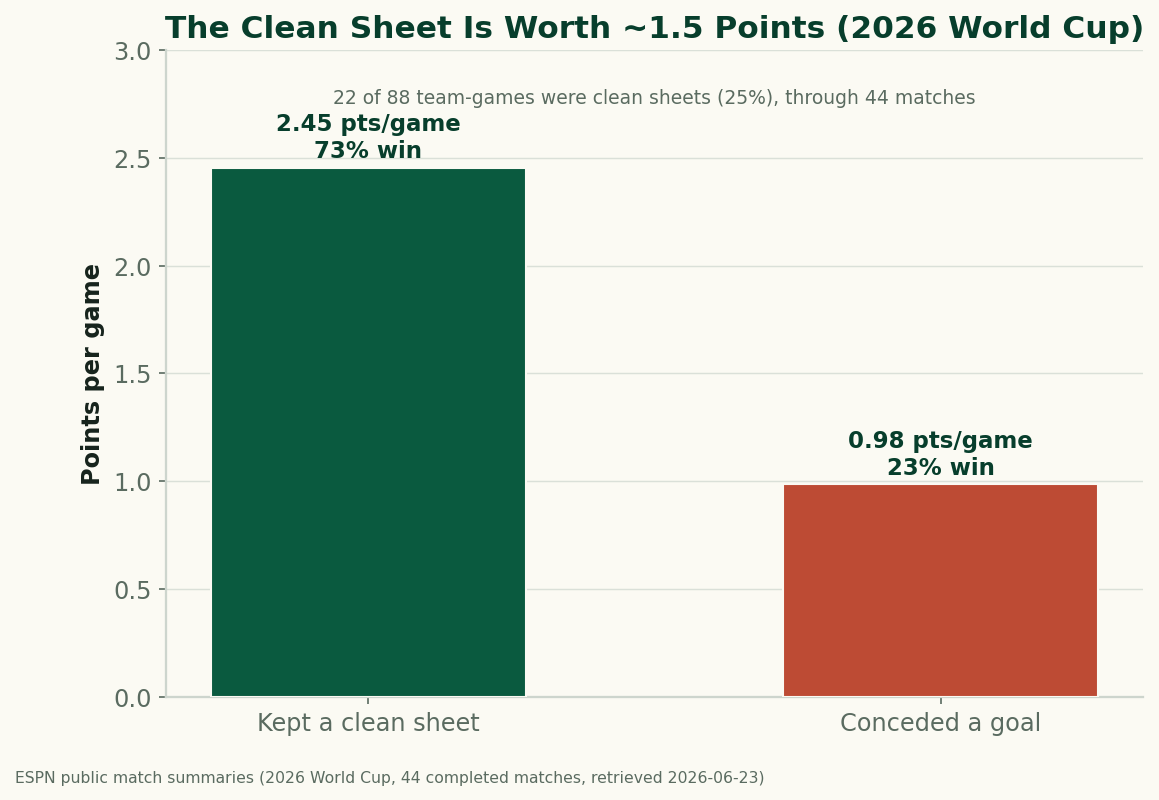
The Clean Sheet Is the Most Valuable Thing at the 2026 World Cup
Through 44 completed matches, a team that keeps a clean sheet at the 2026 World Cup averages 2.45 points and wins 73% of the time; a team that concedes averages under 1. Don't concede and you almost can't lose — the data on what a clean sheet is worth.
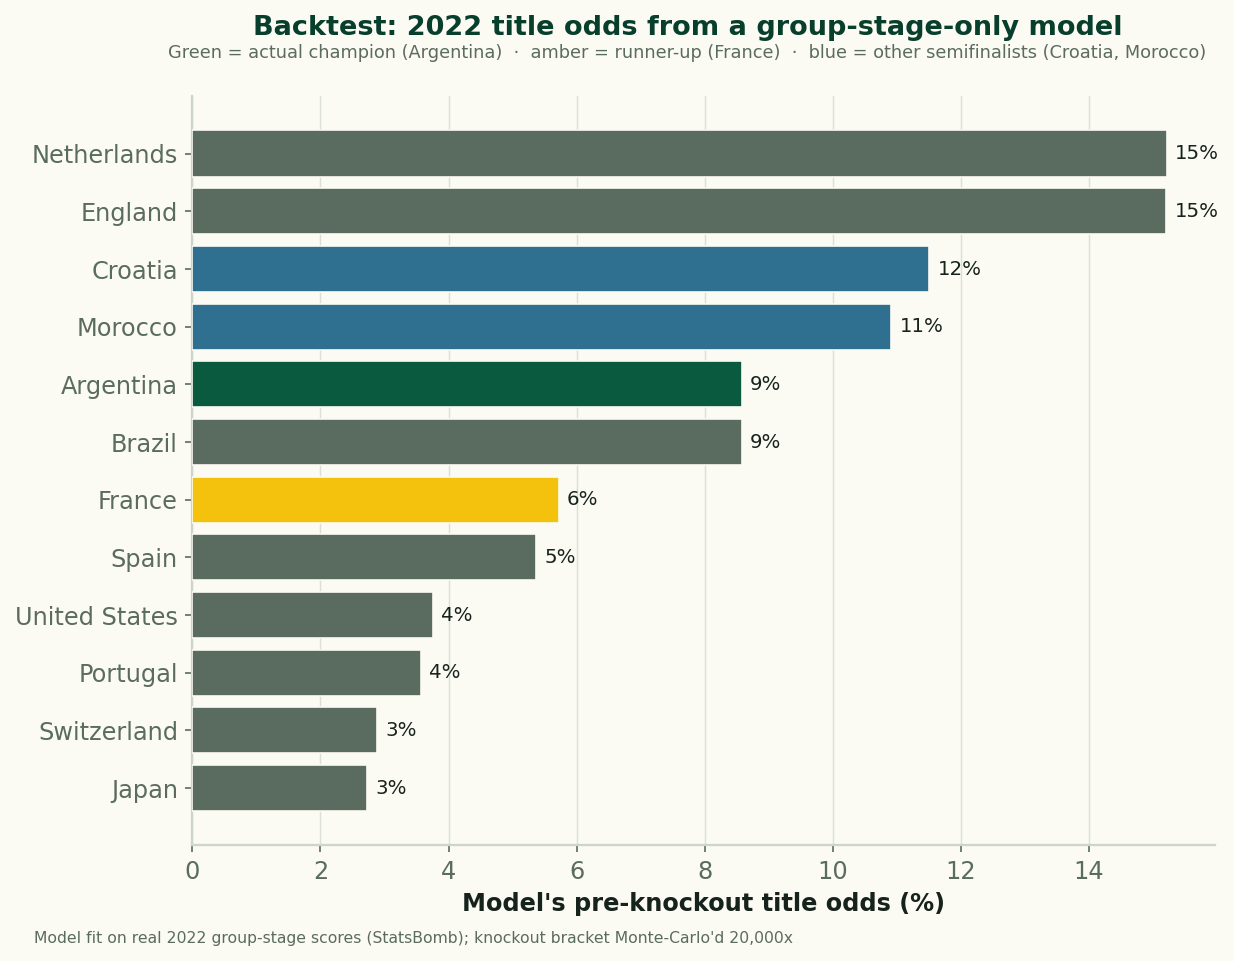
We Built a World Cup Prediction Model — Then Backtested It on 2022
A transparent Poisson prediction model, fit only on 2022 group-stage scores and Monte-Carlo'd through the real knockout bracket 20,000 times. Its top tier held the eventual champion and two of the four semifinalists — and no team topped 15%, which is the real lesson. Then we apply the same model, with loud caveats, to the 44 completed 2026 matches.