Do Corners Matter? 184 Team-Games of 2026 World Cup Evidence
Commentators read the corner count like a scoreboard. At this World Cup it predicts almost nothing — teams that out-cornered their opponent won barely half the time, and the heaviest corner counts belong to teams that were losing.
Every broadcast does it: the corner count flashes up alongside possession, as if it were a second scoreboard. At this World Cup it is barely a statistic. Across all 92 completed matches — 184 team-games — the team that won the corner count went on to win the match 43 times out of 83 where the counts differed. That is 52%: a coin flip. And the teams with the very heaviest corner hauls, ten or more in a game, won less often than the tournament average — because a double-digit corner count is usually the signature of a team chasing a game it is losing.
Sourcing. All numbers computed from our bundled match dataset — 92 completed matches as of July 6, from ESPN’s public scoreboard and match-summary feeds, served raw at /data/wc2026_results.json. A “team-game” is one team’s side of one match; corner counts exist for all 184. Chart script in the repo.
The exhibit
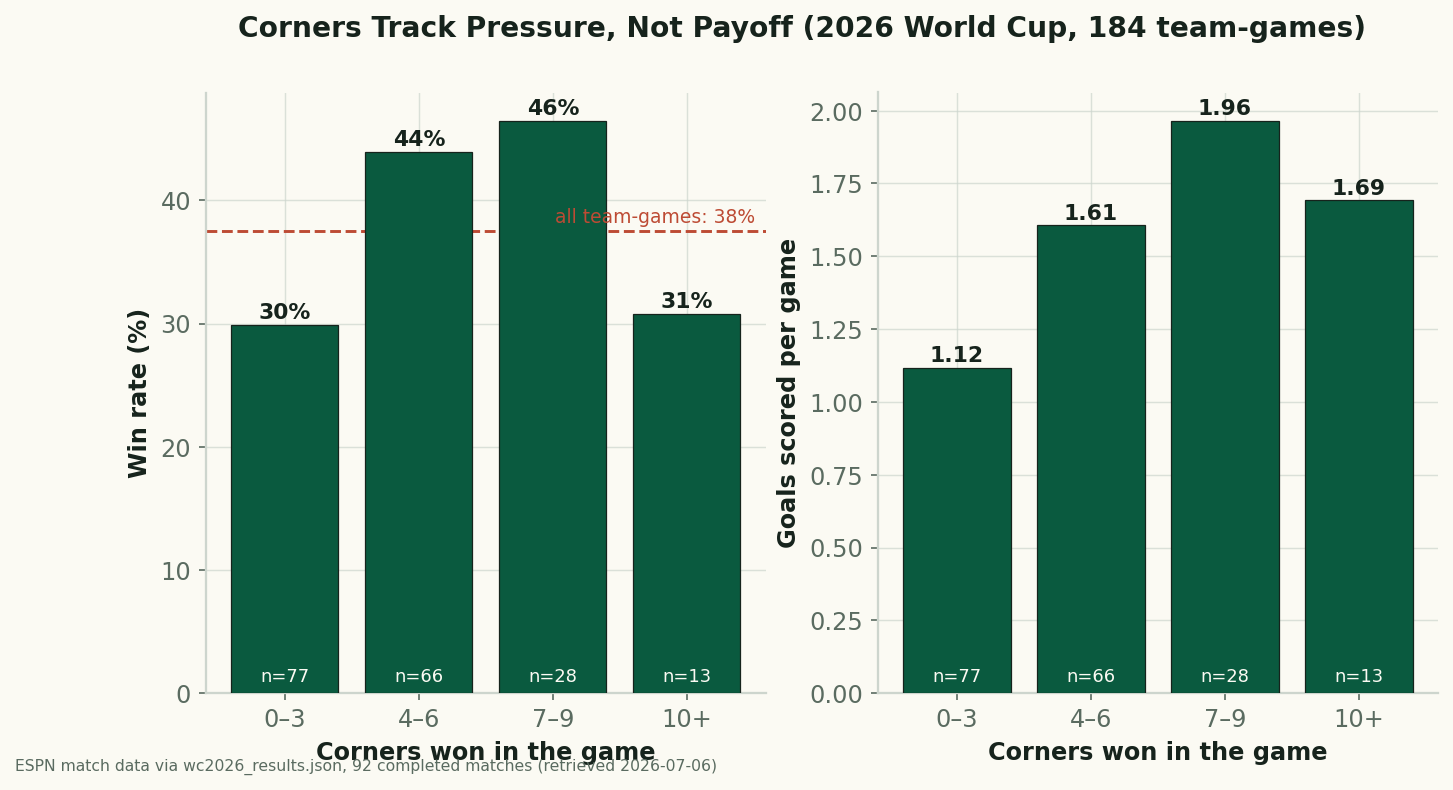
| Corners won | Team-games | Win rate | Goals scored/game |
|---|---|---|---|
| 0–3 | 77 | 30% | 1.12 |
| 4–6 | 66 | 44% | 1.61 |
| 7–9 | 28 | 46% | 1.96 |
| 10+ | 13 | 31% | 1.69 |
What the numbers actually say
Three findings, in decreasing order of comfort for corner-count romantics:
- Corner volume correlates with scoring only weakly. Across the 184 team-games, the correlation between corners won and goals scored is +0.23. The same calculation for shots on target gives +0.61. Corners carry about a third of the signal, and most of that is indirect — attacking teams win both corners and games, so the two travel together without one causing the other.
- Out-cornering your opponent means almost nothing. Of the 83 matches where one side won the corner count outright, that side won the match 43 times — 52%. Compare our group-stage finding that the side with more shots on target won 88% of decisive games. One of these statistics identifies winners; the other identifies which team took more kicks from a flag.
- The heaviest counts flag desperation, not dominance. The 13 team-games with 10+ corners produced a 31% win rate — below the 38% baseline. This tournament’s round of 16 supplied both poster children: Mexico won the corner count 12–2 against England and lost 3–2; Canada won it 11–1 against Morocco and lost 3–0. Late-game siege football manufactures corners in bulk; it manufactured zero wins from those two nights.
Squaring this with set-piece goals
None of this says corners are worthless as events — it says the count is worthless as a scoreboard. Our event-level study of 2022 found that set pieces started 30% of all goals, corners included; a well-taken corner is a genuine scoring chance worth roughly 2–3 goals per hundred, the figure Anderson and Sally documented in The Numbers Game a decade ago. Both things are true at once: each corner is worth a small, real amount, and the number of corners a team accumulates tells you close to nothing about who is winning, because the accumulation rate is driven by game state. When a statistic can be inflated simply by needing to attack, it stops discriminating between good teams and desperate ones. That is the corner count’s fatal flaw, and it is why possession — this tournament’s other over-read number — fails the same way.
How to use this while you watch
Practically: when the corner count flashes up during a knockout tie, read it as a pressure gauge, not a scoreboard. A team stacking corners is telling you which end of the pitch the game has settled in, and often that it is chasing; it is not telling you who is likely to win. The number worth tracking in real time is shots on target — the one column that has separated winners from losers all tournament. And if you follow the corner-count prop markets that sportsbooks love, note that this is exactly the kind of statistic game state inflates: a trailing favourite generates corners at garbage-time rates without generating win probability to match.
Honest limitations
- Match-level data only. Our 2026 feed has corner counts, not corner outcomes — we cannot compute this tournament’s per-corner conversion directly. The 2022 event data and published research supply that piece.
- Small top bucket. The 10+ group is 13 team-games; its below-baseline win rate is directionally consistent with the game-state story but not precise. The 52% out-cornering result (n=83) is the sturdier headline.
- Correlation, not causation, in both directions. We are not claiming corners reduce winning — only that counting them adds almost nothing once you know the shots on target.
- One tournament, in progress. 92 matches as of July 6; the knockout rounds will add ~12 more. We’ll re-run the numbers if the pattern moves.
Sources
- Match results and team stats: ESPN public scoreboard + match-summary APIs, parsed to
data_layer/wc2026_results.json(92 completed matches, retrieved 2026-07-06); raw snapshot served at /data/wc2026_results.json. Chart:charts/chart_wc2026_corners.py. - Chris Anderson & David Sally, The Numbers Game — the original corner-value research (~2% of corners become goals; corner counts don’t predict wins).
- Related: what actually wins games at this World Cup and how goals originate (2022 event data).
More from World Cup 2026
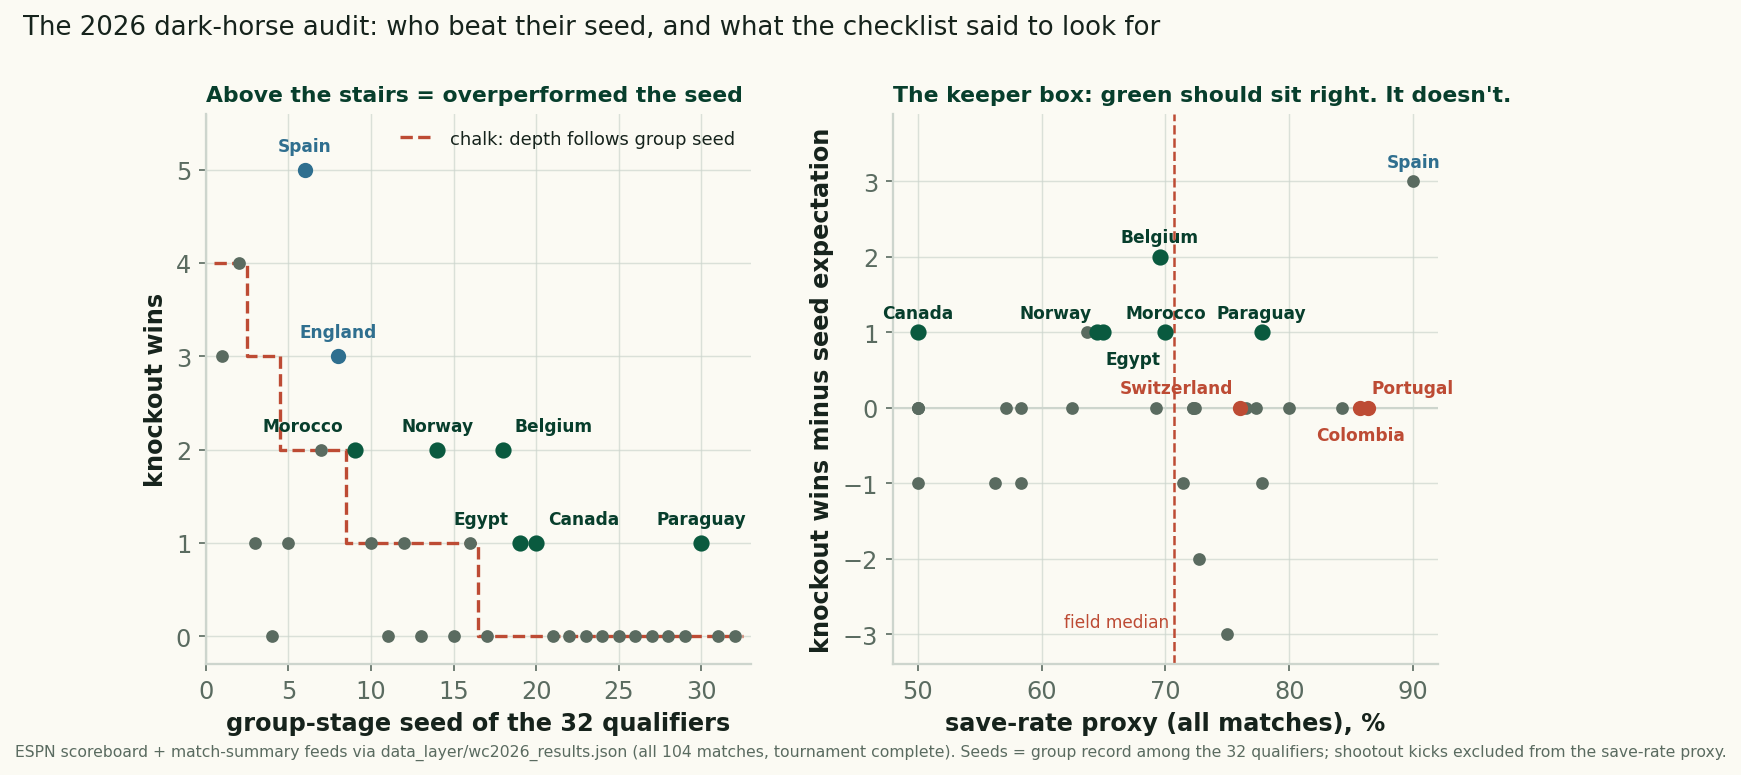
The 2026 Dark-Horse Audit: Grading Our June Checklist
Six teams beat their group seed at the 2026 World Cup, scored against our pre-tournament checklist: the keeper box failed, the kind draw barely helped.
The Shootouts: Rarer, Earlier, and a Reprieve That Never Lasted
Retro #4 closes the series: the shootout rate fell to 12.5% of knockout games from 2022's 31%, all four came early, and survivors went 1-3 next time out.
The Groups Told the Truth: How June Predicted July at the 2026 World Cup
Group-stage points strongly predicted knockout survival: 9-point teams went 3-for-3, 4-point teams 2-for-11, and the last four all ranked top-8.