Possession Is Overrated: What Actually Wins Games at the 2026 World Cup So Far
Winners average 54% possession but more than double the shots on target. Quality beats quantity beats the ball.
Now that the 2026 World Cup has real games to study, here's a question worth answering with data instead of punditry: what actually separates the winners? This is a living snapshot, refreshed as matches come in. Through 32 completed games I pulled the per-match boxscores and split the 22 decisive ones (the other 10 were draws) into winners and losers. The verdict is blunt: possession barely tells you who won, and shots on target tell you almost everything. The team that out-possessed its opponent won 64% of the time. The team with more shots on target won 84%.
Sourcing, again, up front. Every number here is from the completed matches only, with team stats (possession, shots, shots on target) pulled from ESPN's public match-summary feed and refreshed June 20, 2026. No unplayed games, no projections, nothing invented. It's a snapshot through 32 games, and I'll say where that limits the conclusions.
The exhibit: winners vs. losers
Here are the average stat lines of the winning and losing teams across the 22 decisive matches. Each row is scaled to its own maximum so the three different units fit one chart; the real values are printed on the bars.
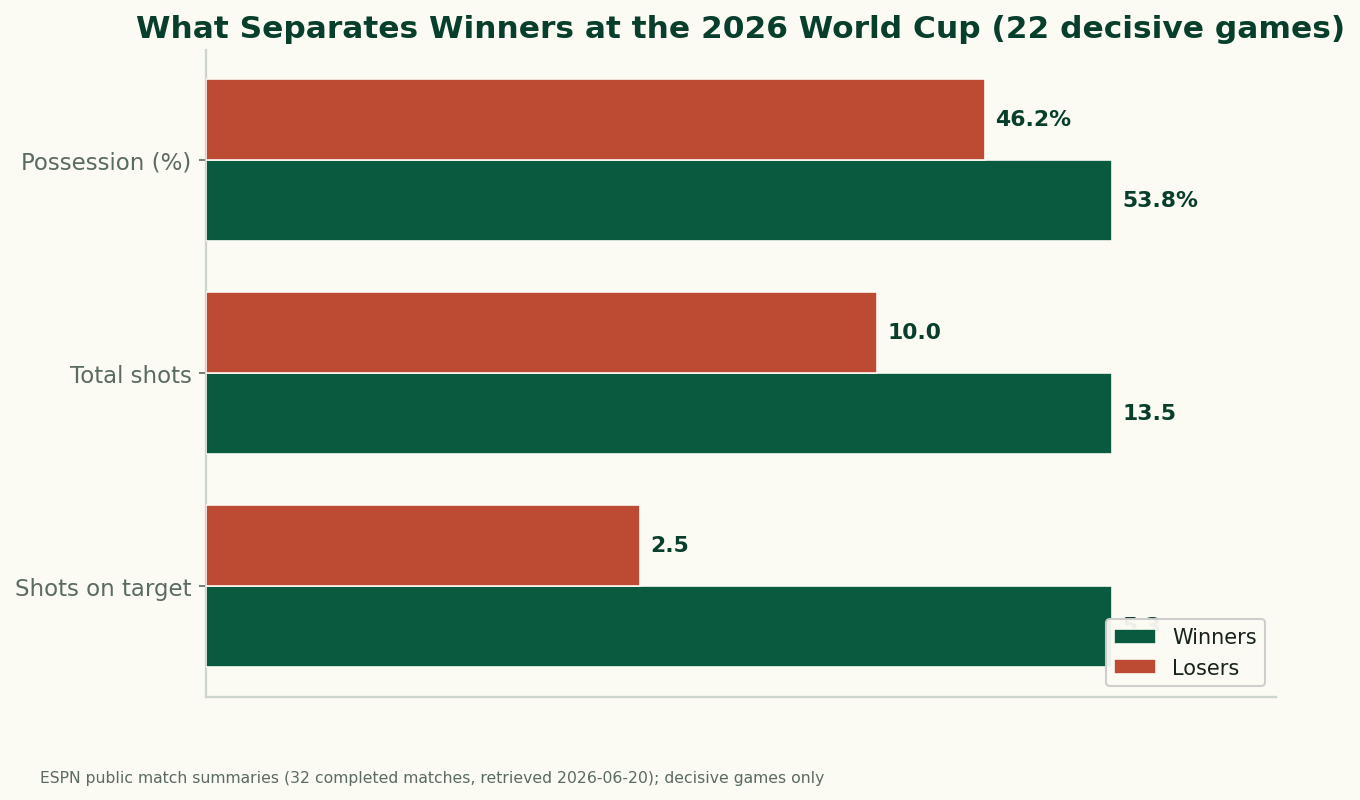
Read the three rows top to bottom and you watch the signal strengthen. Possession: winners averaged 53.8% to losers' 46.2% — a real edge, but a modest one, the kind a team can lose and still win the match. Total shots: winners 13.5 to losers 10.0 — a clearer gap. Shots on target: winners 5.3 to losers 2.5 — winners hit the target more than twice as often. The further you move from "who had the ball" toward "who created real chances," the more decisively the stat picks the winner.
The win rates make it concrete
Averages can hide exceptions, so here's the head-to-head version. In the 22 decisive games:
- The team with more possession won 14 of 22 (64%) — better than a coin flip, but barely a rule.
- The team with more shots on target won 16 of 19 (84%) — nearly automatic (three games had teams level on shots on target).
That's the whole article in two lines. Possession is a weak predictor you can comfortably bet against once a game; shots on target is the closest thing to a law the early tournament has produced. Hold the ball all you like — if the other team is forcing more saves, they're probably winning.
Quality beats quantity, too
It isn't just that shots beat possession; it's that good shots beat many shots. Correlate each team's shot numbers with goals scored across all 64 team-performances and the difference is stark:
- Shots on target vs. goals: r = 0.67 — a strong relationship.
- Total shots vs. goals: r = 0.33 — much weaker.
Piling up attempts from anywhere is a mediocre way to score; making the goalkeeper work is a good one. This is the same logic that underpins expected goals — not all shots are equal, and a model that weights chance quality beats one that just counts attempts. We don't have shot-level xG for 2026 in hand yet, but "shots on target" is a crude, real proxy pointing in the same direction: quality is what converts.
Why possession misleads
If possession is such a weak signal, why does it dominate the broadcast graphics? Two reasons, both visible in this data. First, possession is a means, not an end — it only matters insofar as it produces shots, and plenty of it doesn't. A team can knock the ball around its own half to a gaudy 60% and create nothing. Second, trailing teams chase the ball: once a side falls behind, it attacks and possesses more out of necessity, while the leader sits deeper and counters. So possession often flows to the team that's losing, which actively weakens its link to winning — the same game-state effect that distorts so many in-game stats. I found exactly this pattern in the 2022 final, where Argentina dominated possession and still needed penalties. The 2026 data says that final wasn't a fluke of measurement — it's the normal weak relationship between holding the ball and winning, now visible across 22 games.
The limits of this snapshot
- Small sample, group stage only. Twenty-two decisive games is enough to see a strong pattern but not to nail down exact rates — the 84% shots-on-target win rate (16 of 19) will move as more games are played. Treat it as "through 32 games."
- Correlation, not causation. Better teams take more good shots and win because they're better; shots on target is partly a proxy for being the stronger side, not purely a cause of victory. The arrow runs both ways.
- Shots on target is a coarse quality measure. It counts a tame shot straight at the keeper the same as a point-blank header. Real shot quality needs location and context; on-target is the best simple proxy available here, not the last word.
- One source, completed games only. Stats come from a single public feed (ESPN); I haven't cross-checked providers for the per-match details, and nothing here covers unplayed fixtures.
The takeaway
Through 32 games, the 2026 World Cup is delivering a clean lesson that the analytics world has preached for years: possession is overrated, and the quality of your chances is what wins. The team that holds the ball wins a little more often than not; the team that hits the target wins almost always. If you're going to watch one number scroll across the bottom of the screen, make it shots on target — not the possession percentage that feels like it should matter and mostly doesn't.
Reproduce it
The per-match team stats are bundled in data_layer/wc2026_results.json (pulled from ESPN's public match-summary endpoint, refreshed 2026-06-20, completed matches only). Split decisive games into winner/loser, average possession, total shots, and shots on target, and count how often the leader in each metric won. The chart is drawn by charts/chart_wc2026_what_wins.py against that file. No network at build time, nothing hand-entered.
Sources & further reading
- Free textbook: Chapter 5: Introduction to Soccer Metrics — the theory behind this, at DataField.dev.
- 2026 per-match stats: bundled
data_layer/wc2026_results.json— ESPN public match-summary feed (soccer/fifa.world), 32 completed matches, refreshed 2026-06-20. Charted bycharts/chart_wc2026_what_wins.py. - Companion: The 2026 World Cup so far, by the numbers and more draws and more blowouts.
- Background: Expected goals explained — why chance quality beats shot volume.
- Background: Possession isn't control: the 2022 final — the same lesson in a single match.
More from World Cup 2026
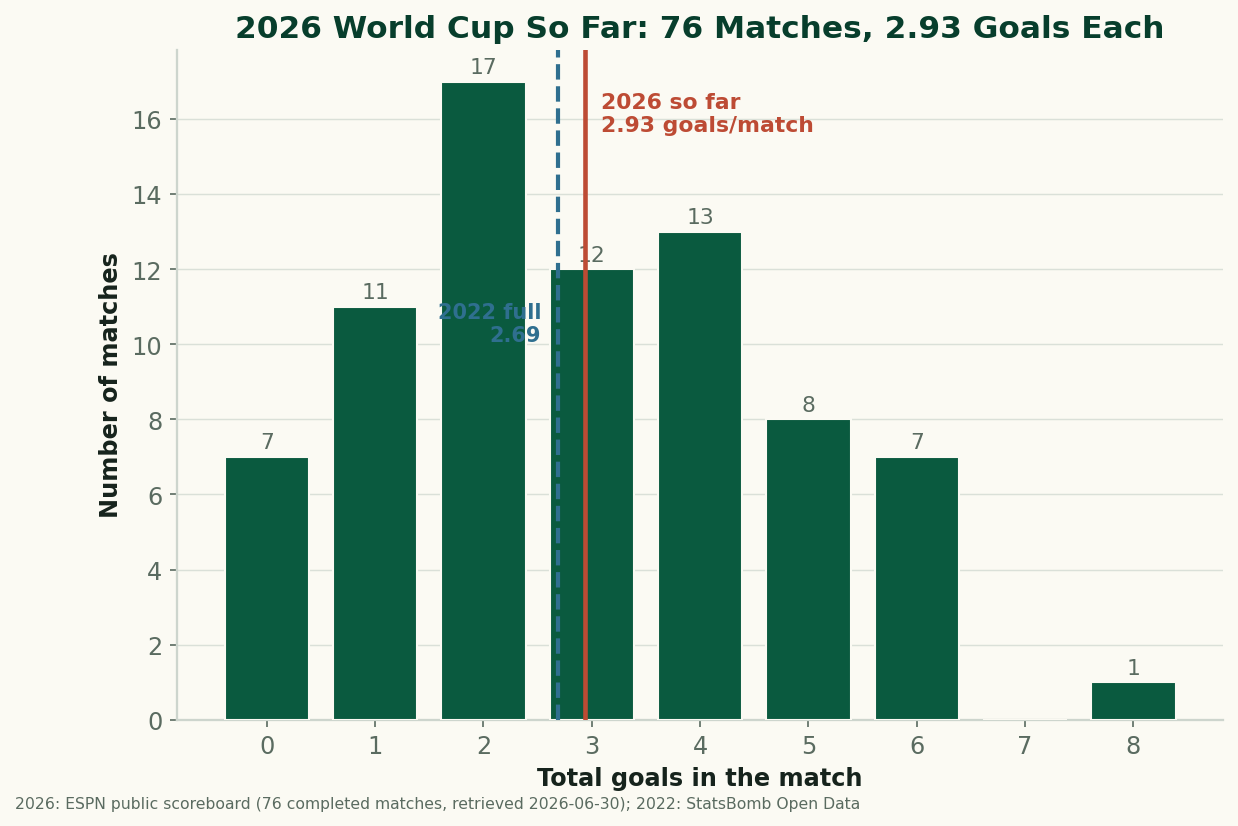
The 2026 World Cup So Far, By the Numbers: Just Under 3 Goals a Game
Through 76 completed matches, the 2026 World Cup is still outscoring 2022 — 2.93 goals a game to 2.69. After an early spike the rate has settled just under 3 a game. The real, sourced numbers on goals, draws, and the blowouts behind them, with honest caveats about a group-stage-only sample. (A living snapshot, refreshed as games are played.)
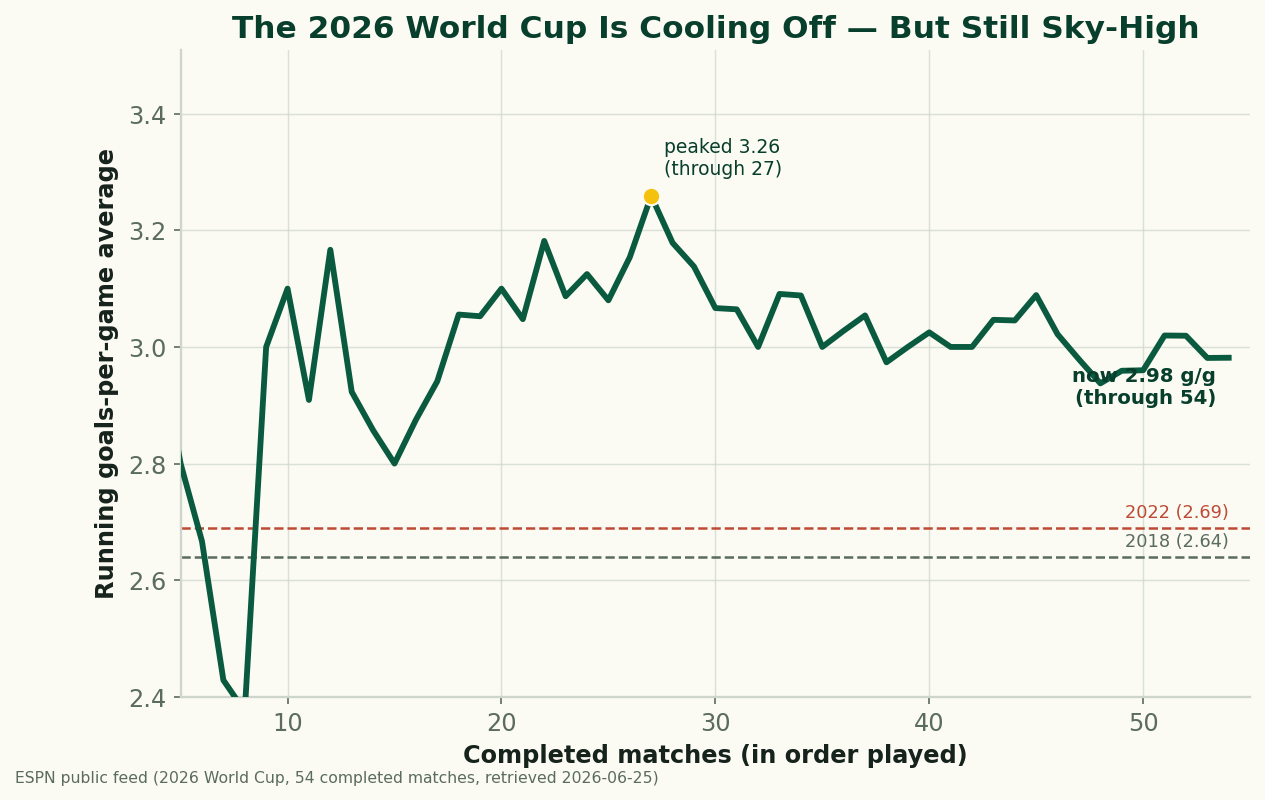
The 2026 World Cup Is Cooling Off — and Still the Highest-Scoring in Generations
Through 54 completed matches, the 2026 World Cup is averaging 2.98 goals a game — down from a blistering 3.26 early on, but still comfortably above 2022 (2.69) and 2018 (2.64), and the highest-scoring World Cup since 1970. A refreshed look at where the goals are going as the group stage closes.
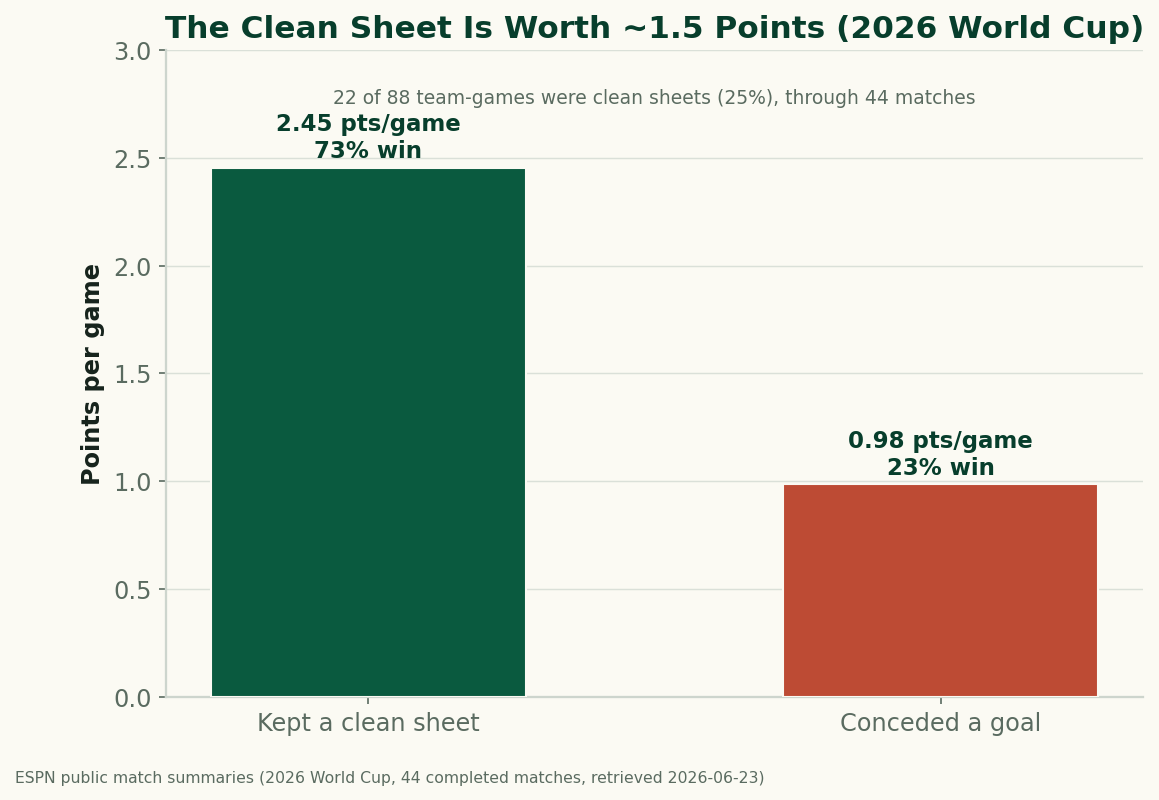
The Clean Sheet Is the Most Valuable Thing at the 2026 World Cup
Through 44 completed matches, a team that keeps a clean sheet at the 2026 World Cup averages 2.45 points and wins 73% of the time; a team that concedes averages under 1. Don't concede and you almost can't lose — the data on what a clean sheet is worth.