Set Pieces, Open Play, and Counters: Where 2022 World Cup Goals Came From
Open play makes the most goals, set pieces make almost a third, and the counter-attack is the deadliest origin of all. The possession-origin breakdown.
Coaches obsess over set pieces for a reason: in a tournament of fine margins, a corner routine or a free-kick delivery is one of the few moments a team can rehearse and control. But how much of the scoring do they actually account for? Trace every goal from all 64 matches of the 2022 World Cup back to how its possession began, and the breakdown is clarifying. Of the 152 non-penalty goals, open play produced the most (46%), set pieces — corners and free kicks — originated nearly a third (30%), and the counter-attack, though it created few chances, was the deadliest origin of all at 17.9% conversion.
Sourcing. Every figure is computed from StatsBomb's free, public 2022 World Cup data. Each shot carries a “play pattern” describing how the possession that produced it started — regular play, from a corner, from a free kick, from a throw-in, or from a counter. Penalties are excluded throughout. Nothing is from memory or invented.
The exhibit: origin and efficiency
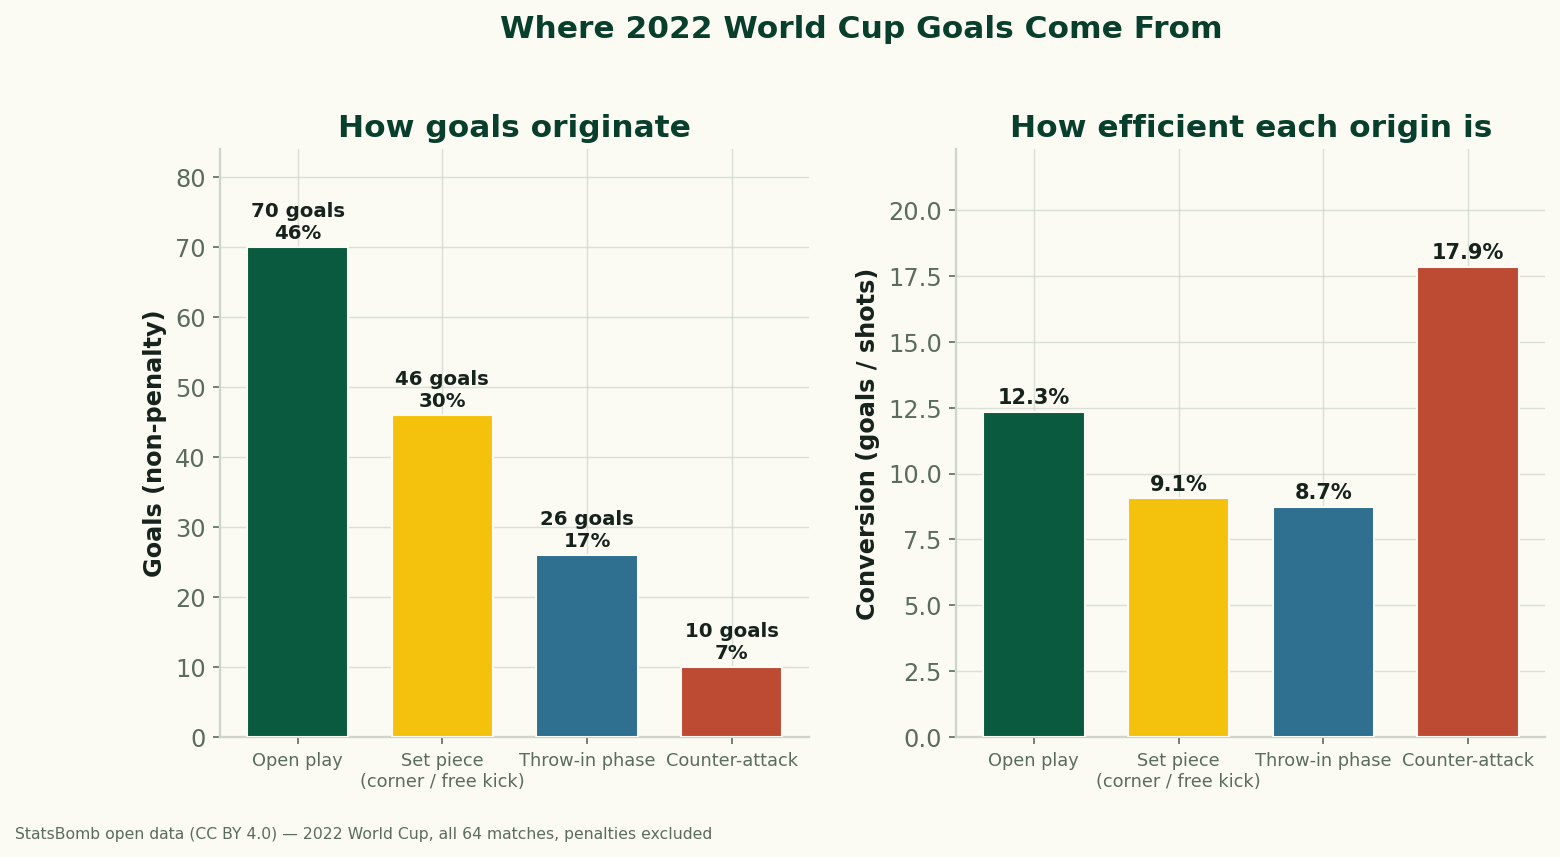
The two panels make different points. The left shows volume — open play is the biggest single source, but set pieces and throw-in phases together originate nearly half the goals, a reminder that a huge share of scoring flows from restarts rather than flowing moves. The right shows efficiency — and here the order flips. The counter-attack, which produced just 10 goals, converted them at 17.9%, well ahead of open play's 12.3% and set pieces' 9.1%.
What “origin” means here
A crucial clarification: the play pattern describes how the possession started, not how the goal was finished. A goal tagged “from a corner” might be a header off the initial delivery or a scrambled finish three passes later — the point is the corner began the sequence. Likewise “from a free kick” counts the goals that flow from a free-kick restart, not only balls struck directly into the net. This is the standard way analysts attribute set-piece value, because the whole point of a set piece is the attacking sequence it launches, not just the first contact. It's why teams pour so much preparation into them: the entire phase is scriptable.
Why set pieces convert below open play
It can seem backwards that set pieces — the rehearsed, controlled moments — convert worse (9.1%) than chaotic open play (12.3%). The reason is that set pieces force shots from crowded, defended areas. A corner pits attackers against a packed six-yard box; a free kick is struck over or around a set wall with the keeper positioned. Open play, by contrast, includes the through-balls and breakaways that produce clean looks at goal. Set pieces generate a lot of shots (more than 800 of them), but they're contested shots, so the per-shot return is lower even as the total goal count is high. Volume, not efficiency, is the set-piece edge — and in a low-scoring sport, volume from a controllable source is gold.
The counter-attack premium
The counter-attack's 17.9% conversion is the standout number, and it makes intuitive sense: a counter attacks a defense that is out of shape, stretched, and outnumbered, producing exactly the clean, central chances that convert best. The catch is scarcity — only 56 counter shots in the whole tournament, because you first need to win the ball and break at speed against a committed opponent. That's the strategic tension a coach manages: counters are the most efficient way to score, but you can't manufacture them at will, so teams lean on set pieces and open play for reliable volume and treasure the counter when it comes. For a worked example of how a few high-quality chances outweigh many poor ones, try the explorer below.
This explorer needs JavaScript. It turns two teams' expected goals into win/draw/loss odds, so you can feel how a few high-conversion counter chances stack up against a pile of contested set-piece looks.
The honest caveats
- Origin is the possession start, not the finish. “From a corner” credits the whole sequence the corner launched, which is the right unit for set-piece value but isn't the same as “scored directly from a corner.”
- Throw-ins are a gray area. We separate throw-in phases from true dead-ball set pieces; many would lump some long-throw routines in with set pieces, which would push the set-piece share higher.
- Small counts at the edges. Ten counter-attack goals is a thin sample — the 17.9% conversion is real for 2022 but will bounce around tournament to tournament.
- Penalties excluded. Including penalties (which convert ~75%) would add a large, separate set-piece bucket and change every share; this is the open-play-and-restart picture.
The takeaway
Goals come from everywhere, but not equally. Open play is the engine of World Cup scoring, set pieces are the reliable, rehearsable supplement that delivers nearly a third of goals through sheer volume, and the counter-attack is the scalpel — rare, but the most efficient cut of all. The practical lesson mirrors what good coaches already do: drill your set pieces for volume you can count on, defend the counter because it's where you're most vulnerable, and prize the transition moment when it arrives. For when these goals tend to arrive, see the timing of World Cup goals, and for the conceptual deep dive, set pieces at the World Cup.
Reproduce it
From data_layer/wc2022_shots.json, drop penalties, group each shot by its play_pattern into open play, set piece (corner / free kick), throw-in phase, and counter, then count goals and compute goals ÷ shots per group. The chart is drawn by charts/chart_wc2022_set_pieces.py. No network at build time, nothing hand-entered.
Sources & further reading
- Free textbook: Chapter 14: Set Piece Analytics — the theory behind this, at DataField.dev.
- Shot & play-pattern data: StatsBomb open data (CC BY 4.0), FIFA World Cup 2022, all 64 matches, bundled as
data_layer/wc2022_shots.json. Data provided by StatsBomb. - Companion: when goals are scored · where goals are scored from.
- Concept: set pieces at the World Cup · the World Cup hub.
More from Data Deep-Dives
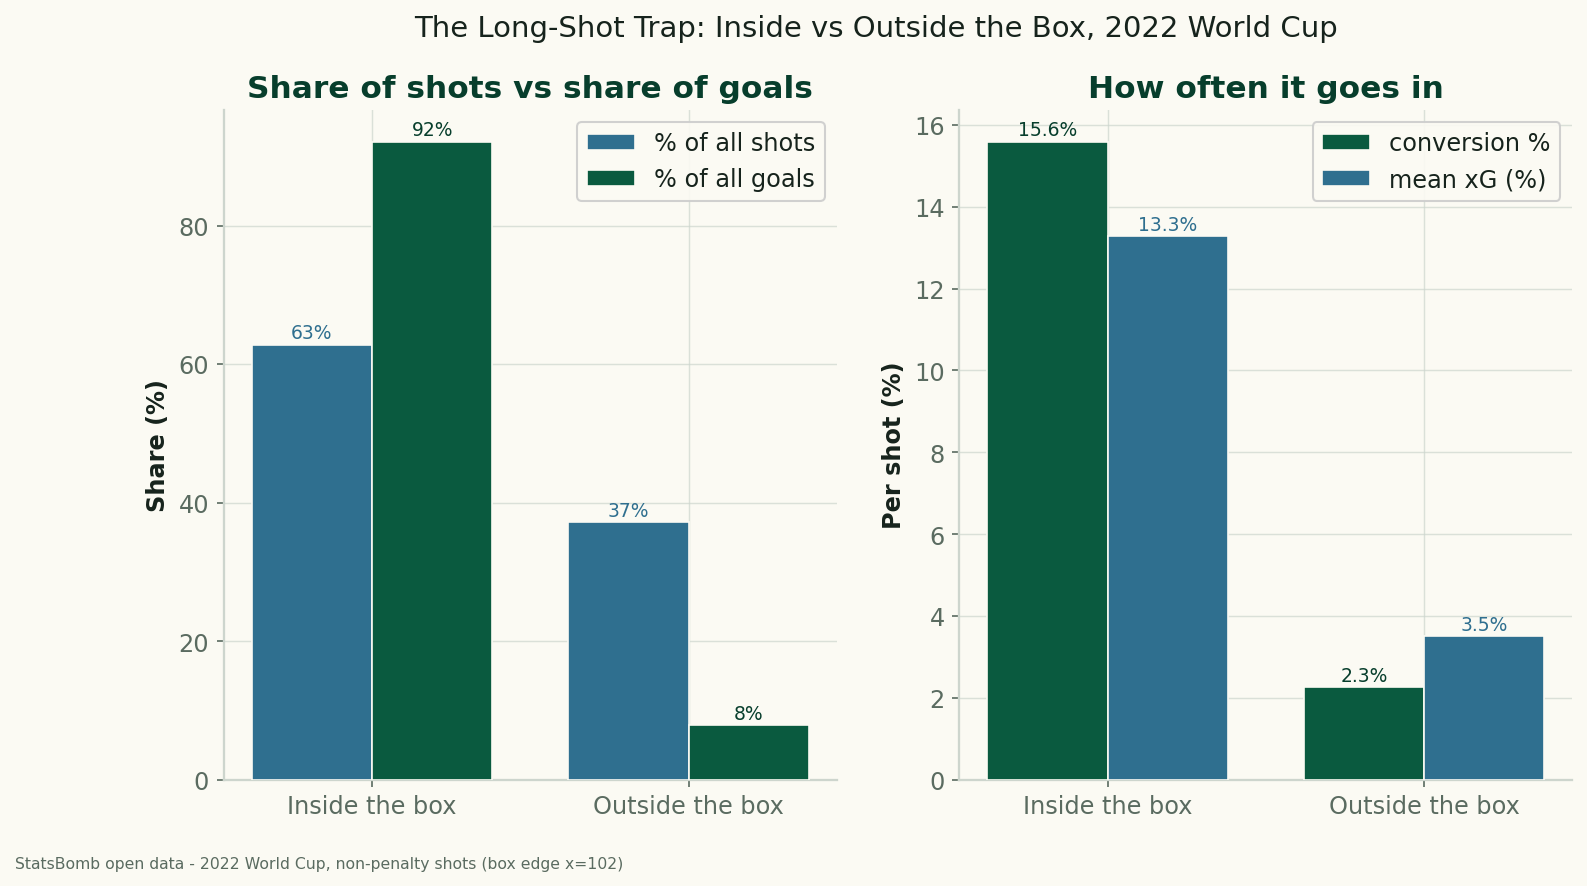
The Long-Shot Trap: Inside vs Outside the Box at the 2022 World Cup
Using StatsBomb data for all 64 matches of the 2022 World Cup, shots from outside the penalty box were 37% of all attempts but produced just 8% of the goals — a 2.3% conversion rate against 15.6% from inside. The data behind 'stop shooting from there.'
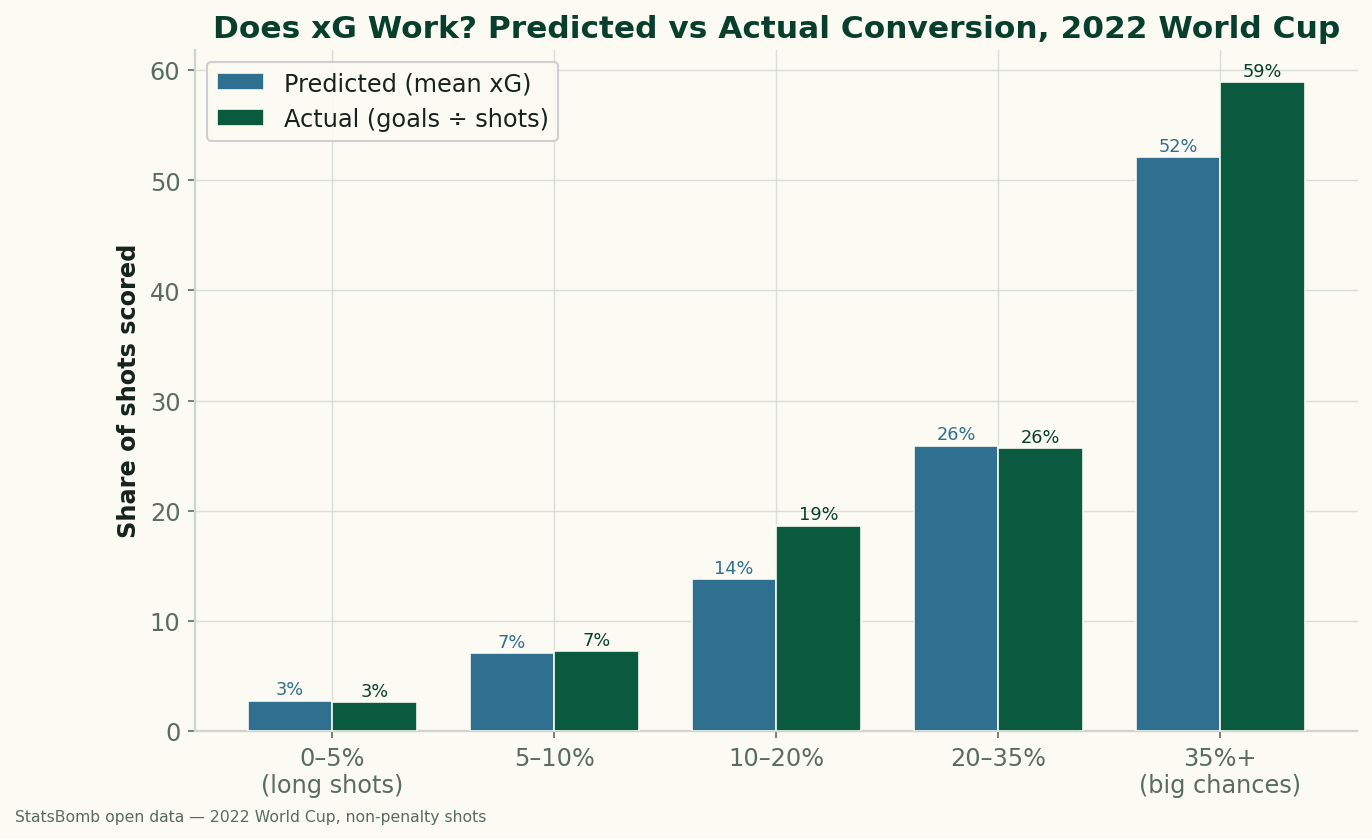
Does xG Actually Work? Big Chances vs Long Shots at the 2022 World Cup
We sorted every non-penalty shot from the 2022 World Cup by its expected-goals value and checked how often each band actually went in. xG holds up well: a 0–5% shot scored 2.6% of the time, a 'big chance' of 35%+ went in 58.9%. The calibration, and what a big chance is really worth.
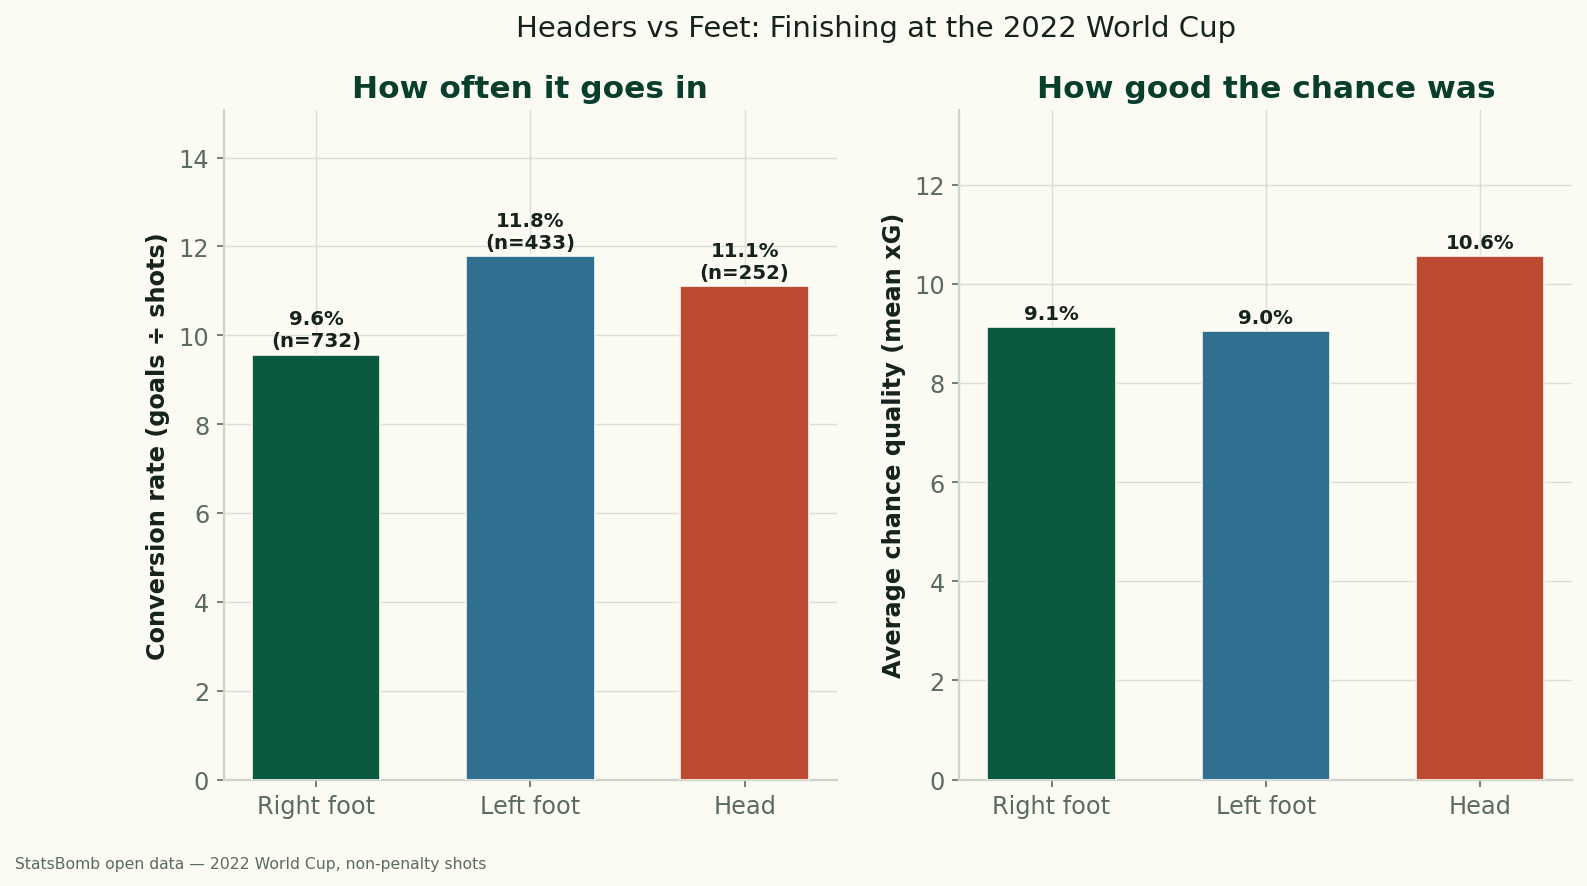
Headers vs. Feet: Which World Cup Shots Actually Go In?
Using StatsBomb data for all 64 matches of the 2022 World Cup, headers and feet convert at almost the same rate (11.1% vs 10.5%) — but only because headers come from higher-quality positions. Relative to chance quality, foot finishing beat the model, and the left foot was the most clinical of all.