The Groups Told the Truth: How June Predicted July at the 2026 World Cup
The third post-tournament deep dive asks whether the group stage was information or theater. The answer is emphatic — June's table predicted July's bracket about as well as anything in this dataset predicted anything — and it completes a puzzle the first retrospective left open.
After the knockout autopsy found that a month of goals-per-game form was nearly useless for picking knockout winners, a fair reader could conclude the group stage was three weeks of theater. The completed dataset says otherwise, loudly: group-stage points predicted knockout survival better than any per-game indicator predicted individual matches. The three teams that swept their groups all won their round-of-32 games. The eleven qualifiers who limped in on four points went 2-for-11. And the four teams left standing in the final week had finished the group stage ranked 1st, 2nd, 6th and 8th of the 32 qualifiers. June wasn’t theater. June was the bracket, drafted in pencil.
Sourcing. All numbers computed from our final 104-match dataset (ESPN feeds, served raw at /data/wc2026_results.json): group performance is points then goal difference across each qualifier’s three group games; knockout depth is elimination games played (round of 32 = 1, through the final weekend = 5). Chart script: charts/chart_wc2026_groups_bracket.py.
Survival by group-stage points
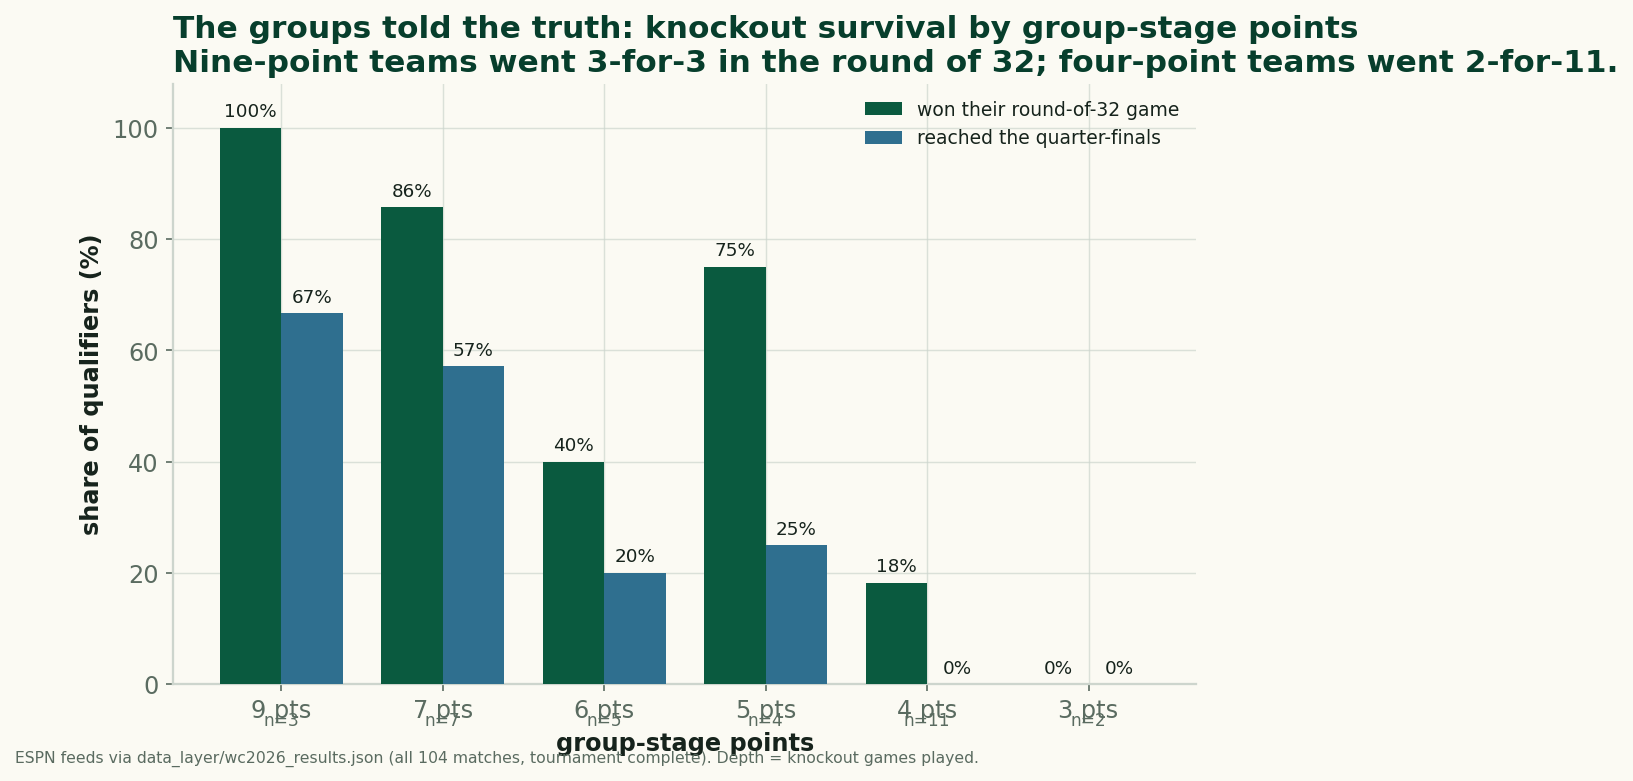
Read the two ends of that chart. The ten teams who took seven or more points from their groups went 9-for-10 in the round of 32 and supplied six of the eight quarter-finalists. The thirteen qualifiers on four points or fewer went 2-for-13, and none survived to the quarters. In between, the gradient behaves (the five-point band’s 75% is four teams — small-n wobble, flagged as such). Across all 32 qualifiers, the correlation between group-stage rank and knockout depth runs −0.64 — in a single-elimination format played by 32 different teams over two weeks, that is a remarkably loud signal.
The upset that mostly didn't happen
The bracket’s reputation is chaos; the file says otherwise. Of the thirteen round-of-32 games decided in regulation or extra time, only two were won by the team with the worse group-stage record. The knockouts’ famous randomness lived almost entirely inside the shootouts (three of them in that round alone) and in margins, not outcomes — the better June team overwhelmingly advanced, it just advanced by less as the rounds tightened. Even the tournament’s designated chaos agent obeyed the table: Norway, the counterpunching exception to every style indicator we tested, had quietly banked seven group points before it started ambushing anyone.
Reconciling the two retrospectives
So the first retrospective said form lies, and this one says the table doesn’t. Both are true, and the difference is the whole lesson. Goals per game — the number that failed at 64% — is a rate built on twelve-to-twenty scoring events, inflated unevenly by soft groups; it aged terribly as a per-match predictor. Group points are an outcome measure: nine points requires beating three different opponents on three different nights, and that robustness is exactly what survives into a knockout format. Meanwhile the autopsy’s winner — entering possession average — measured identity. Put the three findings together and the tournament’s information hierarchy is clean: what you won (points) predicted how far you’d go; who you were (possession) predicted individual matches; how much you scored predicted almost nothing.
The final four, backdated
| Team | Group pts | GD | June rank | July finish |
|---|---|---|---|---|
| France | 9 | +8 | 1 | 4th |
| Argentina | 9 | +7 | 2 | Runner-up |
| Spain | 7 | +5 | 6 | Champions |
| England | 7 | +4 | 8 | 3rd |
Two honest wrinkles in that table. Mexico — the third nine-point sweep — fell in the round of 16 (the 3–2 England escape), proof the pencil draft wasn’t ink. And the champion ranked only sixth in June: Spain’s group stage included the 27-shot 0–0 against Cape Verde that cost them two points while changing nothing about what they were. The table predicted the neighborhood of the outcome — all four semi-finalists from the June top eight — without calling the winner. That’s what good priors do.
Caveats, and what this means for 2030
The usual full-volume warnings: one tournament, 32 qualifiers, and bands with n=3 and n=4 in the tails — the −0.64 correlation would move with a different shootout bounce or two. Group points and knockout depth aren’t fully independent measurements of “quality” either — both partly reflect draw luck, and a soft group can pad points the way it pads scoring averages (though evidently far less: that’s the finding). And depth-by-games-played credits the bronze weekend equally for four teams — a design choice, stated.
The practical takeaway survives the caveats. When the 2030 groups end and the takes begin — “none of this matters, the real tournament starts now” — the 2026 file says the opposite: the group table was the single best forecast of the bracket available on the day the bracket began. Weight points over goals, identity over form, and expect the June top eight to supply your semi-finalists — while remembering that within that eight, the trophy went to the team ranked sixth. The hub collects the series; the retrospective queue has one more entry on it — what the 2026 file says about shootouts — before this dataset goes quiet for four years.
Sources
- All computations from
data_layer/wc2026_results.json(ESPN public feeds, all 104 matches, tournament complete), served at /data/wc2026_results.json; chart scriptcharts/chart_wc2026_groups_bracket.py. Group points/GD derived from the 72 group games; knockout depth from elimination games played. - The companion retrospectives this piece reconciles with: what predicted the knockouts (per-match indicators) and did expansion dilute it (margin structure).
- The World Cup hub collects the complete series.
More from World Cup 2026
The 2026 Dark-Horse Audit: Grading Our June Checklist
Six teams beat their group seed at the 2026 World Cup, scored against our pre-tournament checklist: the keeper box failed, the kind draw barely helped.
The Shootouts: Rarer, Earlier, and a Reprieve That Never Lasted
Retro #4 closes the series: the shootout rate fell to 12.5% of knockout games from 2022's 31%, all four came early, and survivors went 1-3 next time out.
The 2026 World Cup, By the Numbers: Just Under 3 Goals a Game
The 2026 World Cup, by the numbers from completed matches only: goals per game vs 2022, draws, and blowouts. The final numbers, across all completed matches.