Headers, Measured: The Geography of the World Cup's Aerial Shot
The header is the most geographically constrained shot in football — it lives inside twelve yards, arrives mostly from dead balls, and finishes high. But the set-piece header, the sport's most rehearsed aerial moment, converted worst of all.
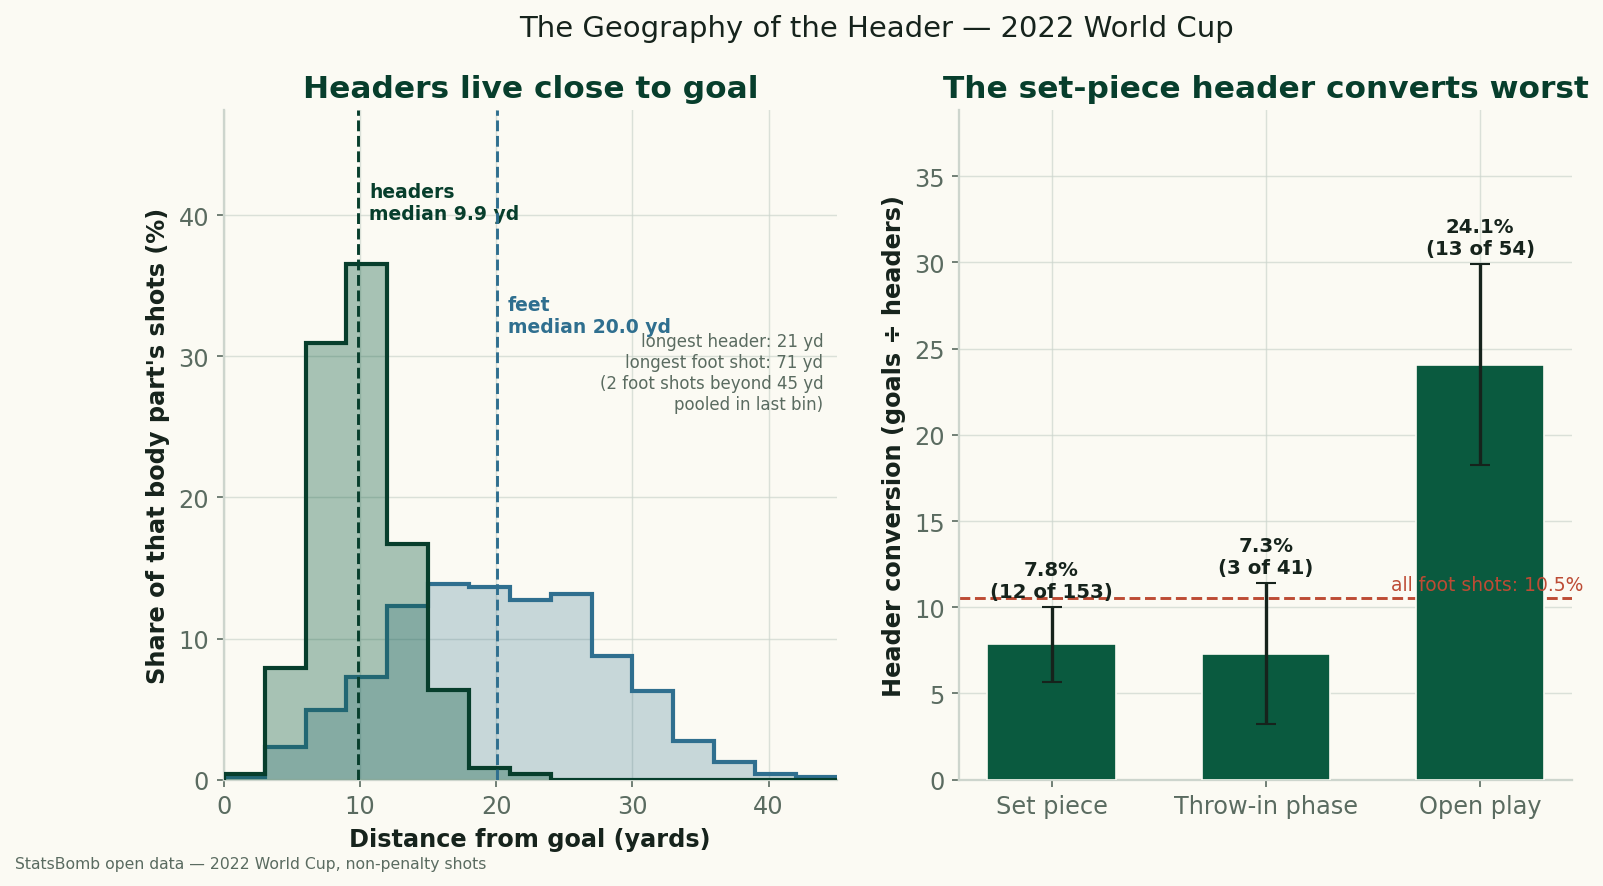
The 2026 series is finished and closed, so this site returns to what it does between tournaments: mining the richest public dataset it has, one question at a time. Today's question is the header — the only shot in football that cannot be attempted from anywhere, because it exists only where a ball in the air and a forehead can meet. That single constraint shapes where it happens, how it arrives, and what it's worth. So we measured it, across all 1,494 shots of the 2022 World Cup — and the sharpest finding is which kind goes in. The set-piece header, the most rehearsed aerial moment in the sport, converted at 7.8%. The open-play header converted at 24.1%.
Sourcing. Every figure is computed from StatsBomb's free, public event data for all 64 matches of the 2022 World Cup, bundled here as data_layer/wc2022_shots.json. Penalties are excluded throughout — all 64 of them are foot shots and they convert at a rate all their own (43 went in), so leaving them in would distort every body-part comparison. That leaves 1,430 non-penalty shots and 152 goals. Nothing is from memory or invented.
A shot on a 21-yard leash
Start with the constraint itself, because the numbers are more extreme than intuition suggests. The median header was taken 9.9 yards from goal; the median foot shot, 20.0 yards — double. Just over half of all headers (52%) came from within 10 yards, versus 9.8% of foot shots; three-quarters (75.8%) from within 12. Of the tournament's 252 headers, 251 were taken inside the penalty area — a single header, all World Cup long, came from outside the box, and the longest was struck from 21 yards, while foot shots ranged out to 71. The header also over-occupies the most valuable turf on the pitch: 18.7% of headers were taken inside the six-yard box, against 5.9% of foot shots.
This is why headers carry high xG per attempt and why, as we found when comparing headers and feet as finishing tools, they convert about as often as foot shots (11.1% to 10.5%) while merely matching their expected goals. The header isn't efficient because foreheads are precise; it's efficient because physics only permits it close to goal, where every shot is good. Plotted on the shot-location map, headers would all crowd into its hottest zone.
Delivery is destiny
Where do they come from? StatsBomb tags every shot with the play pattern that began the possession — the same field behind the breakdown of how 2022's goals originated — and for headers the answer is overwhelmingly: a dead ball. Corners and free kicks supplied 153 of the 252 headers, 60.7%; throw-in phases added another 16.3%. Barely a fifth (21.4%, 54 attempts) arose in open play, and just four on the counter. Foot shots are the mirror image: only 30.1% trace back to a corner or free kick.
Put the two facts together and the header's identity is complete: a shot taken ten yards out, off a rehearsed delivery into a crowd. Which invites the natural assumption — that the set-piece header, drilled on every training ground on earth, is the productive kind. That assumption is what the data breaks.
The conversion flip
Group the 252 headers by origin and convert each bucket. Set-piece headers: 12 goals from 153, 7.8% (standard error ±2.2 points). Throw-in-phase headers: 3 of 41, 7.3% (±4.1). Open-play headers: 13 of 54, 24.1% (±5.8). The open-play header converted at three times the rate of the set-piece header — a 16-point gap, about 2.6 combined standard errors, and better than any comparably sized origin-and-body-part group in the tournament, foot shots on the counter (19.2%) included.
Chance quality explains only part of it. The average open-play header carried 0.127 xG, the average set-piece header 0.098 — better, but nothing like three-fold. The rest shows up in the xG ledger: open-play headers scored 13 goals from just 6.9 expected, nearly double the model; set-piece headers scored 12 from 14.9 expected, three under. The mechanism is easy to picture. A corner is headed against a set defense — a packed six-yard box, a keeper on his line, markers attached — exactly the congestion that drags all set-piece conversion below open play. An open-play header arrives against a defense in motion: a cross behind a turning back line, a cut-back nodded in at the far post. Same body part, radically different circumstances.
Now the honesty. Fifty-four shots and thirteen goals is a small sample, and that ±5.8 is doing real work — the true open-play rate could plausibly sit in the mid-teens, and the +6 over xG will not repeat every tournament. The direction of the gap is a fair bet, since the congestion mechanism predicts it and the error bars clear it; its size is not. And nobody should read this as “stop practicing corners” — volume, as ever, is the set piece's argument.
Headers finish high
One more signature, at the other end of the shot. StatsBomb records the height at which on-frame attempts cross the goal line (end_z, against a crossbar at about 2.67). As the goal-mouth map in where World Cup players aim showed, finishing overall lives low — 52% of all goals crossed the line in the bottom third, and the median foot shot arrived at 1.20. Headers invert that. The median header arrived at 1.70; only 15.8% arrived low, versus 40.1% of foot shots, while 49.5% arrived in the top third. Even among goals alone, just 32% of headed goals went in low against 56% of foot goals, with median heights of 1.15 and 0.60.
Every coach who ever shouted “head it down!” may be right about intent — the data sees only where the ball ended up, not where it was aimed. But as a matter of record, the header is football's high finish: a ball met at forehead height, eight yards out, tends to stay near forehead height.
The takeaway
Measured, the header is three superlatives in one shot: the closest-range shot in football (median ten yards, effectively never outside the box), the most delivery-dependent (over three-quarters arrive from corners, free kicks, and throw-in phases), and the highest-finishing — the one class of goal that routinely beats keepers above the waist, worth remembering alongside what keepers actually save. The surprise is the flip inside the origin split: the rehearsed header is the low-percentage one, and the header that ends a flowing move is, per attempt, among the deadliest shots the 2022 World Cup produced. Small n, honestly flagged — but the geography is not going anywhere.
Reproduce it
From data_layer/wc2022_shots.json, drop penalties, split by body_part, and compute distance from each shot's x/y to the goal at (120, 40). Group headers by play_pattern into set piece (corner / free kick), throw-in phase, counter, and open play; conversion is goals ÷ shots with binomial standard errors √(p(1−p)/n). Placement uses end_z where recorded, in thirds of the 2.67 crossbar. Every number above, and the two-panel figure, is recomputed end to end by charts/chart_wc2022_headers.py. No network at build time, nothing hand-entered.
The data behind this piece
- Shot, body-part & play-pattern data: StatsBomb open data (free public dataset; attribution required), FIFA World Cup 2022, all 64 matches, bundled as
data_layer/wc2022_shots.json. Data provided by StatsBomb. - Companion: headers vs. feet as finishing tools · how goals originate · where players aim.
- Concept: aerial duels and heading data · the World Cup hub.
More from Data Deep-Dives
Does Europe Cost English Clubs at the Weekend? Three Seasons Can't Find It
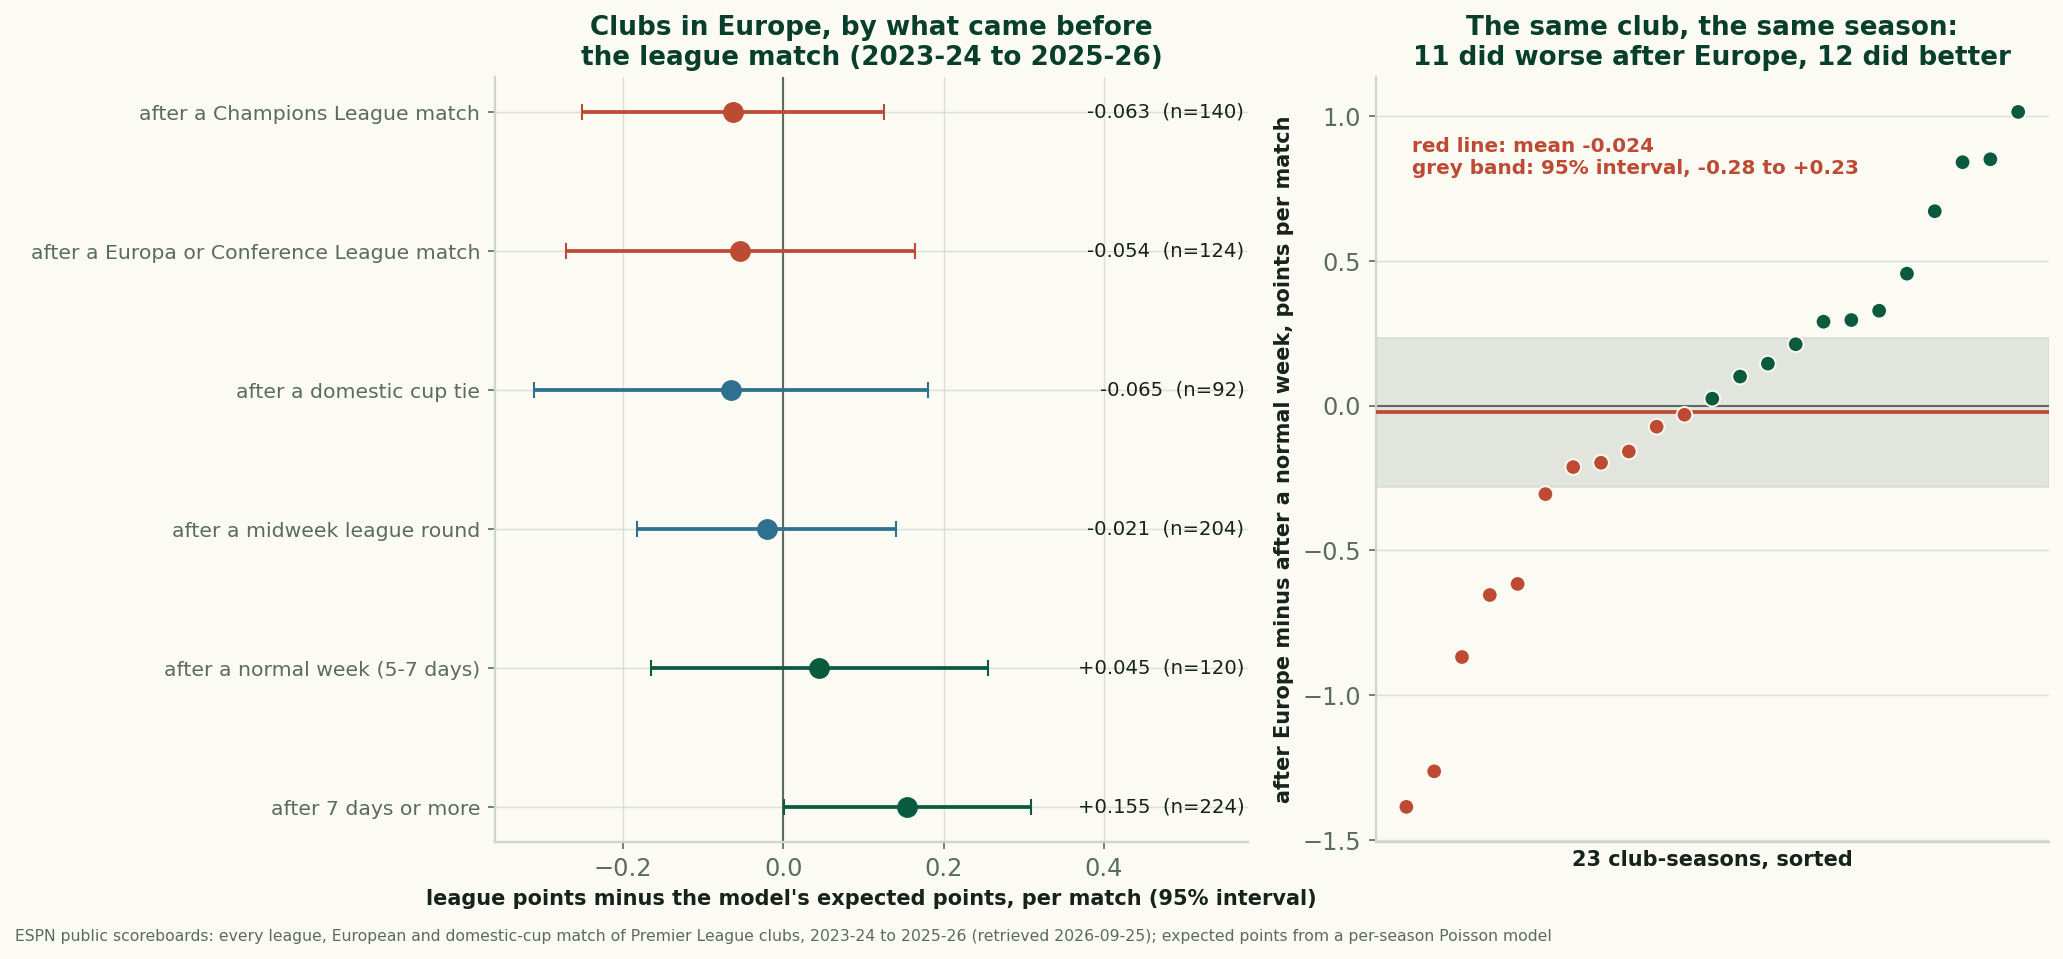
After a European night, English clubs took 1.56 league points a match against 1.62 expected. Within the same club and season the gap is -0.024: not measurable.
Manchester United Lead the League in Shots and Sit Twelfth
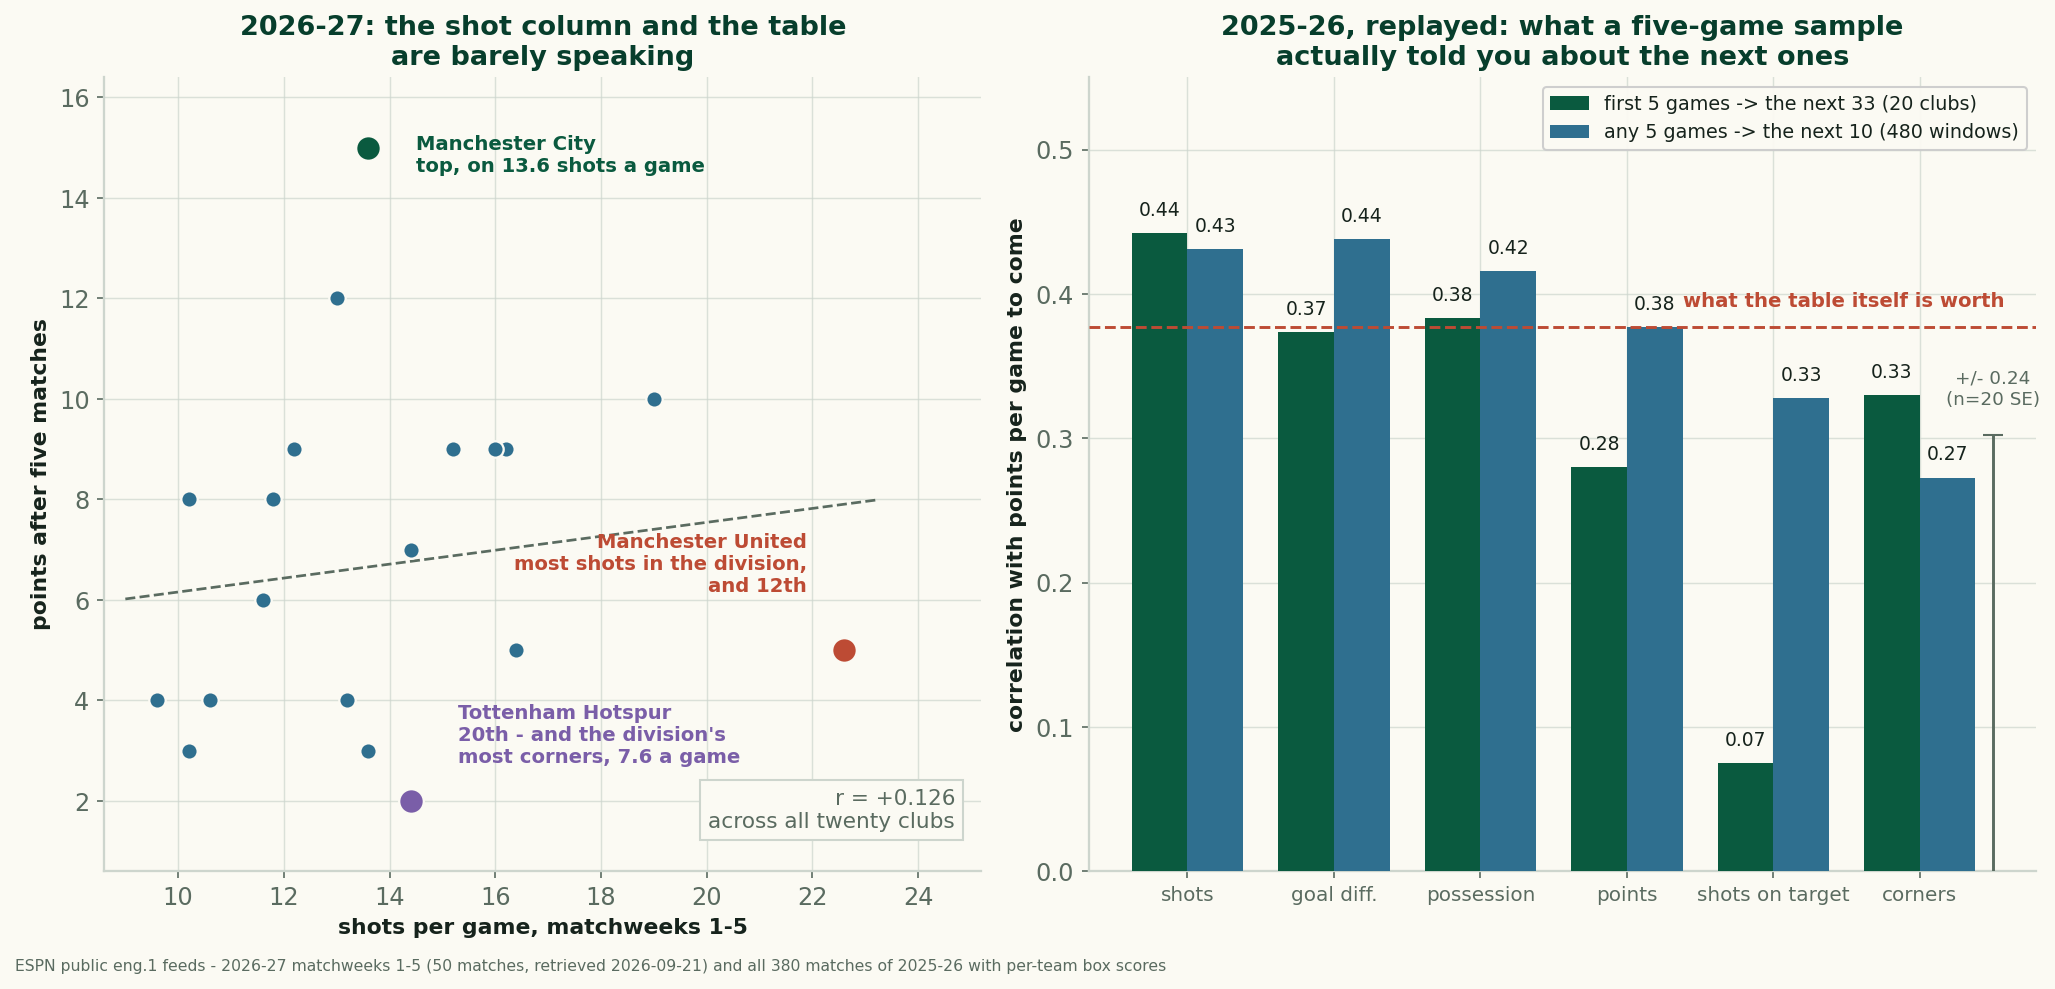
United take 22.6 shots a game and have 5 points. Across 2025-26, a club's five-game shot count predicted its next results better than its points did.
Home Advantage Didn't Die. The Results Column Can't See It
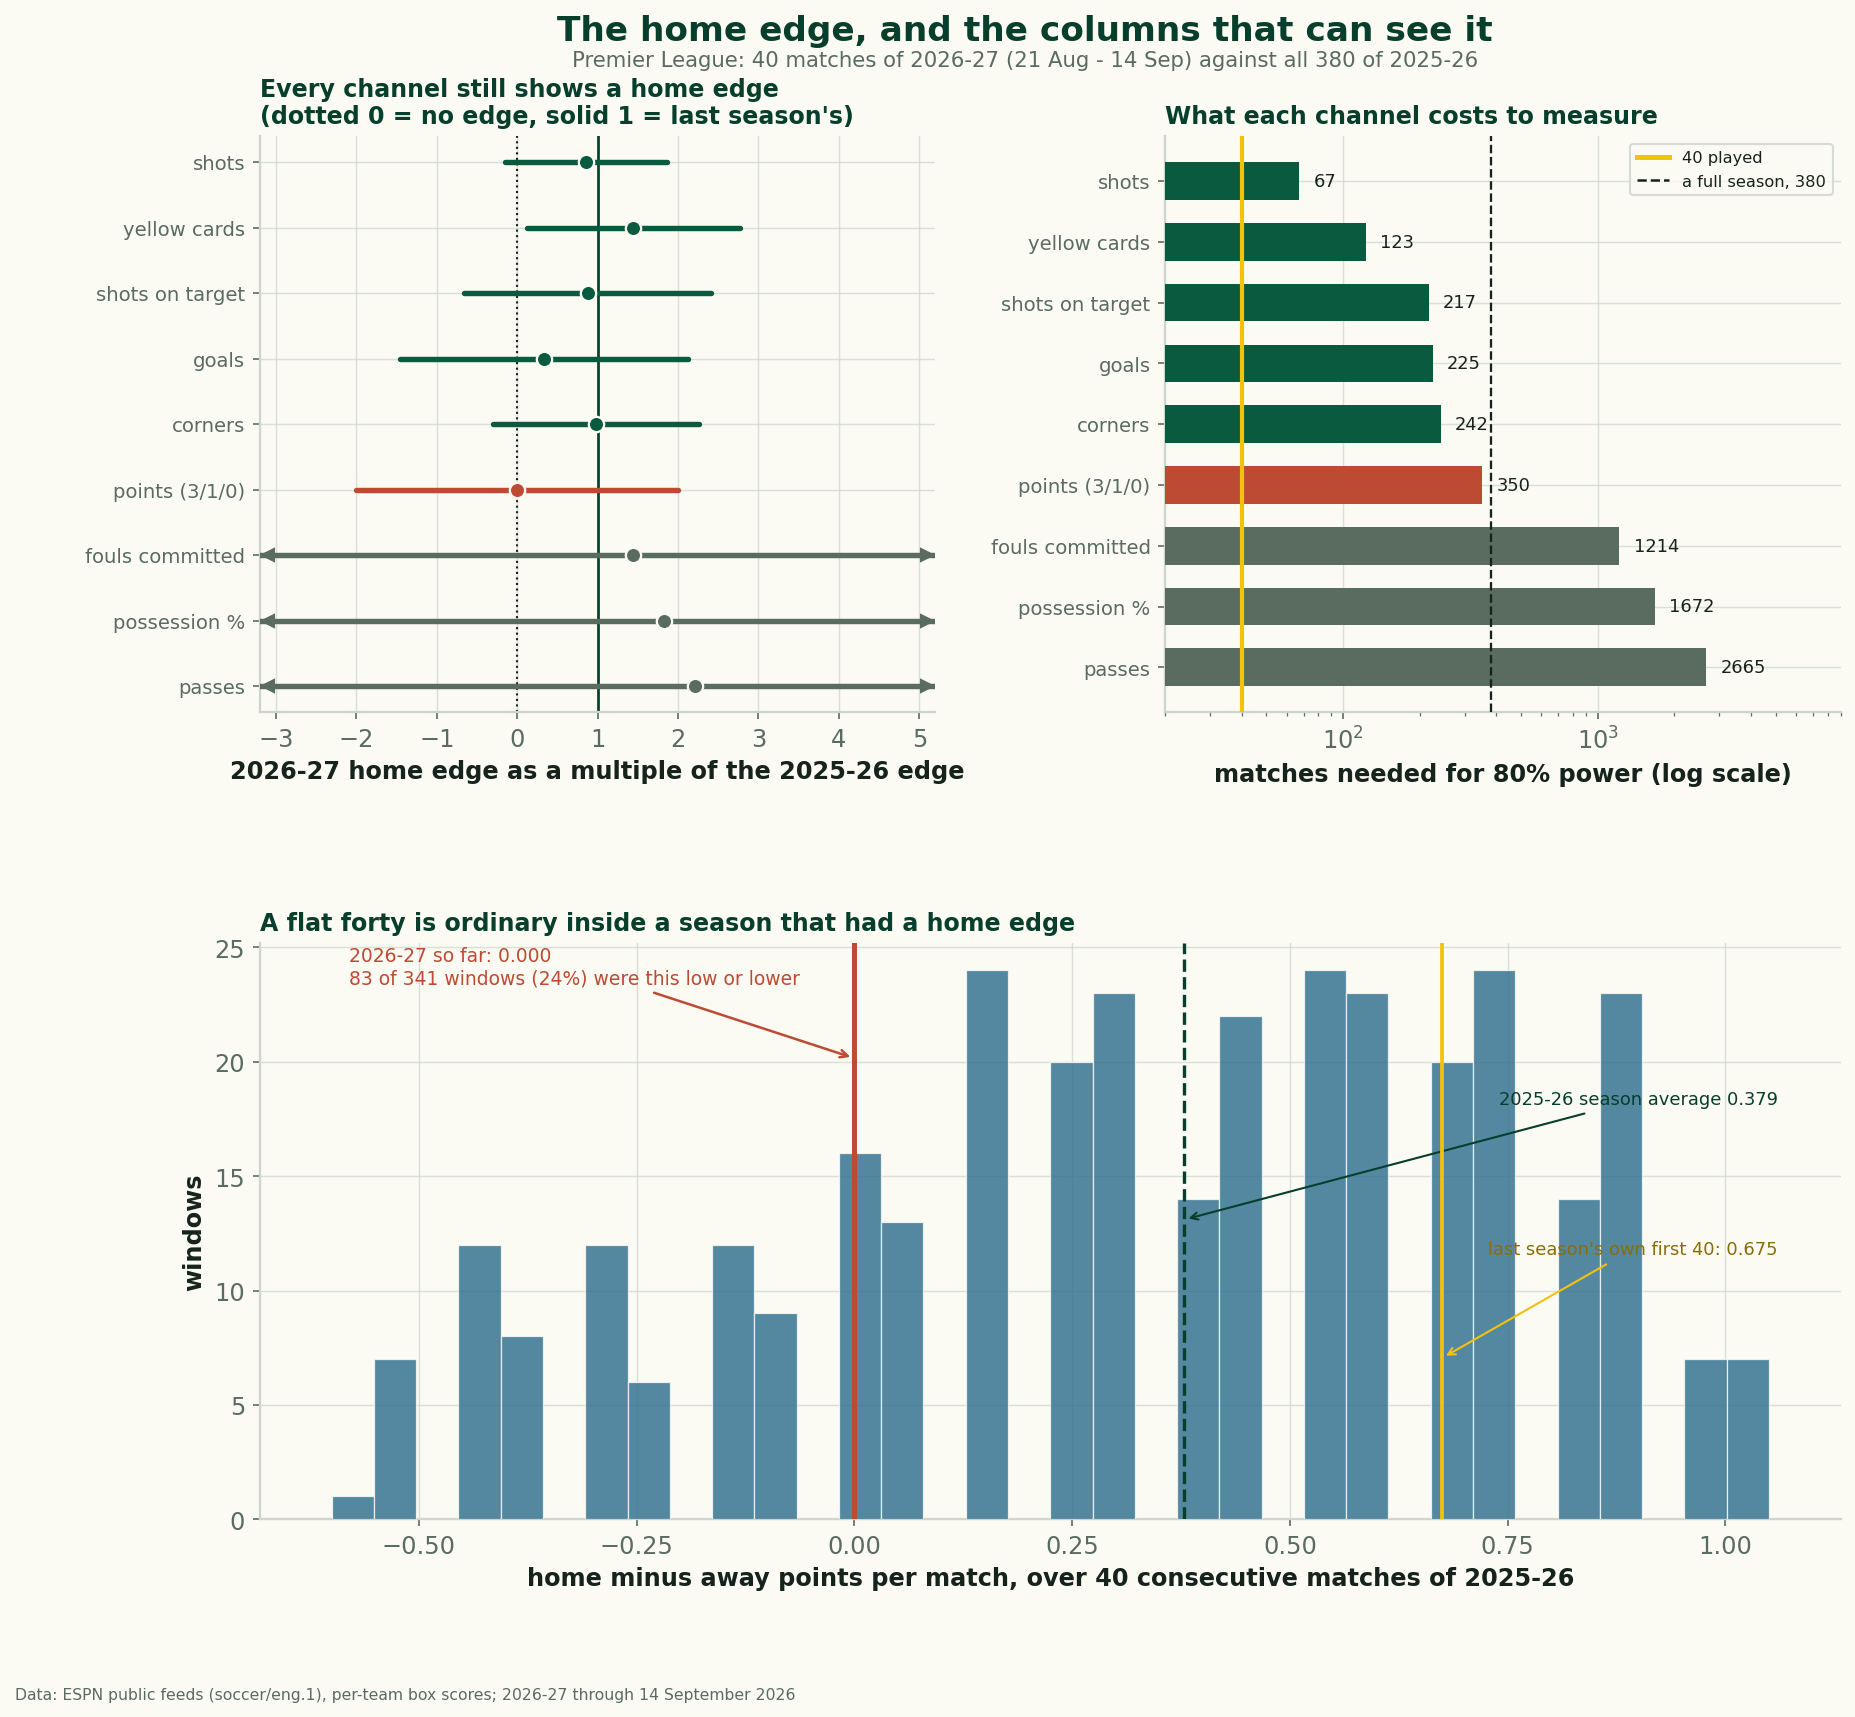
Home and away split the first 40 matches of 2026-27 evenly, yet the shot, corner and card columns keep the home edge. Plus a decade of home-advantage data.