The Shots-on-Target Rule
The World Cup series' signature pattern, promoted to its definitive statement — the full 80-game ledger, all ten exceptions named, why the number carries signal, and the 380-game trial that kicks off August 21.
Over five weeks of 2026 World Cup coverage, one pattern earned a name on this site: the shots-on-target rule. Stated precisely — in games that produce a winner, the winning team almost always matched or beat its opponent on shots on target. The series tracked it live, round by round; this piece is its definitive statement, recomputed from scratch against the final dataset. The full ledger: across all 80 decided games of the tournament, the winner matched or beat the loser on target 70 times — 87.5%. In the knockouts, the games with the highest stakes and the tightest margins, it held in 24 of 28 (86%). And starting August 21, the rule faces something the World Cup could never give it: a 380-game out-of-sample test.
Sourcing. Every number here was recomputed for this piece from the bundled tournament dataset — all 104 completed matches with per-team box scores from ESPN's public scoreboard and summary feeds, served raw at /data/wc2026_results.json so you can rerun the count yourself. Draws are excluded by construction (the rule speaks only to games with a winner), and the four knockout games settled by penalty shootout are recorded at their post-extra-time level score, so they sit outside the ledger too. Following the site convention, the first 72 completed matches are the group stage; the remaining 32 are knockouts. Every decided game in the file carries both teams' on-target counts — the denominators below exclude nothing else.
The ledger, in full
| Phase | Decided games | Winner had more SoT | Level on SoT | Winner had fewer | Matched-or-beat |
|---|---|---|---|---|---|
| Group stage | 52 | 41 | 5 | 6 | 46 of 52 (88.5%) |
| Knockouts | 28 | 22 | 2 | 4 | 24 of 28 (85.7%) |
| Full tournament | 80 | 63 | 7 | 10 | 70 of 80 (87.5%) |
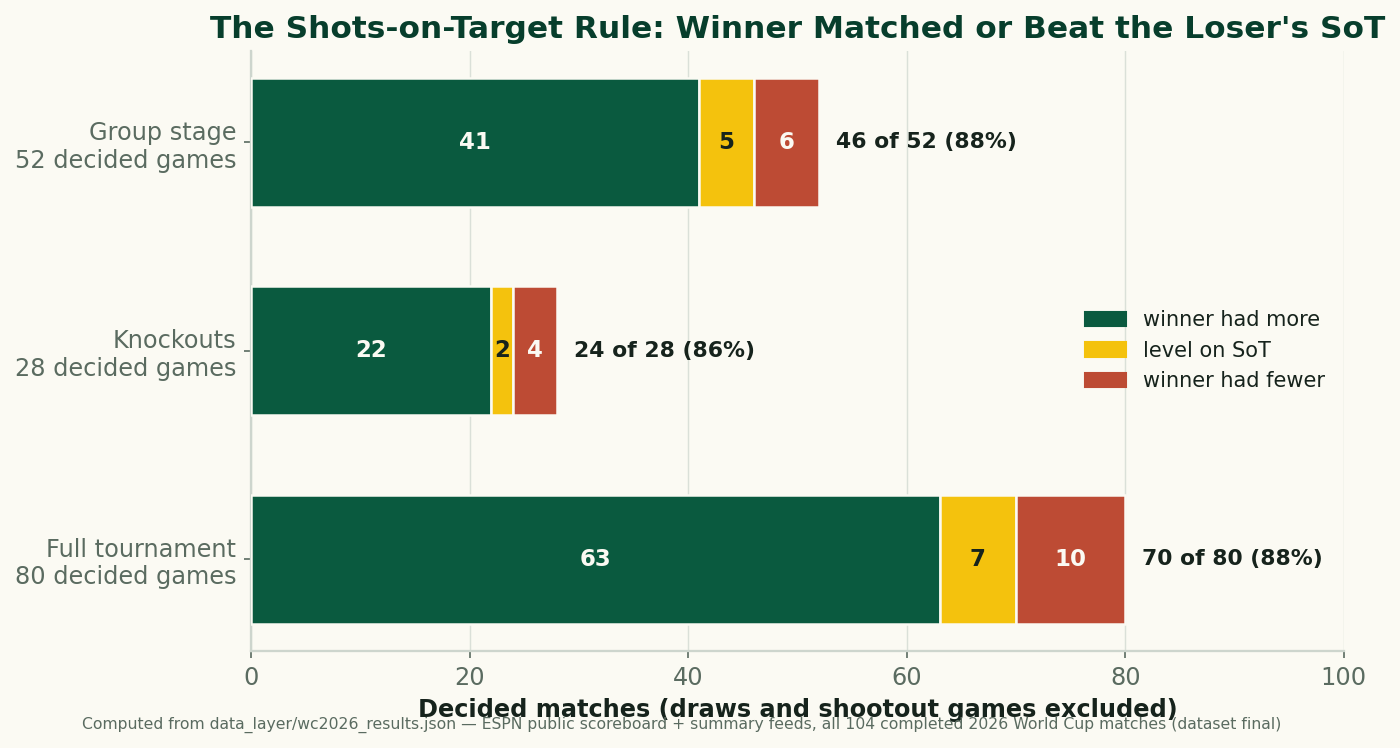
charts/chart_wc2026_sot_rule.py; ESPN public feeds, dataset final.Two things are worth noticing before we celebrate. First, the rule barely weakened when the competition did its ruthless narrowing: 88.5% in the group stage, 85.7% in knockouts — win-or-go-home football, which bends most group-stage patterns (scoring rates included), left this one essentially intact. Second, the “matched” clause is doing honest work but not heavy lifting: only 7 of the 70 rule-conforming wins came from teams merely level on target. The strict version — winner had outright more — still covers 63 of 80 decided games (79%).
How it was tracked, before it was a rule
This is not a pattern discovered after the fact and dressed up as a prediction. The paper trail runs through the whole series. Nineteen days into the tournament, the what-wins-games snapshot found the team with more shots on target had won 16 of the 19 decided games where the counts differed — while possession was calling barely two in three. The quarter-finals wrap logged the rule running eleven straight decided knockouts. The final's data autopsy closed the books at 24 of 28 — Spain's 12–0 on-target scoreline in the final itself being, as that piece put it, the least suspenseful application of the rule all month. And the post-tournament predictors table ran the strict variant (ties thrown out): 22 of 26, the best in-game indicator in the entire feed. The recomputation for this piece reproduces every one of those figures from the raw file.
The ten exceptions, all named
A rule is only as honest as its casualty list, so here is every decided game the winner took while behind on shots on target. In the group stage: Australia 2–0 Türkiye (4 SoT to 8), Ghana 1–0 Panama (2 to 4), Paraguay 1–0 Türkiye (2 to 5), Netherlands 5–1 Sweden (7 to 8 — yes, a four-goal winner out-shot on target), Switzerland 2–1 Canada (4 to 7), and Türkiye 3–2 United States (3 to 7). In the knockouts: Norway 2–1 Ivory Coast (4 to 5), United States 2–0 Bosnia-Herzegovina (2 to 3), Portugal 2–1 Croatia (3 to 6), and Spain 2–0 France in the semi-final (2 to 3).
The list has texture. Türkiye appears in three of the ten — twice losing while ahead on target, once winning while behind — the tournament's designated chaos agent by this metric. Three of the four knockout exceptions were one-shot margins (4–5, 2–3, 2–3), games where the “rule” missed by the width of a single save. Only Portugal–Croatia (3 to 6) and the Netherlands' 5–1 (7 to 8) look like genuine defiance: clinical finishing beating volume. Which is the exception that explains the rule — more on that now.
Why shots on target carry signal
The mechanism is not mysterious, and it's worth separating the two honest halves of it. The kind half: a shot on target is a filtered shot. Total shots count hopeful 30-yarders into the wall; on-target attempts have already survived a quality check — they forced a save or scored. That's the same logic that makes expected goals work: weighting chance quality beats counting attempts, and on-target is the crudest useful quality weight a public box score carries. The what-wins-games piece owns the correlation numbers on this dataset — shots on target tracked goals far more tightly than possession or shot volume did, and we'll point you there rather than re-derive them — but the ordering it found (target beats shots beats possession) is exactly what the filtering account predicts. The finishing retro shows the other side: teams converting a level of on-target pressure well above or below the norm, which is where the exceptions live.
The skeptical half: shots on target is measured during the game, so part of what it “predicts” is simply a description of the match that already happened. Good teams generate on-target volume and win because they're good; game state adds its own distortion, since a team protecting a lead stops shooting by choice. The rule is a strong regularity, not a causal lever — you cannot aim wide shots slightly better and bank 87.5% of victories.
What about 2022?
We would genuinely like to show you the same ledger for the 2022 World Cup, and we can't — honestly. The 2022 data bundled on this site (StatsBomb Open Data) is a results file: all 64 scorelines, no per-team box scores, plus event data for the final alone. Reconstructing shots on target for 64 matches from event streams this site hasn't bundled would mean quoting numbers you can't verify against a served file, and that's not how this works. So the rule's evidence base is, for now, exactly one tournament wide — which is precisely why it needs what comes next.
The honest limitations
- The samples are small. 28 decided knockout games is a coin-flip's shadow; even 80 games is one tournament, one style era, one refereeing regime. An 87.5% hit rate on 80 games is strong evidence of a real tendency, not a law of physics.
- Matching is a generous clause. The headline stat counts ties on SoT as rule-conforming. The strict more-SoT-wins version runs 63 of 80 (79%) — still commanding, but quote the version you mean.
- Draws are excluded by construction. The rule says nothing about the 24 of 104 games (23%) that finished level, including all four shootouts. A stat that only speaks when there's a winner is a conditional claim, and conditioning on the outcome always flatters a metric.
- Matching isn't causing. Quality, game state and score effects all flow into on-target counts; this is a regularity worth updating your priors on, not a coaching lever.
- One provider. On-target judgments differ slightly between data providers; this ledger is ESPN's count, checkable against the served file, no more.
The live test: 380 games, starting now
A rule built on one tournament deserves a trial it didn't grow up in. The 2026-27 Premier League kicks off on August 21 — 20 clubs, 380 games, a stable league where the mismatches, the weather, and the stakes look nothing like a summer World Cup. From the first completed round, this site's new Premier League season ledger scores every decided match against the rule, using the same feed, the same match-or-beat definition, and the same completed-matches-only discipline as the World Cup coverage. If the rule is a World Cup quirk, a season of league football will expose it; if 85-plus percent survives 380 games, it stops being a pattern and starts being a property of the sport. Either answer is worth having, and the ledger will report the one the data delivers.
Sources & further reading
- Dataset: /data/wc2026_results.json — ESPN public scoreboard + summary feeds, all 104 completed 2026 World Cup matches with per-team box scores (dataset final). Ledger chart:
charts/chart_wc2026_sot_rule.py. - The series that tracked it: what actually wins games (owns the correlations), the quarter-finals wrap, the final by the numbers, and what predicted the knockouts (the strict 22-of-26 variant).
- The mechanism: expected goals, explained and post-shot xG and goalkeeper metrics — what on-target volume is a crude proxy for.
- The out-of-sample trial: the 2026-27 Premier League, by the numbers — the rule's running EPL ledger, updated as matches complete.
- 2022 context: inside the 2022 World Cup — and why a 2022 SoT ledger isn't computable from the data bundled here.
More from Data Deep-Dives
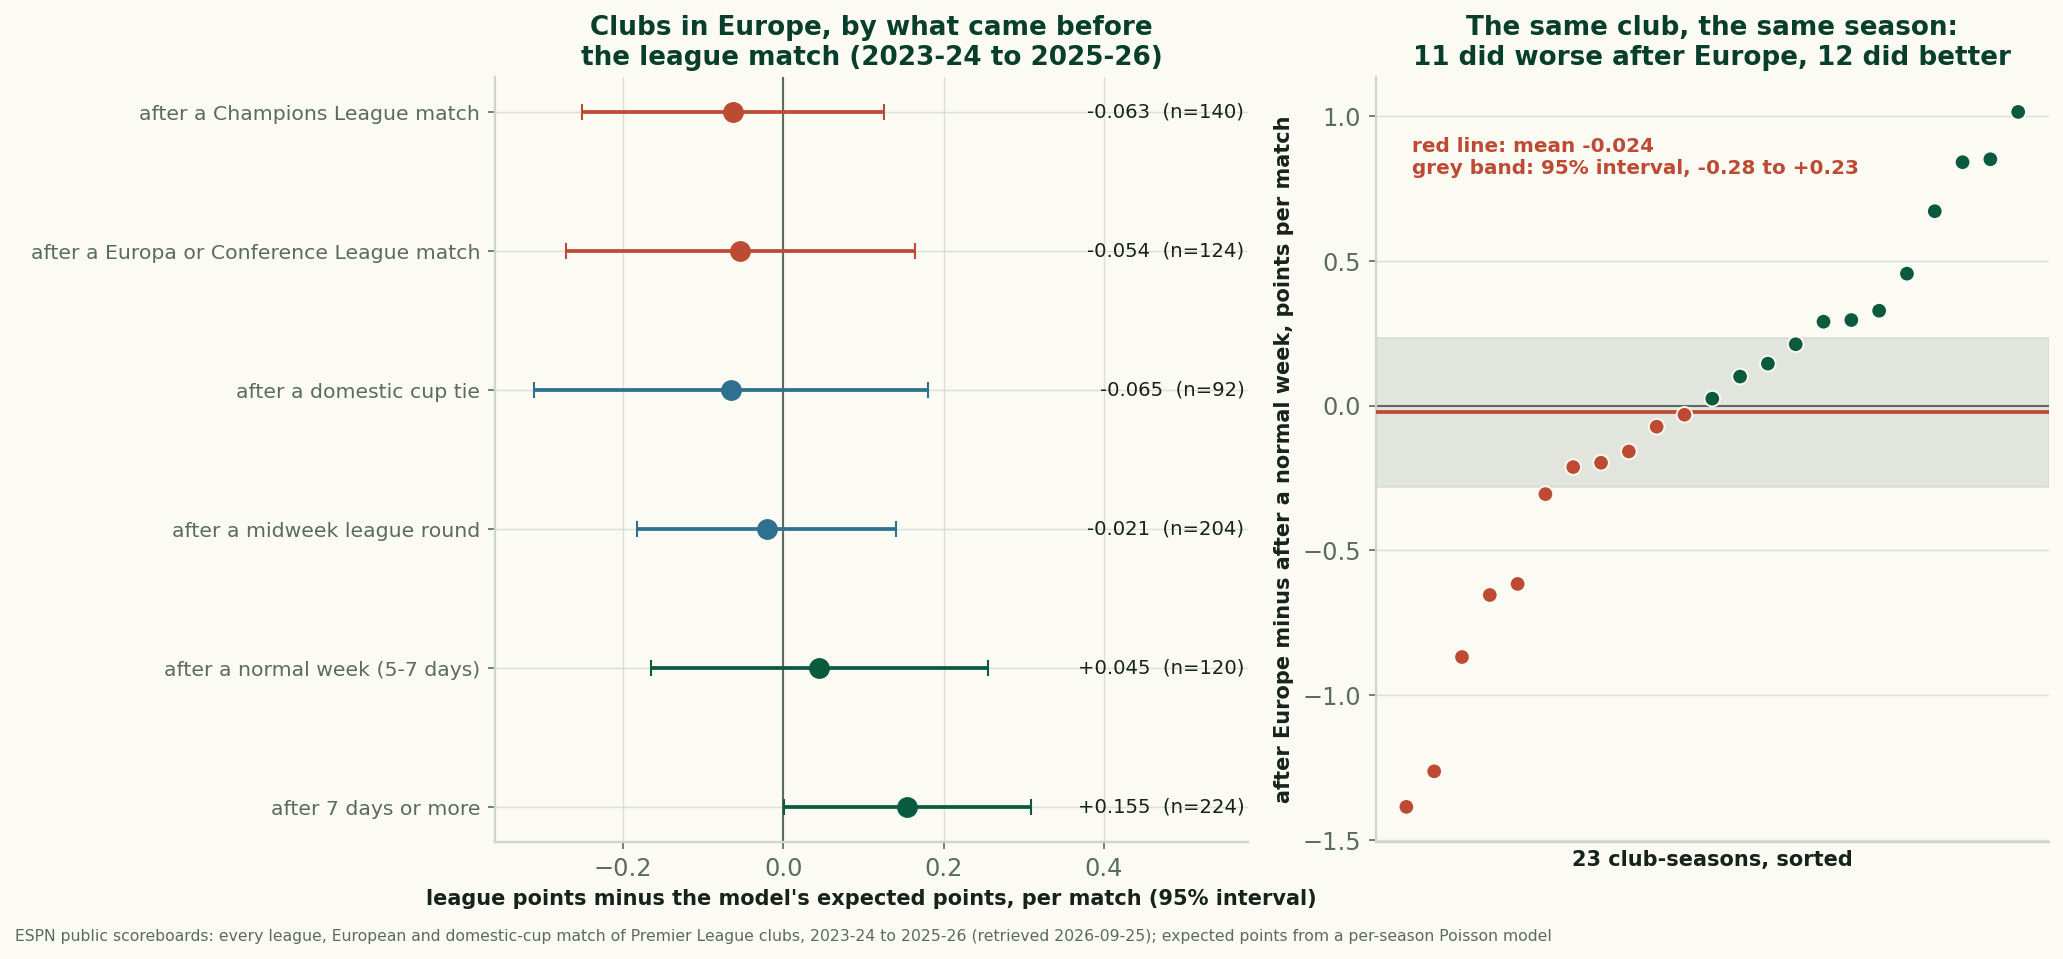
Does Europe Cost English Clubs at the Weekend? Three Seasons Can't Find It
After a European night, English clubs took 1.56 league points a match against 1.62 expected. Within the same club and season the gap is -0.024: not measurable.
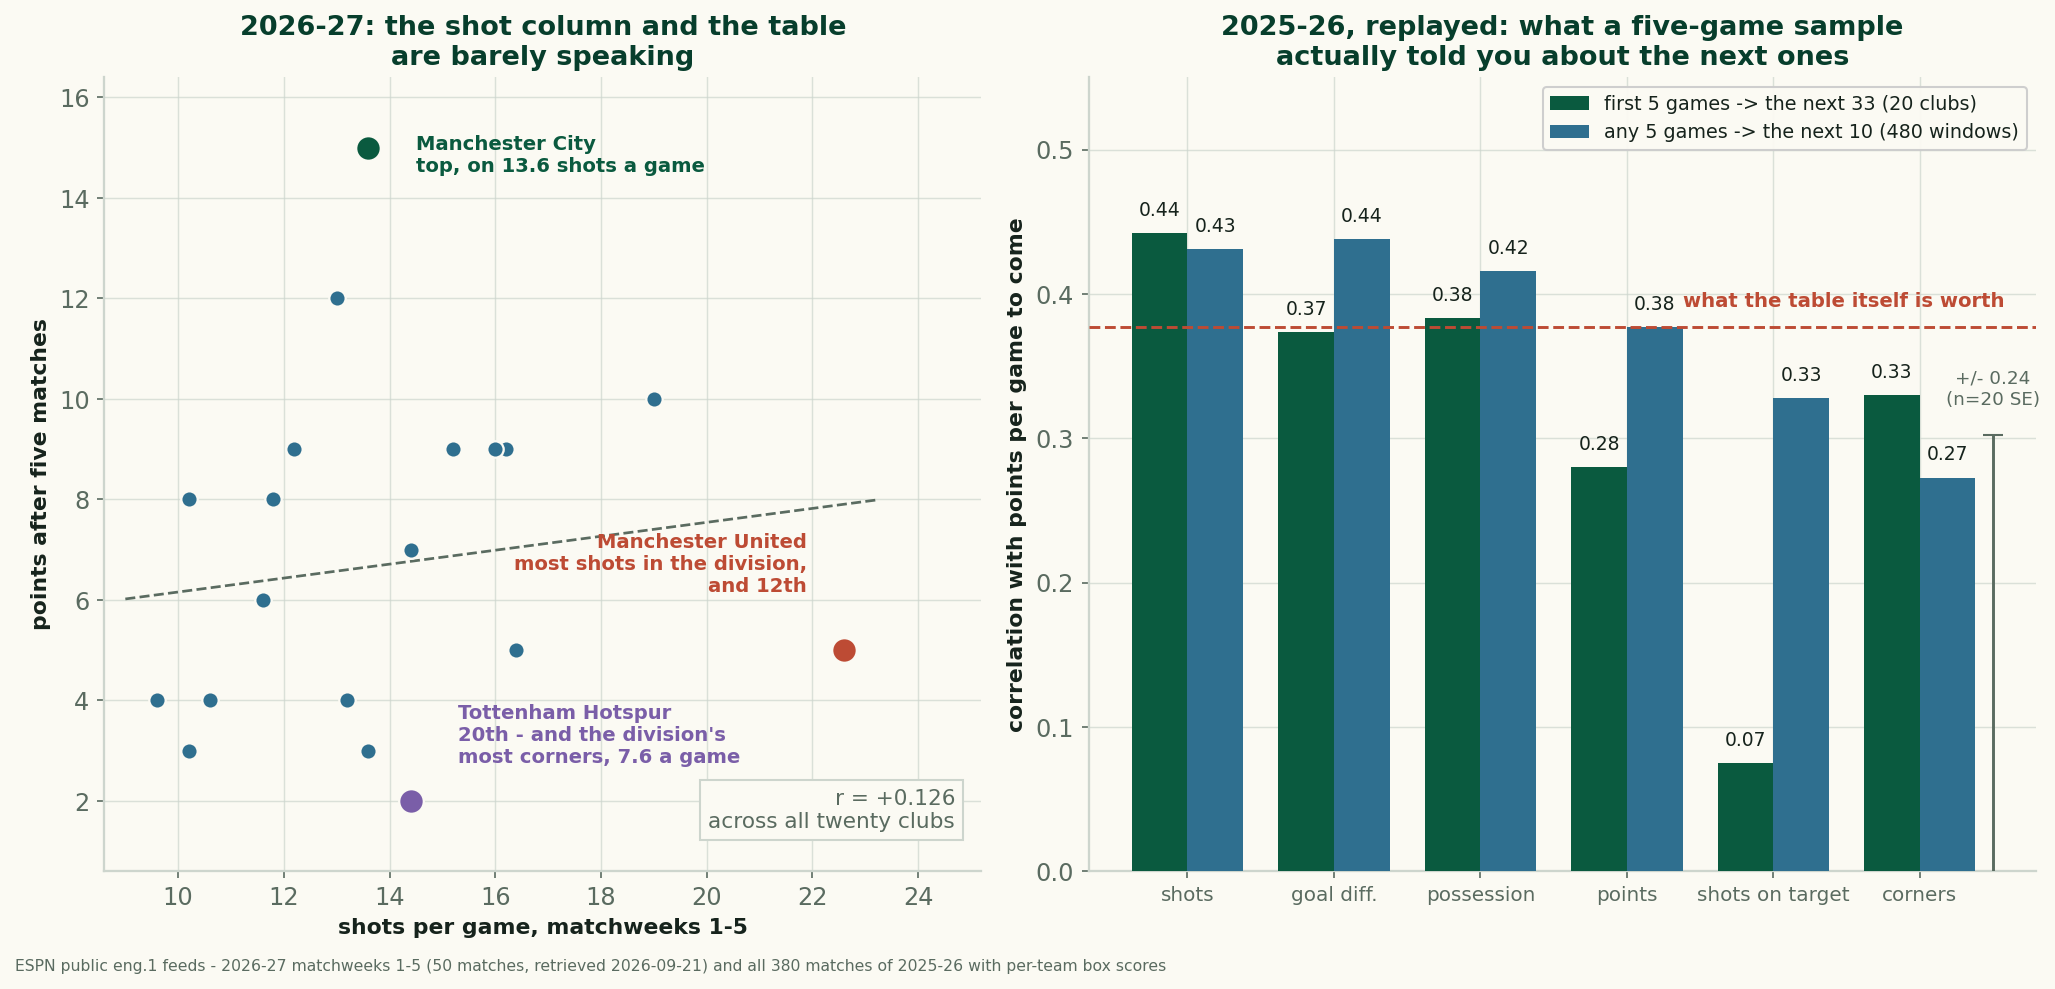
Manchester United Lead the League in Shots and Sit Twelfth
United take 22.6 shots a game and have 5 points. Across 2025-26, a club's five-game shot count predicted its next results better than its points did.
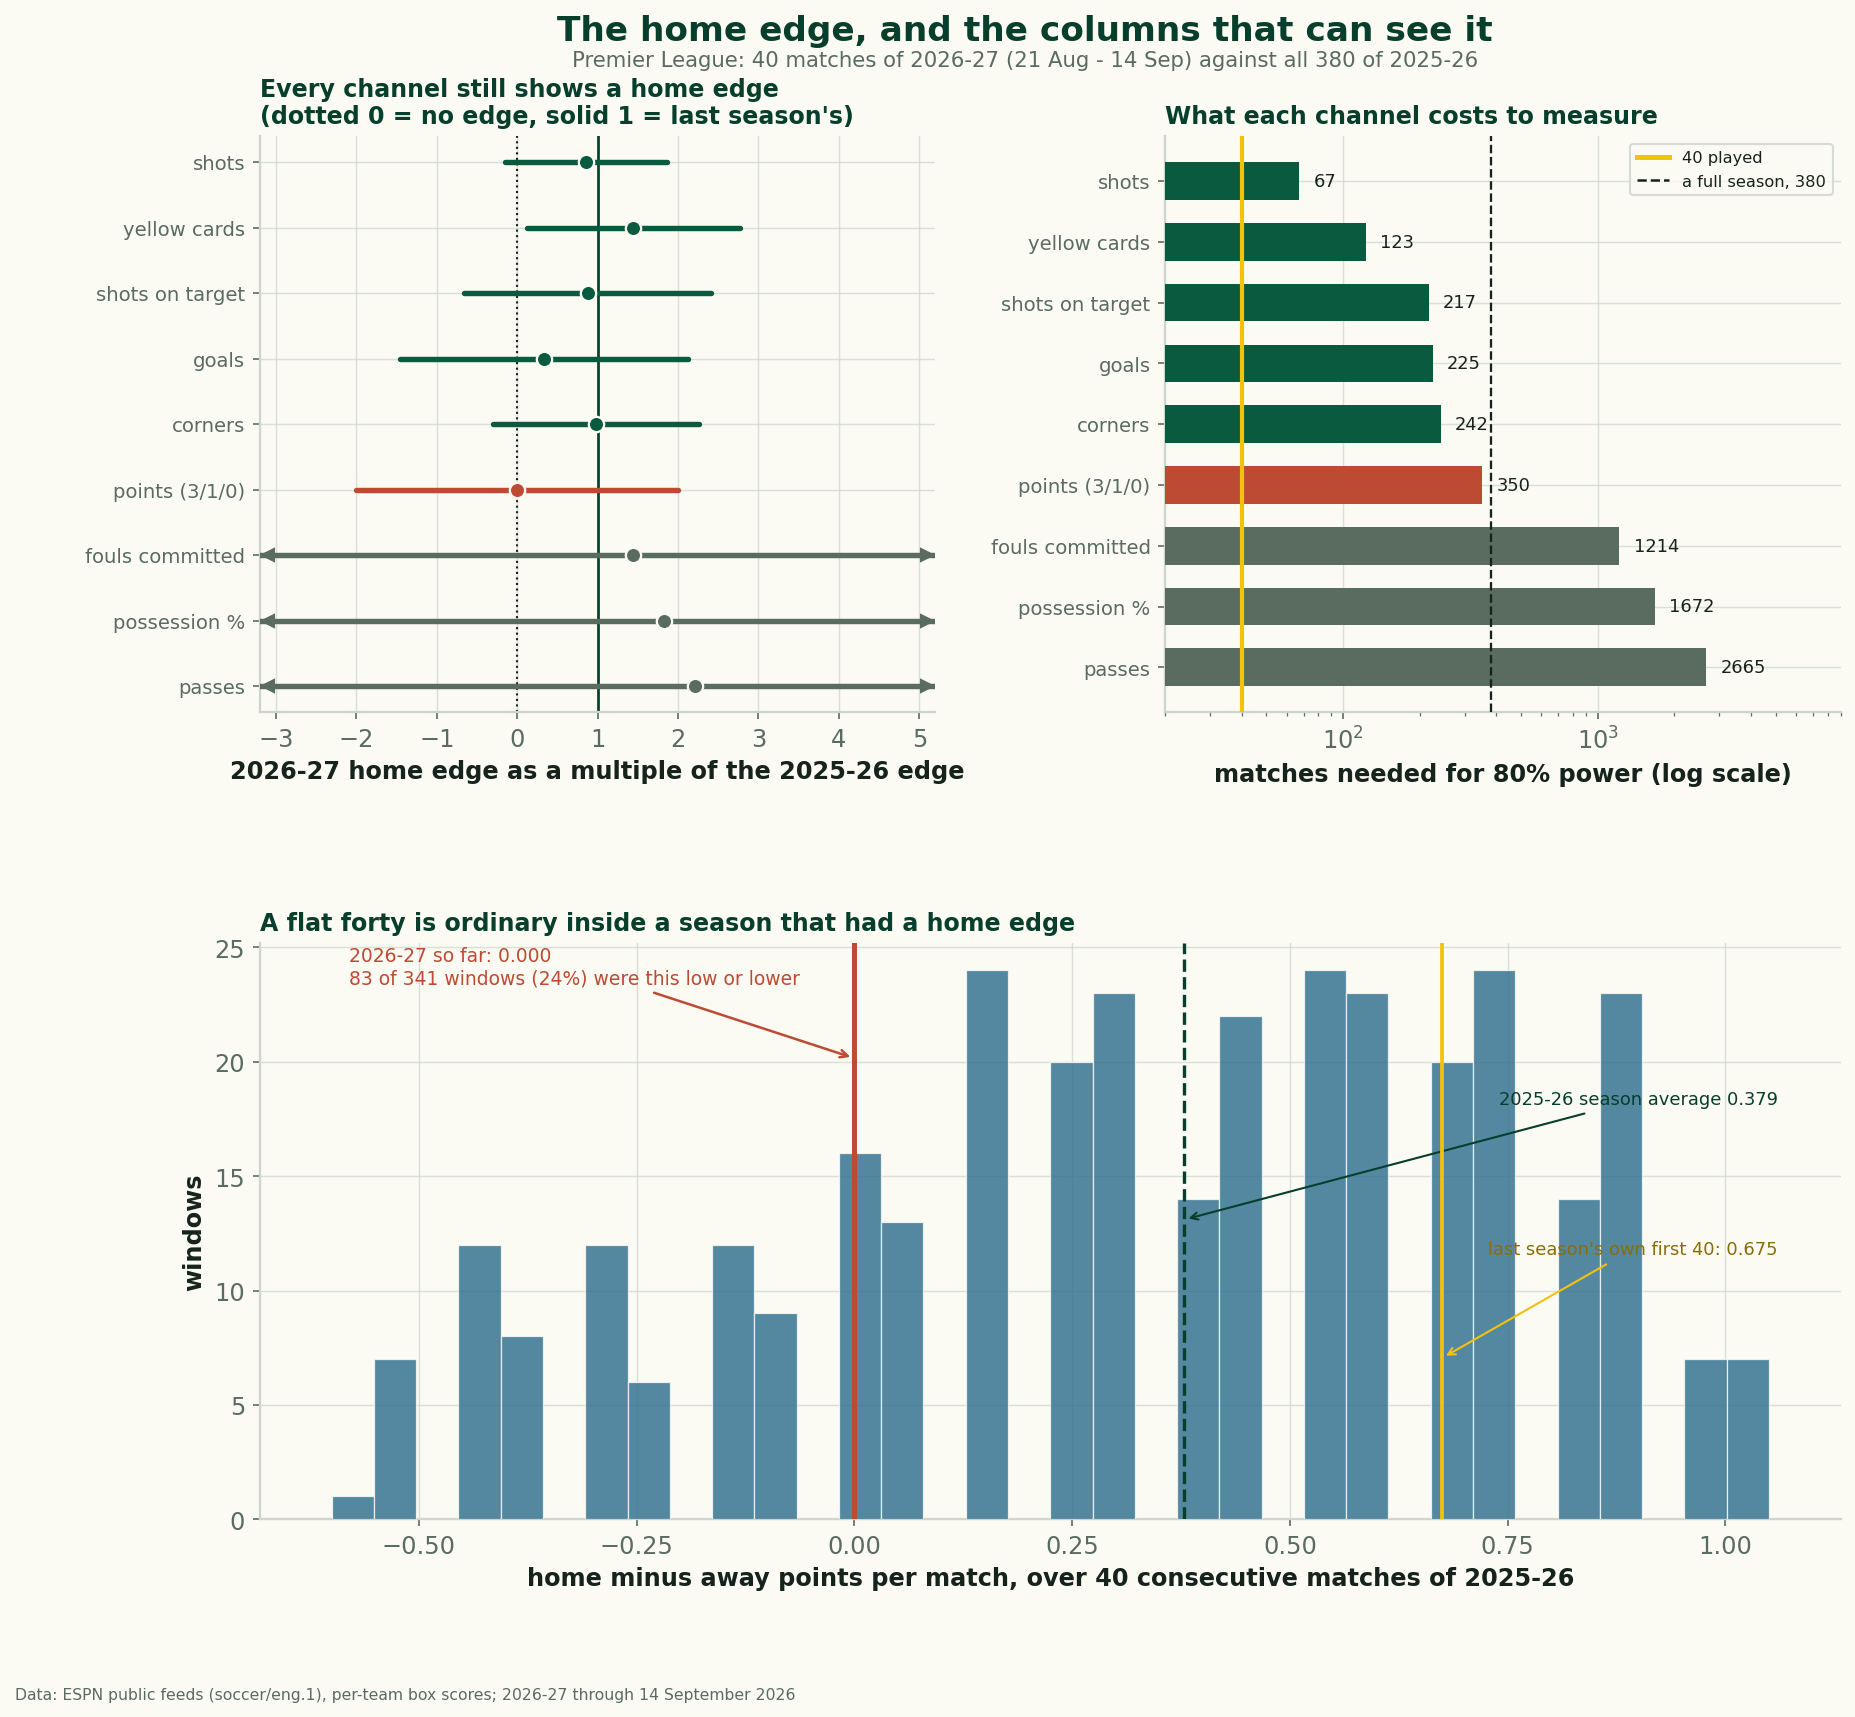
Home Advantage Didn't Die. The Results Column Can't See It
Home and away split the first 40 matches of 2026-27 evenly, yet the shot, corner and card columns keep the home edge. Plus a decade of home-advantage data.