The 2026-27 Premier League, By the Numbers
A living data ledger for the Premier League season — every number computed from completed matches, refreshed before each build. Zero predictions, zero invented numbers.
This page is a living snapshot of the 2026-27 Premier League, refreshed from completed matches before each site build. Through 50 completed matches (of the season's 380; data refreshed September 25), the league has produced 141 goals — 2.82 per game — with a draw rate of 32% and home teams winning 36% of matches. Every figure is computed from finished games only; nothing here is projected, and the raw data behind every number is one click away.
A note on sourcing. A refresh script (data_layer/refresh_epl.py) re-pulls ESPN's public scoreboard and match-summary feeds (soccer/eng.1) before each build — last refreshed September 25, and saved to a snapshot served at /data/epl_2026_27_results.json, so you can check any score in this piece against the raw file yourself. One field in that file needs a word of explanation before it trips you up: fixtures_listed is 370, not 380, because it counts only the fixtures ESPN currently carries with a confirmed date — later rounds fill in through the season as kickoff slots are set for broadcast. The 380 used throughout this piece is the structural total: 20 clubs, each playing every other home and away. Completed matches only (state=post); no predictions, no projected standings, no invented numbers. This is the same pipeline that carried this site's World Cup 2026 coverage end to end.
The headline: 2.82 goals a game through 50 matches
Across the 50 completed games, teams have combined for 141 goals — 2.82 per match. For scale: recent Premier League seasons have run around three goals a game, with 2023-24's widely-reported 1,246 goals (3.28 a game) the modern high-water mark — that reference is public reporting rather than this site's pull, so treat it as context, not a computed comparison. The distribution below is computed, though: every completed match, bucketed by total goals, with the running mean marked.
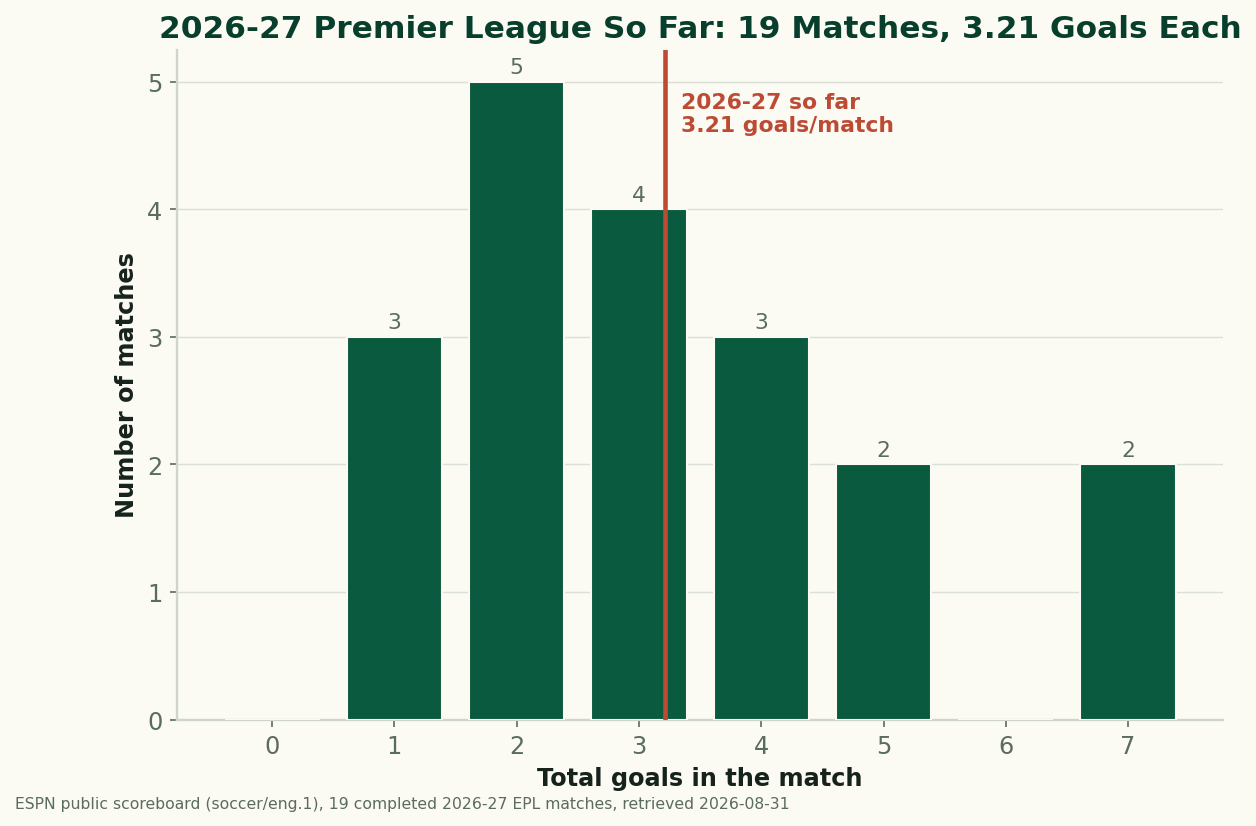
14 of the 50 games have finished with one goal or none. The six biggest scorelines so far, by total goals:
- Manchester City 5–3 Sunderland
- Chelsea 4–3 Brighton & Hove Albion
- Manchester United 5–2 Ipswich Town
- Fulham 2–3 Chelsea
- Crystal Palace 1–4 Manchester City
- Fulham 2–3 Crystal Palace
Home advantage, measured live
The running split: home teams have won 18 of 50 (36%), away teams 16 (32%), with the remaining 16 (32%) finishing level. A league season is the canonical home-advantage dataset — same teams, home and away, twice each — and this line will sharpen all season as the sample doubles back on itself. For the historical baseline and why the number has drifted over the decades, see home advantage, quantified.
The shots-on-target rule, on trial
The World Cup series' signature finding — in decided games, the team matching or beating its opponent on shots on target won 70 of 80 (87.5%) — gets its out-of-sample test here, exactly as promised in the rule's definitive statement. The running Premier League ledger: the winner matched or beat the loser on shots on target in 25 of 34 decided games with published box scores (74%). Draws are excluded by construction (the rule only speaks to games with a winner), and matches whose box score the feed hasn't published are left out of the denominator, never guessed.
Where the season stands
- It's early. 50 of the season's 380 games are in the books — a young sample. Early-season league rates are historically unstable (a handful of blowouts or a goalless weekend can move the mean visibly), so every figure above is a running tally, not a verdict.
- Rates, not tables. This page tracks league-wide rates — scoring, draws, home advantage, the rule — because those stabilise fastest and mislead least. It does not project a table, and it never will.
The limits of this snapshot
- Completed matches only. 50 of 380 games are in the dataset. Every rate above carries that sample size, and early-season rates move a lot; treat them as a running tally, not a season verdict.
- One source. Scores are widely verifiable, but the box-score stats (possession, shots, shots on target) come from a single public feed, and providers disagree at the margin.
- Goals are a blunt lens. Total goals say nothing about chance quality; shot-level xG would say more (see expected goals, explained), but this page stays at the level its feed can honestly support.
- No projections. Nothing here forecasts results, the table, or the title. It describes games already played, full stop.
Reproduce it
Two stages. Stage one, before the build: data_layer/refresh_epl.py pulls ESPN's public feeds over the network and writes the completed matches (and only the completed matches) to epl_2026_27_results.json — refreshed 2026-09-25, served at /data/epl_2026_27_results.json. Stage two, the build: entirely offline, it re-renders this page and the chart (charts/chart_epl_2026_so_far.py) from that snapshot, so the numbers and the chart can never drift apart. Goals per match is just home_score + away_score; the shots-on-target ledger counts decided games where the winner's on-target total matched or beat the loser's.
Sources & further reading
- 2026-27 results snapshot: /data/epl_2026_27_results.json — ESPN public scoreboard + summary feed (soccer/eng.1), 50 completed matches, refreshed 2026-09-25. Charted by
charts/chart_epl_2026_so_far.py. - The rule on trial: the shots-on-target rule — the full 2026 World Cup ledger this season is testing — and what actually wins games, which owns the underlying correlations.
- The machinery's track record: the World Cup 2026 living snapshot and the World Cup hub.
- Background: home advantage, quantified and expected goals, explained.
More from Data Deep-Dives
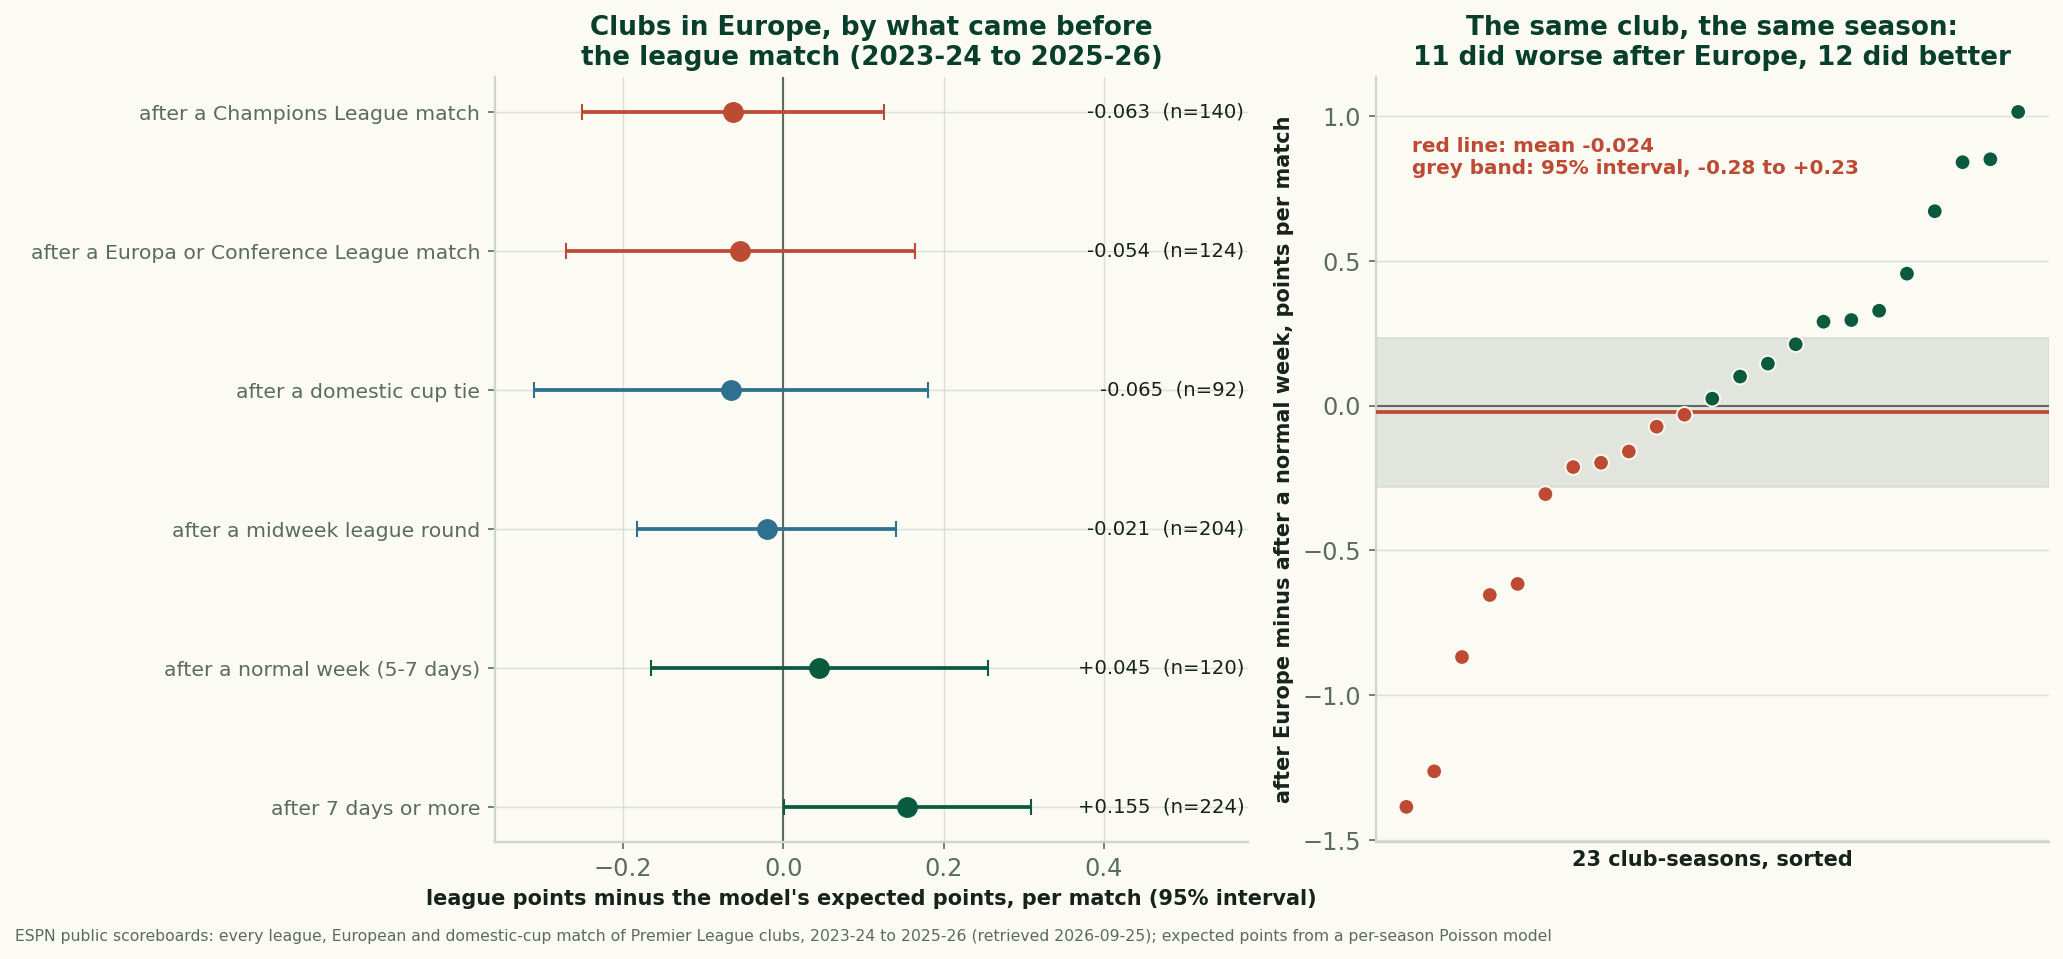
Does Europe Cost English Clubs at the Weekend? Three Seasons Can't Find It
After a European night, English clubs took 1.56 league points a match against 1.62 expected. Within the same club and season the gap is -0.024: not measurable.
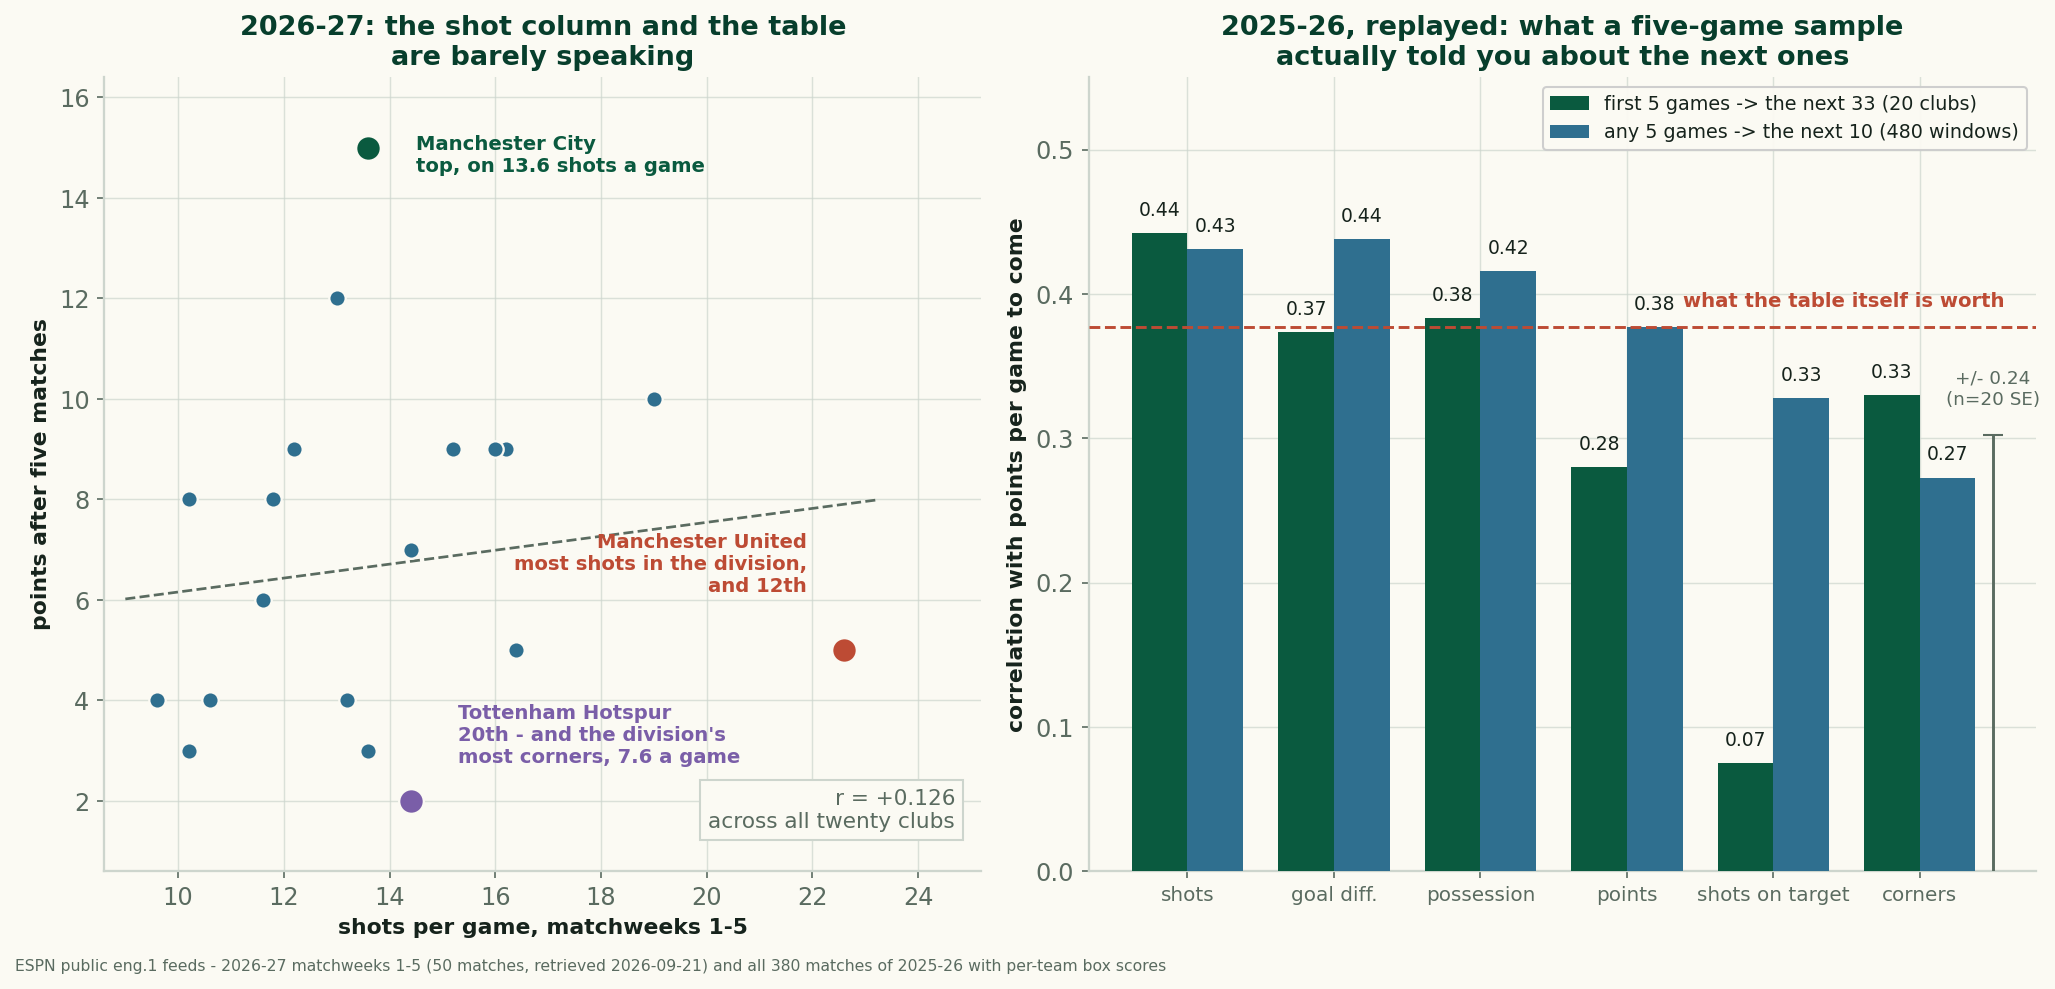
Manchester United Lead the League in Shots and Sit Twelfth
United take 22.6 shots a game and have 5 points. Across 2025-26, a club's five-game shot count predicted its next results better than its points did.
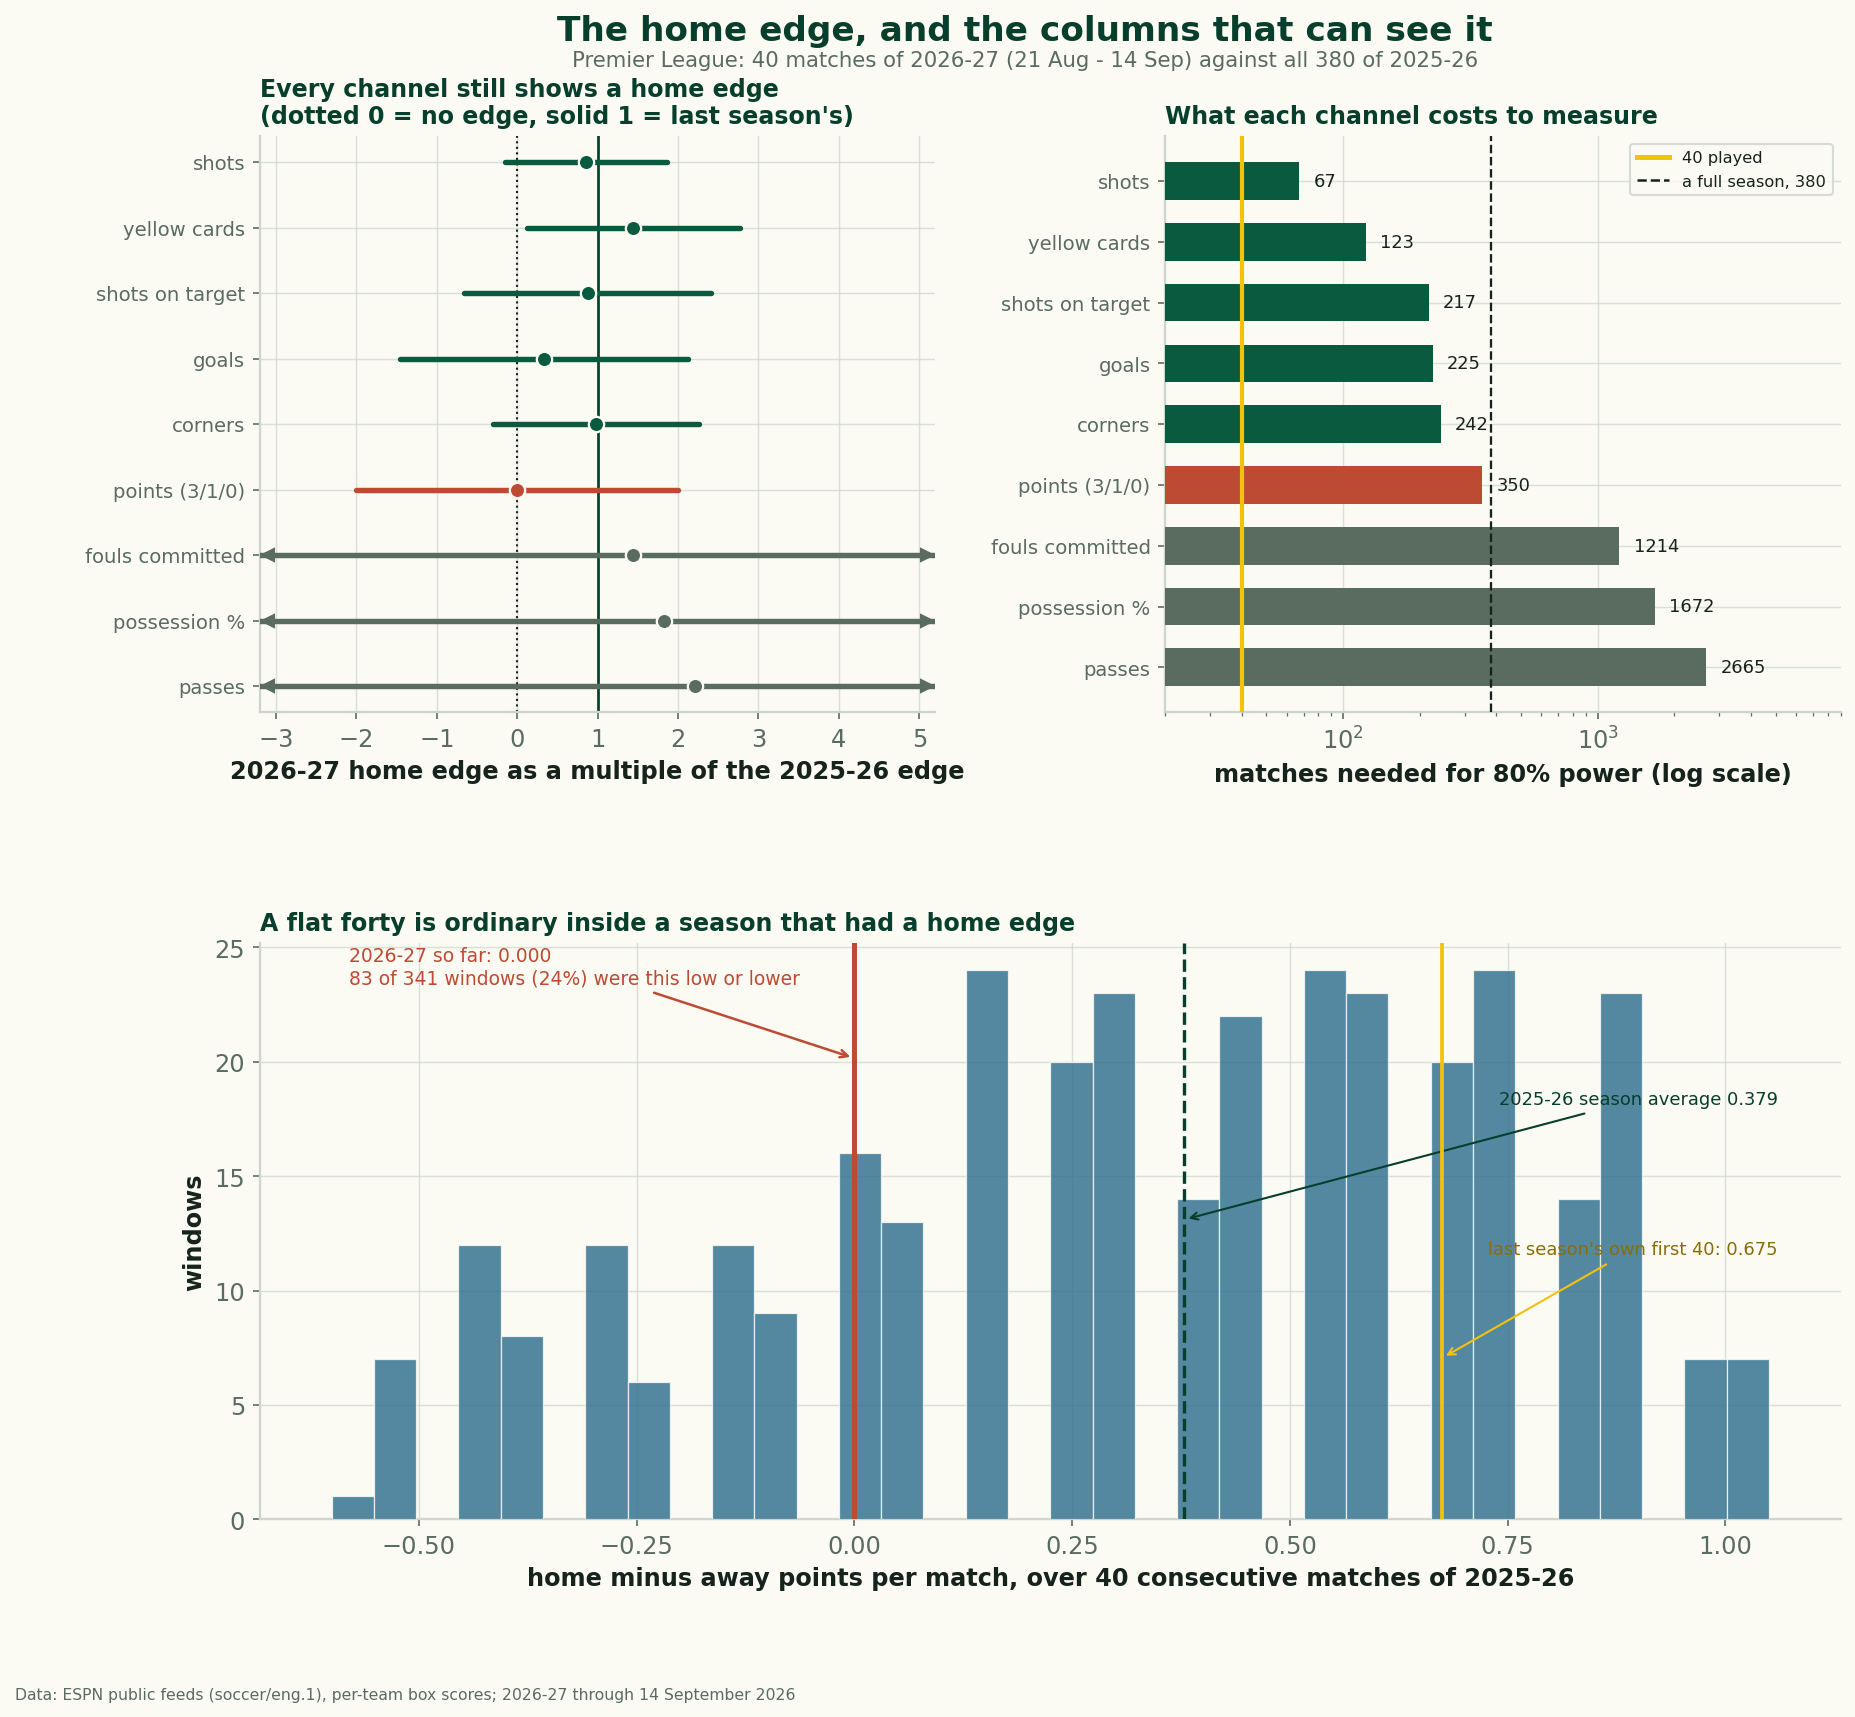
Home Advantage Didn't Die. The Results Column Can't See It
Home and away split the first 40 matches of 2026-27 evenly, yet the shot, corner and card columns keep the home edge. Plus a decade of home-advantage data.