World Cup 2026 by the Numbers: A Data-Driven Tournament Primer
The first 48-team World Cup, by the numbers.
The 2026 World Cup is a structural experiment on a scale football has never attempted. Forty-eight teams. One hundred and four matches. Twelve groups of four, then a second knockout round nobody quite asked for. Before the first whistle, it's worth grounding the whole thing in what the data from recent tournaments actually tells us — about how many goals to expect, what underlying quality looked like last time, and how to watch a short knockout event without losing your analytical mind to small samples.
The new shape of the tournament
The arithmetic of the expanded format is striking. The previous 32-team World Cup ran 64 matches across four weeks. The 2026 edition runs 104 matches — a 62.5% increase in volume — with just 16 more teams. The explanation is the new bracket structure: twelve groups of four produce 72 group-stage games (each group plays six, as in the old format) compared to 48 under the 32-team setup — 24 extra group games already. The knockout tree is also longer because 32 teams advance from the group stage rather than 16, adding a full extra round of 32. Together, those two expansions account for the jump from 64 to 104.
The practical consequence is that the group stage is even more condensed per team. Each side plays three matches and goes home or advances. There is no room to lose the opener and recover gradually; a single bad afternoon against the right opponent can end a campaign. That pressure is something the analytics — especially xG — is well-placed to navigate.
What the goals data from recent editions says
The two most recent World Cups give us a clean, consistent baseline. Both ran 64 matches, both used high-quality data, and the scoring figures are close enough to suggest a genuine underlying rate.
| Year | Matches | Goals | Goals per game |
|---|---|---|---|
| 2018 (Russia) | 64 | 169 | 2.64 |
| 2022 (Qatar) | 64 | 172 | 2.69 |
Two tournaments, the figure barely moves: roughly 2.65 goals per game. Held across 104 matches, that projects to around 276 goals — easily the most by total volume, though the per-game rate may look similar. The honest caveat: the field is wider. The 16 new entrants are the least-ranked sides ever to qualify; group-stage mismatches could push the average up, or defensive improvement could pull it back. The range is genuine.
The xG picture from 2022
Goals per game is a useful orienting number, but it conflates chance quality with finishing. The more illuminating question is which teams consistently manufactured the best chances — and for that, expected goals across the full tournament is the right instrument.
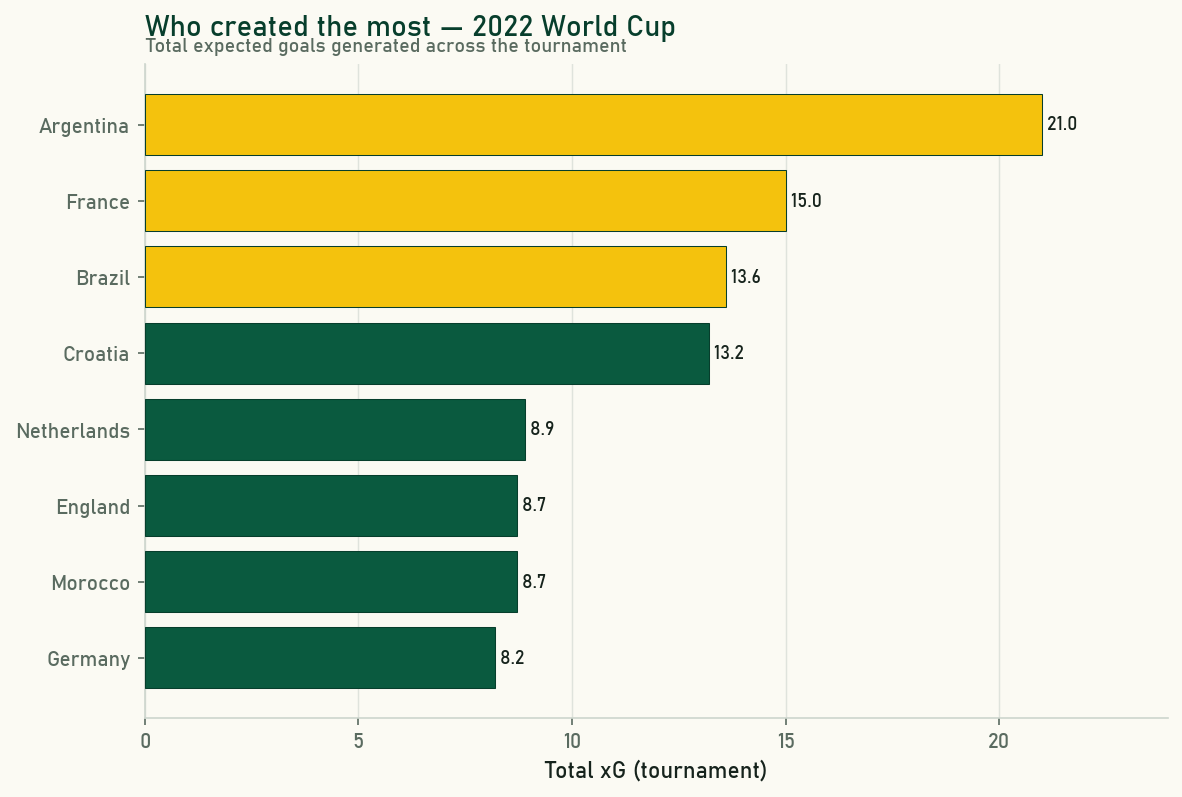
The chart tells a story the scorelines only partially confirmed. Argentina led the field by a considerable margin, which is consistent with winning the tournament. But look at the rest of the top eight.
| Team | Total xG created |
|---|---|
| Argentina | 21.0 |
| France | 15.0 |
| Brazil | 13.6 |
| Croatia | 13.2 |
| Netherlands | 8.9 |
| England | 8.7 |
| Morocco | 8.7 |
| Germany | 8.2 |
Brazil created 13.6 xG and went out in the quarter-finals on penalties. Germany mustered 8.2 xG and did not leave the group stage. Morocco, a famous story of that tournament, put up 8.7 xG en route to the semi-finals — the underlying quality was real, not just heroic defending and good fortune. The table is a reminder that at a World Cup, results and underlying quality diverge regularly: a 25-shot quarter-final going to a shoot-out is a coin flip the xG can illuminate without resolving. The coin flip still has to happen.
How to watch a 48-team World Cup analytically
Short tournaments are analytically brutal. A side can create excellent chances for seven matches and exit on penalties twice. That is not a flaw in the format; it is how low-scoring, high-variance sport works. The analytical toolkit helps, but only if you hold it correctly.
The principle worth internalising before a ball is kicked: xG over results, especially early. A team that loses its group opener 1–0 despite posting 1.8 xG against 0.4 is in a different position from a team that won 1–0 posting 0.5 against 1.3. The scoreboard says they have identical points. The underlying picture is quite different. With only three group games per team, that quality signal is thin — but it is thicker than nothing, and it updates fast when you can track it match to match.
The extended bracket creates an extra complication in 2026: the new round of 32. At 32 teams in the knockout stage, a high-quality side can now face a very weak opponent in the last 32 and run up a scoreline that flatters the xG without revealing much about tournament-level capability. The knockout bracket shape matters. Keeping track of the xG against comparable opposition — rather than the aggregate — is the more honest signal.
There is also the question of chance quality. The 2022 group stage had genuinely mismatched ties — Germany 4–2 Costa Rica, France 4–1 Australia — and those high-xG blowouts shape overall averages. With 16 more teams in 2026, similar results are probable. The aggregate tournament xG becomes a noisier benchmark; the more informative question is how the contenders are performing against each other.
The sample-size problem and why it matters more in 2026
Any statistician who tells you three matches is enough to reliably characterise a team is selling something. At a 48-team World Cup, most group-stage records involve exactly three games, and one bad referee decision or one deflection can alter the whole trajectory. That has always been true of the World Cup, and it is part of what makes the tournament compelling. The 2026 format makes this worse, not better. With 48 teams, there are more truly mismatched group ties — the bottom of the field is wider — yet each side still plays only three group games before the bracket decides everything. Three matches per team is a very thin sample at any tournament; at this one, those three matches may be the only signal available before the knockout noise takes over entirely. The trade-off FIFA made is volume of participating nations versus depth of group-stage data.
For an analytical viewer, the response is not despair but calibration. Use xG to understand what happened in a game, not to rank teams after one match. Treat the group stage as a noisy signal, the round of 32 as slightly less noisy, and the quarter-finals onward as where the accumulated underlying data starts to mean something. By the semi-finals, each remaining team will have played five or six matches, and the patterns become genuinely informative.
The one number that tends to stabilise fastest is expected goals conceded. Teams that defend well across multiple tournament rounds — low xGA, high-quality saves, disciplined shape — are doing something real and repeatable. Morocco in 2022 illustrated the principle: a team celebrated primarily for its defending, which held firm across six matches to reach the semi-finals, and whose underlying defensive numbers reflected genuine structural discipline rather than goalkeeping heroics alone. Goals prevented is a harder skill to fake across a run of games than goals scored.
What to look for, edition by edition
The most useful analytical habit for 2026 is building a simple running tally: each team's cumulative xG for, xG against, and the difference. At the start of the group stage the numbers are fragile. By the quarter-finals they are telling a coherent story. Argentina's 21.0 xG across seven matches at the 2022 tournament is a clean illustration of what a winning run looks like through this lens: sustained chance creation at a level no other side matched. That kind of record does not emerge by accident.
The 2026 tournament will produce the largest ever single-edition dataset: 104 matches, all from the same competition. That is genuinely useful for post-tournament analysis and model refinement. More noise in the early rounds, but a richer picture by the end. The tools to interpret it exist; the requirement is patience with small samples and scepticism toward any narrative that firms up too early.
Sources & further reading
- Free textbook: Chapter 20: Predictive Modeling — the theory behind this, at DataField.dev.
- StatsBomb open data — match-level and event-level data for the 2018 and 2022 World Cups, including shot-by-shot xG values.
- StatsBomb — methodology documentation and articles on how their xG models are built and validated.
- FBref — xG, xGA and progressive passing data for international matches.
- Understat — xG tables and per-game visualisations for major competitions.
More from Data Deep-Dives
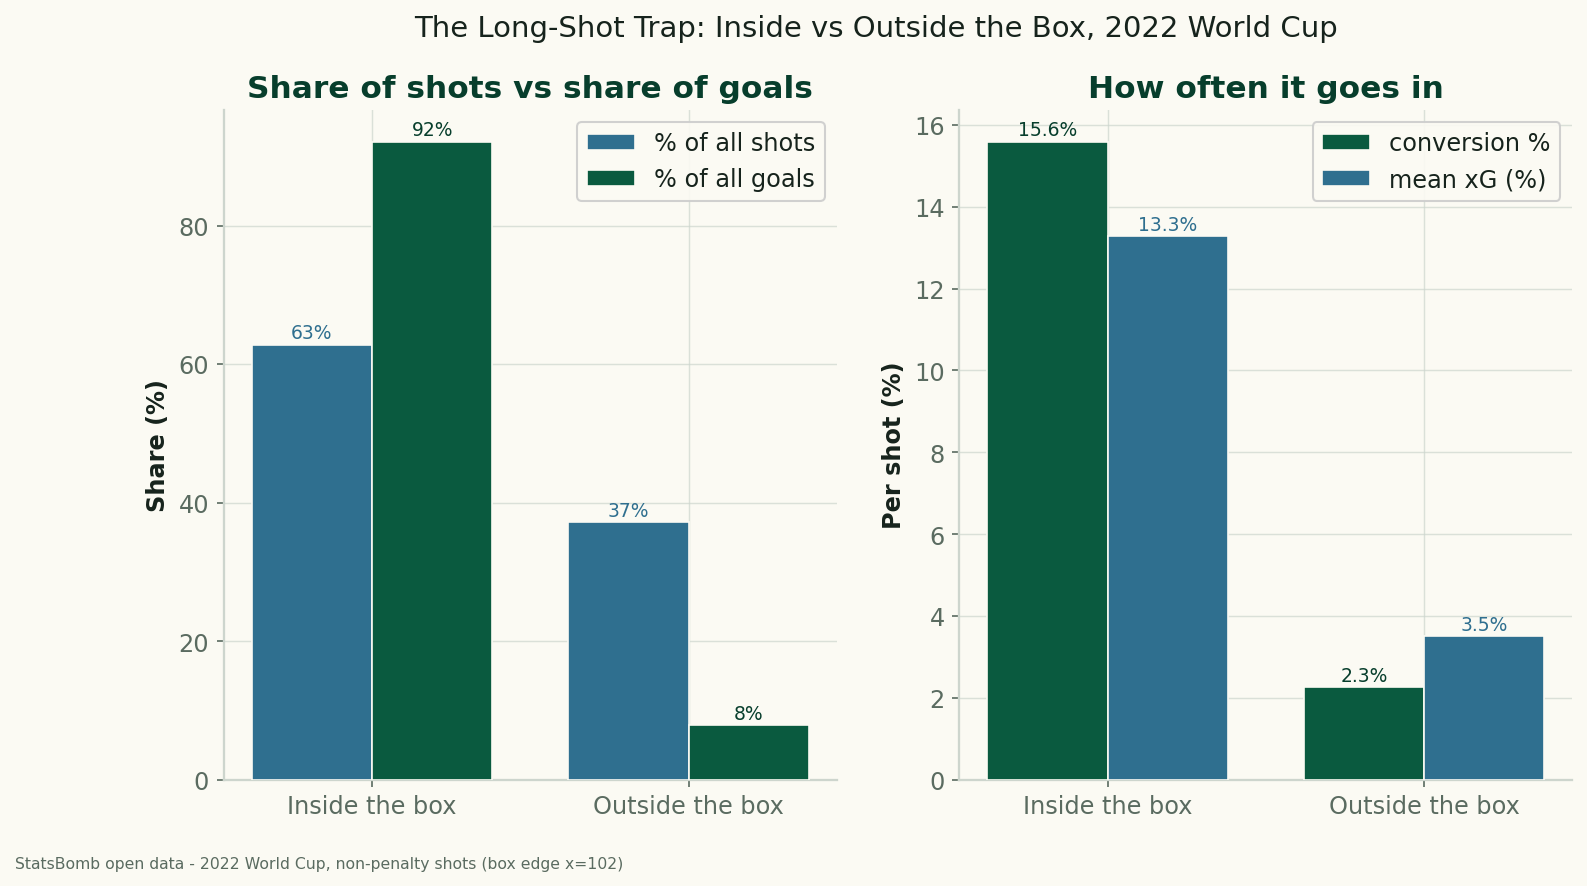
The Long-Shot Trap: Inside vs Outside the Box at the 2022 World Cup
Using StatsBomb data for all 64 matches of the 2022 World Cup, shots from outside the penalty box were 37% of all attempts but produced just 8% of the goals — a 2.3% conversion rate against 15.6% from inside. The data behind 'stop shooting from there.'
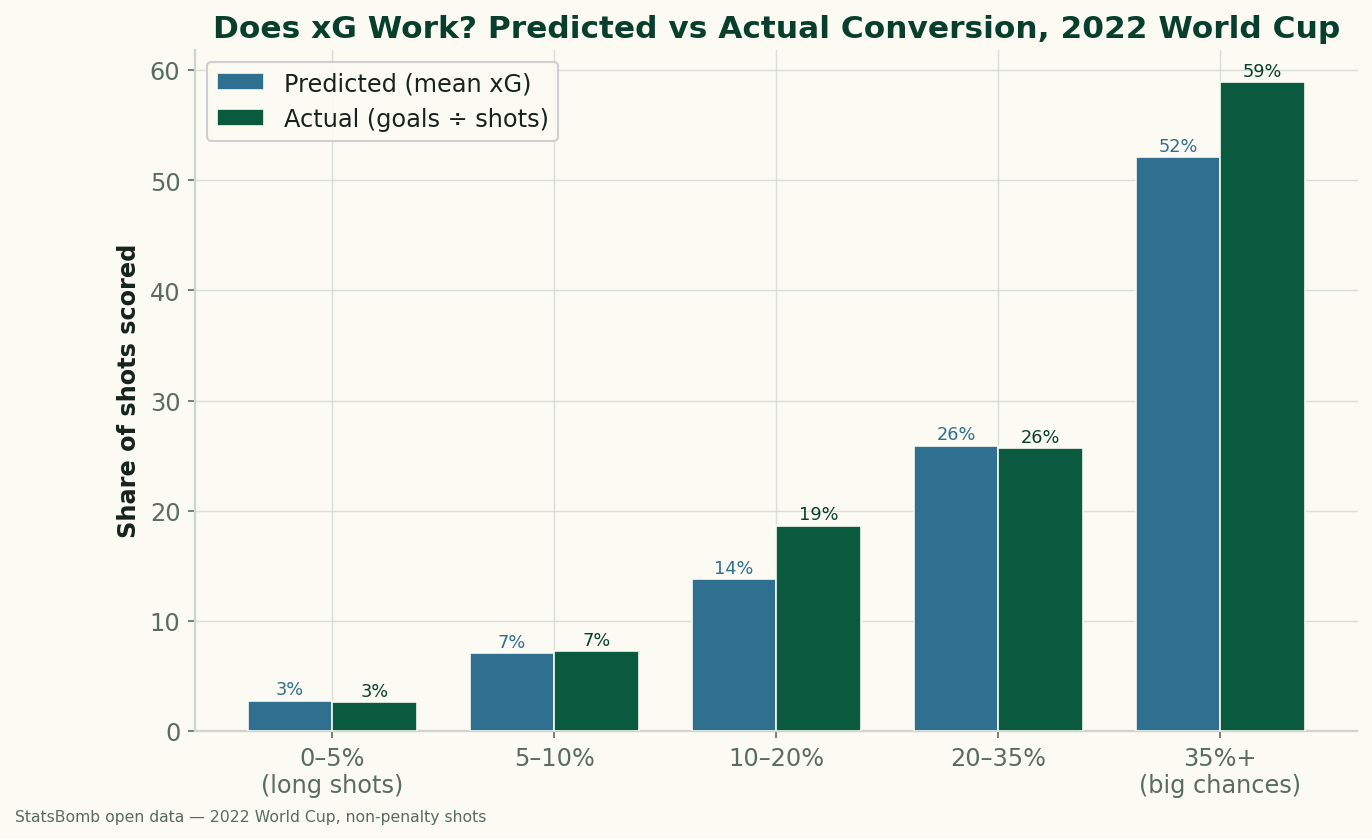
Does xG Actually Work? Big Chances vs Long Shots at the 2022 World Cup
We sorted every non-penalty shot from the 2022 World Cup by its expected-goals value and checked how often each band actually went in. xG holds up well: a 0–5% shot scored 2.6% of the time, a 'big chance' of 35%+ went in 58.9%. The calibration, and what a big chance is really worth.
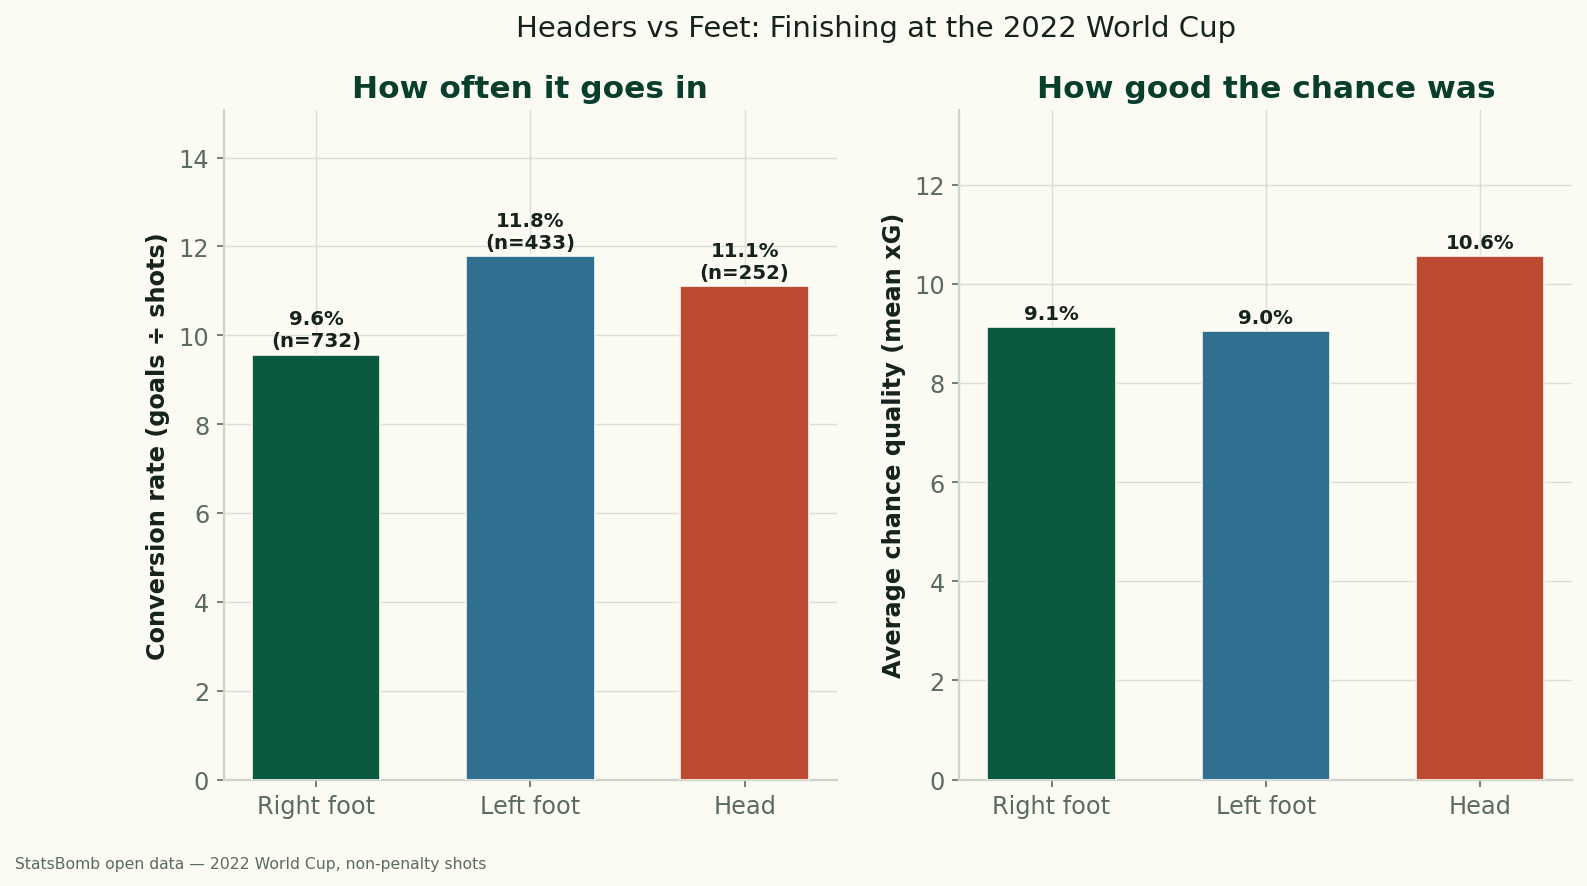
Headers vs. Feet: Which World Cup Shots Actually Go In?
Using StatsBomb data for all 64 matches of the 2022 World Cup, headers and feet convert at almost the same rate (11.1% vs 10.5%) — but only because headers come from higher-quality positions. Relative to chance quality, foot finishing beat the model, and the left foot was the most clinical of all.