Post-Shot xG and Goalkeeper Metrics: How We Measure Shot-Stopping
How post-shot xG actually grades a goalkeeper.
Pre-shot xG tells you how dangerous a chance was before the ball was struck. It says nothing useful about the goalkeeper, because the goalkeeper hadn't touched it yet. Post-shot xG — PSxG — fixes that by waiting until the ball is in flight: it grades the shot on where it was heading and how hard it was travelling, then hands that probability to the keeper as the standard they were held to. The difference between that standard and the goals they actually let in is the closest thing we have to a clean goalkeeper metric.
Why pre-shot xG is the wrong tool for keepers
It feels like pre-shot xG should work as a goalkeeper benchmark. If a team's chances against you averaged 0.08 xG and you let in seven goals from eighty shots, that looks fine — you're on the right side of the numbers. The trouble is that on-target shots are not a representative sample of all shots. Strikers aim at corners, they pick their spots, they strike hard when they're in space. Everything that turns a 0.12 xG chance into a 0.22 xG chance — a clean strike, a disguised finish, a ball placed inside the post — happens after the pre-shot model is done with it.
The result is a systematic gap. Across the 64 matches of the 2022 World Cup, on-target shots carried a combined pre-shot xG of 112.1. Those same shots produced 187 goals — a ratio of 1.67. On-target shots beat their pre-shot xG by two-thirds, every single tournament. That gap isn't noise; it's the information pre-shot xG structurally discards. PSxG is the model that captures it.
What PSxG actually models
Post-shot expected goals is computed at the moment of contact. Where pre-shot xG asks "how good was this chance?", PSxG asks "given that the shot was on target, how likely is this specific ball to beat a keeper?" The key inputs shift from chance construction to shot execution:
- Shot placement. A shot hit into the top corner from twelve yards is harder to stop than the same shot hit at the keeper's hands. PSxG knows which it is.
- Shot speed and trajectory. Hard, low drives along the ground beat keepers more often than similarly-placed floaters. The best PSxG models — StatsBomb's included — incorporate shot pace and flight path where the data allows.
- Body part. A header into the bottom corner is a different save from a driven shot to the same spot. PSxG accounts for this separately from pre-shot xG.
- Keeper starting position. If the keeper is stranded or already committed in the wrong direction, PSxG can reflect that a technically saveable shot was realistically not.
The model is still a probability — PSxG of 0.74 means that among shots that looked exactly like this one, about three-quarters went in. But now "exactly like this one" includes the information that separates world-class keepers from league-average ones.
Goals prevented: the keeper's ledger
The output metric built on PSxG is called goals prevented (sometimes written as GA minus PSxG faced, or PSxG minus GA depending on sign convention). The arithmetic is simple:
Goals prevented = PSxG faced − Goals conceded
A keeper who faces shots totalling 8.0 PSxG and concedes six goals has prevented 2.0 — they outperformed what any average keeper would have managed. A keeper who faces the same 8.0 PSxG but lets in ten has cost their team 2.0 goals relative to average. Over a season, these numbers accumulate into the clearest single-number verdict on shot-stopping we have.
The pre-shot equivalent — xG conceded minus goals conceded — is a weaker signal precisely because of that 1.67 ratio. France's goalkeeper at the 2022 World Cup faced on-target shots worth just 8.0 pre-shot xG, yet conceded 12 goals — catastrophic in pre-shot terms. In PSxG terms those twelve goals need to be assessed against the PSxG of the shots actually faced, not the pre-shot xG of every chance. The metrics measure different things.
The 2022 World Cup sample
The chart below plots pre-shot xG faced (on-target only) against goals conceded for the four semi-final teams. It illustrates the core problem directly.
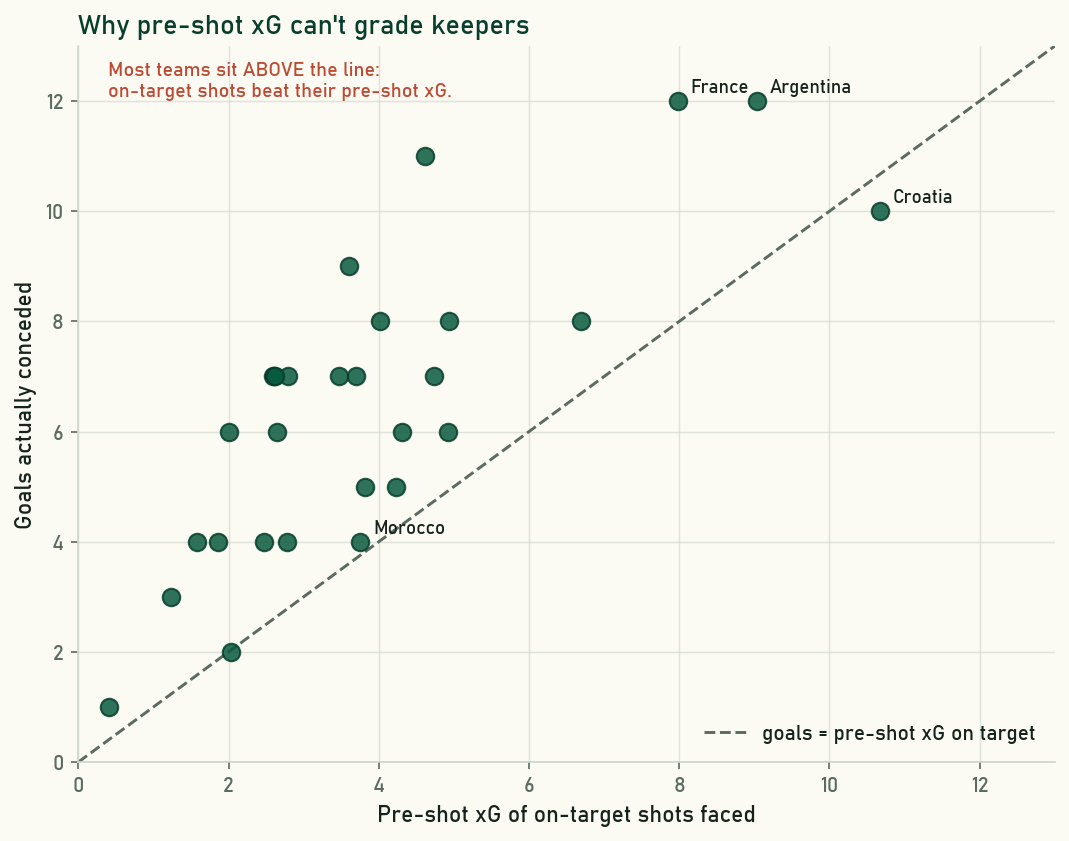
The y=x line is the theoretical "fair" outcome if pre-shot xG perfectly predicted on-target goals. Almost every team sits above it. That is not a coincidence and not a fluke in one season's data — it is the structural undershoot built into pre-shot xG when applied only to the on-target sample.
| Team | Pre-shot xG faced (on target) | Goals conceded | Ratio |
|---|---|---|---|
| Croatia | 10.7 | 10 | 0.93 |
| Argentina | 9.0 | 12 | 1.33 |
| France | 8.0 | 12 | 1.50 |
| Morocco | 3.8 | 4 | 1.05 |
Morocco's defence was exceptional by pre-shot standards — just 3.8 pre-shot xG of on-target attempts across seven matches. But that cannot tell you whether Yassine Bounou was outstanding or merely well-protected; for that you need PSxG. Croatia's Dominik Livaković faced 10.7 pre-shot xG and conceded 10, a ratio below 1.0 and the only semi-finalist on the right side of that line. These numbers hint at the story; PSxG would finish it.
Computing PSxG: what you actually need
True PSxG requires shot-placement data that is not in most public datasets — specifically, where the ball was heading in the goal frame at the moment of contact. StatsBomb's event data provides shot_end_location as a three-element vector (x, y, z), which is enough. Most other freely available datasets do not carry it, so if you're working outside StatsBomb, you're limited to on-target conversion rates by distance and angle band — a meaningful step above raw pre-shot xG, but not the real thing.
With StatsBomb open data and Python:
from statsbombpy import sb
import pandas as pd

# Fetch all 2022 World Cup events
comps = sb.competitions()
season = comps[(comps.competition_id == 43) & (comps.season_name == "2022")].iloc[0]
matches = sb.matches(competition_id=43, season_id=int(season.season_id))

all_shots = []
for _, match in matches.iterrows():
    events = sb.events(match_id=int(match.match_id))
    shots = events[events.type == "Shot"].copy()
    all_shots.append(shots)

shots = pd.concat(all_shots, ignore_index=True)

# On-target shots only: outcome is 'Saved', 'Goal', or 'Saved Off Target'
on_target = shots[shots.shot_outcome.isin(["Saved", "Goal", "Saved Off Target"])]

# shot_end_location is [x, y, z] — y and z encode placement in the goal frame
on_target = on_target.copy()
on_target["end_y"] = on_target["shot_end_location"].apply(
    lambda v: v[1] if isinstance(v, list) and len(v) >= 2 else None
)
on_target["end_z"] = on_target["shot_end_location"].apply(
    lambda v: v[2] if isinstance(v, list) and len(v) >= 3 else None
)
on_target["is_goal"] = on_target["shot_outcome"] == "Goal"

print(on_target[["shot_statsbomb_xg", "end_y", "end_z", "is_goal"]].head())
From here, train a logistic regression or gradient-boosted model on end_y, end_z, body part, and shot speed (if available) with is_goal as the target. Evaluated on each on-target shot, that model's output is your PSxG. PSxG faced − goals conceded gives goals prevented per keeper.
What PSxG still can't tell you
Goals prevented is a better goalkeeper metric than anything built on pre-shot xG, but three caveats are worth keeping front and centre.
Rebounds. If a keeper parries rather than holds, the model counts that as a success — a 0.7 PSxG shot did not become a goal from the original attempt. The rebound is a separate event with its own (usually high) PSxG. Most implementations treat them independently, which can flatter keepers who palm into danger rather than holding.
Defenders. A central defender who deflects a shot from the near-side of the goal to the far post has changed the PSxG of the eventual attempt. If the keeper saves the redirected ball, they're being credited for a harder save than the striker intended. Disentangling keeper merit from outfield positioning is a genuine unsolved problem at the publicly available data level.
Sample size. A goalkeeper at a major international tournament might face fifty on-target shots across a whole competition. The goals prevented metric has a confidence interval around it that most published league tables pretend does not exist. A difference of two goals prevented over a season could easily be noise. The metric is most meaningful when accumulated over many seasons with a consistent team shape, or when the difference is large enough to survive the uncertainty.
Sources & further reading
- Free textbook: Chapter 7: Expected Goals (xG) Models — the theory behind this, at DataField.dev.
- StatsBomb open data — the shot-level data including
shot_end_locationandshot_statsbomb_xgused throughout this article. - StatsBomb — documentation on their PSxG model and goalkeeper metrics in their commercial data offering.
- FBref — publishes PSxG and goals prevented for keepers across major leagues (Opta-sourced).
- Understat — xG tables for the major European leagues, useful context for the pre-shot baseline.
More from Stat Explainers
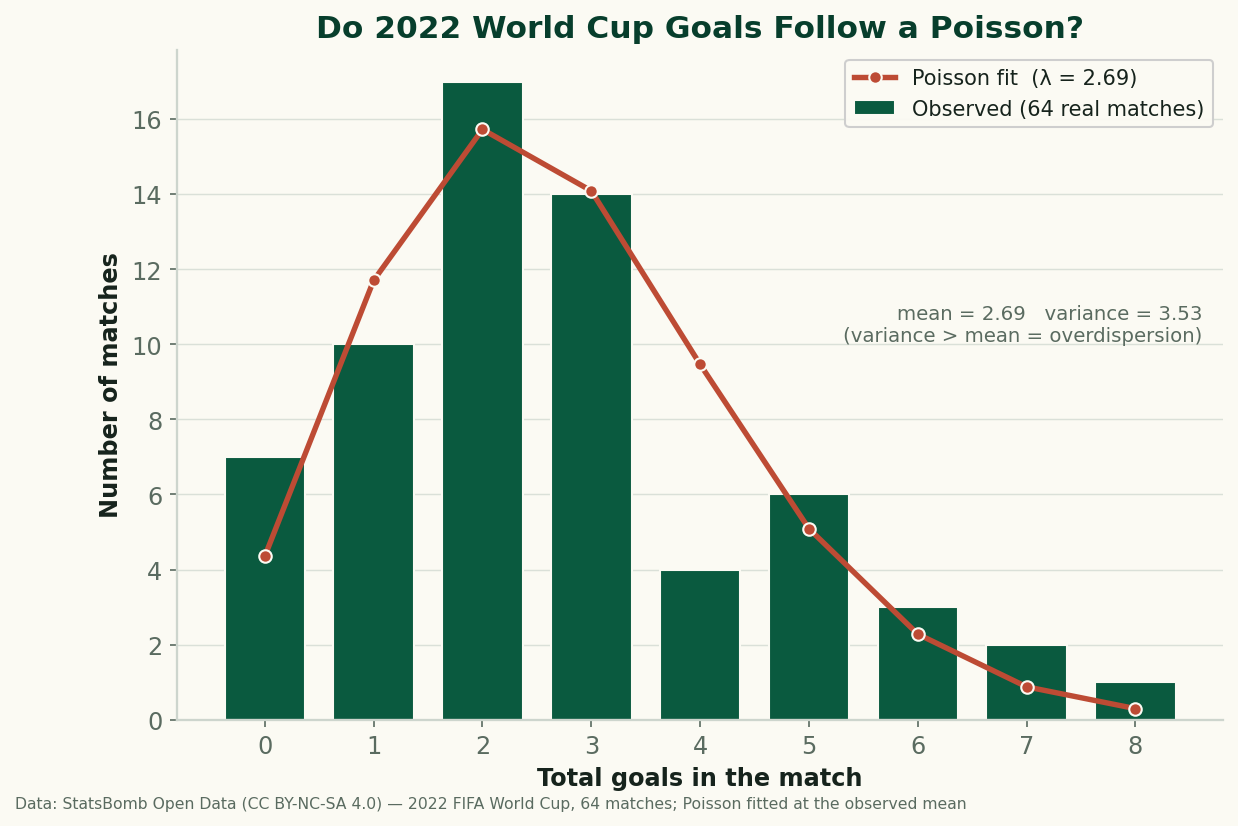
Do Football Goals Follow a Poisson? Testing the Standard Model on All 64 Games of 2022
Every scoreline prediction in football rests on the Poisson distribution. So I fit it to all 64 real matches of the 2022 World Cup and checked the residuals — it gets the shape right and fails in one specific, informative way: real goals are overdispersed. Here's why, with the formula and the code.
Aerial Duels and Heading Data: Reading Win Rate Without Getting Fooled by Volume
Aerial-duel win percentage, why raw counts mislead, where aerial dominance actually matters — set pieces, target men, defending crosses — and how to read heading data without confusing volume for quality.
Expected Points (xPts): Turning Shot-Level xG Into a Fairer Table
Expected points (xPts) simulates a match from its shot-level xG to get win, draw and loss probabilities, then a points total that rewards the chances a team created rather than the goals that happened to go in. How it is computed and what it reveals against the real table.