Possession-Adjusted Stats: Why Raw Tackle Counts Lie
Raw defensive counts measure the wrong thing. Here is the fix.
Tunisia led the 2022 World Cup with 92 defensive actions per match. Spain, the tournament's most elegant side, sat near the bottom of the same list. The obvious interpretation — Tunisia were defensively heroic, Spain were passive — is exactly backwards. Tunisia spent so little time with the ball that they had no choice but to defend constantly. Spain barely needed to tackle because they kept the ball. Raw defensive counts are not a measure of defensive quality. They are a measure of how little a team had the ball.
The problem: possession dictates opportunity
Think about what a tackle or an interception requires. The opposition must be in possession in your vicinity. If your team controls sixty-five percent of the ball, the opposition only has it thirty-five percent of the time — roughly twenty minutes of a ninety-minute match. Compare that to a side squeezed into their own half with forty percent possession: the opposition has sixty percent, and they are likely spending much of it in dangerous areas. The second team will always rack up more raw defensive actions, not because they are better at defending, but because they have far more chances to do so.
This is not an edge case or a subtle bias. Across all 64 matches of the 2022 World Cup, the correlation between a team's possession share and its raw defensive actions per match was r = −0.70. That is a strong, consistent, negative relationship. Teams with more ball made fewer raw defensive actions. Almost three-quarters of the variation in raw defensive counts can be explained, not by how good a team is at defending, but by how much they happened to have the ball.
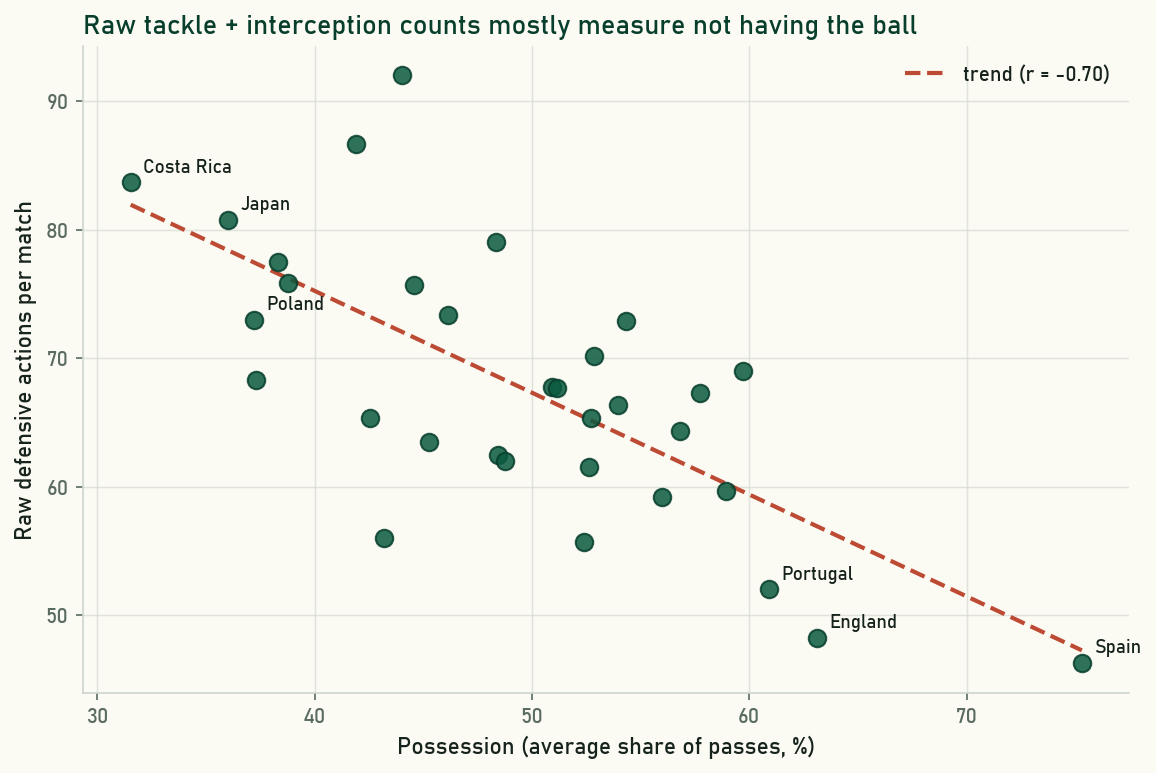
The six teams with the highest raw defensive-action totals tell the story on their own.
| Team | Raw actions / match |
|---|---|
| Tunisia | 92.0 |
| Ghana | 86.7 |
| Costa Rica | 83.7 |
| Japan | 80.8 |
| Uruguay | 79.0 |
| Australia | 77.5 |
None of those teams were described by analysts as elite defensive units at the tournament. What they had in common was below-average possession. If you published that table on a stat sheet without context, a reader would conclude they were looking at the tournament's best-organised defences. They were not. They were mostly teams that spent their lives chasing the ball.
The fix: possession adjustment
The intuition behind possession-adjustment is simple. We want to answer the question: if every team had the ball fifty percent of the time, how many defensive actions would they make? We normalise to a neutral fifty-fifty baseline so that teams can be compared regardless of how much their possession style inflated or suppressed their raw opportunities to defend.
The formula is:
pAdj = raw × (0.5 ÷ (1 − possession_share))
Where possession_share is expressed as a decimal (e.g. 0.60 for 60%).
The term (1 − possession_share) is how much of the match a team is out of possession — the only time they can make a defensive action. Dividing 0.5 by that value scales the raw count to what you would expect at a neutral fifty-fifty split. A team that has the ball sixty percent of the time is only out of possession forty percent, so we multiply their raw total by 0.5 / 0.40 = 1.25 to inflate it to what it would be at fifty-fifty. A team with only thirty-five percent possession is out of possession sixty-five percent, so we multiply by 0.5 / 0.65 = 0.77, deflating their inflated raw count.
A worked example: Tunisia vs Spain
Tunisia averaged 92.0 raw defensive actions per match on an average possession share of roughly 44%. Running the formula:
pAdj = 92.0 × (0.5 / (1 − 0.44)) = 92.0 × (0.5 / 0.56) = 92.0 × 0.893 = 82.2
Spain, meanwhile, dominated the ball at roughly 64% possession and produced far fewer raw actions. After adjustment Spain comes out at 93.6 pAdj actions per match — the highest in the tournament. Scaled to equal time out of possession, Spain were not the passive observers their raw count implied. They were the most active defensive team at the World Cup. The raw count hid this entirely because they spent so little time chasing the ball.
| Team | pAdj actions / match |
|---|---|
| Spain | 93.6 |
| Denmark | 85.6 |
| Tunisia | 82.2 |
| Croatia | 79.8 |
| Argentina | 79.6 |
| Uruguay | 76.5 |
Tunisia hold on at third — they were genuinely busy defensively even after adjustment — but the list looks entirely different. Spain lead it. Denmark and Croatia, two well-drilled pressing sides, appear. The overall impression shifts from "low-possession underdogs" to something closer to the reality of what those teams were actually trying to do tactically.
When pAdj is most useful
Possession-adjustment is most valuable precisely where raw counts are most misleading: comparing teams with contrasting styles, or comparing players who play in contrasting systems. A holding midfielder at a high-possession club will always look physically less active in raw stats than the equivalent player at a low-block team. That says almost nothing about who is better at the job. Applying the formula levels the pitch.
Cross-league comparisons benefit enormously from it. Average possession varies not just team to team but league to league — La Liga historically averages higher possession numbers than the Championship, for example, which means raw defensive tallies from the two leagues are barely comparable. Adjusting to a common fifty-percent baseline makes the numbers at least somewhat portable.
The same logic extends to individual players mid-season transfers. A midfielder who moves from a press-heavy, low-possession side to a slow-build, high-possession side will see their raw tackle and interception numbers drop sharply. Without possession-adjustment, an analyst might incorrectly read that as a decline in effort or engagement.
The limits of the adjustment
Possession-adjustment corrects for opportunity, but it cannot correct for everything. Two caveats matter in practice.
First, the fifty-percent baseline is arbitrary. It is a convenient convention, not a physical law. A team normalised to fifty-fifty is a team that never existed, so pAdj values are best used for comparisons between teams, not as standalone absolute measures. Saying "Spain made 93.6 pAdj actions per match" means less in isolation than "Spain made more possession-adjusted defensive actions than any other team at the tournament."
Second, the adjustment treats all out-of-possession time as equivalent, but defensive intensity varies enormously within a match. A team in a 1–0 lead defending the last ten minutes will make different choices than the same team 0–0 in the first half. High-block pressing teams make defensive actions in the opposition half; low-block teams make them in their own. The formula cannot distinguish these contexts, so a team's pAdj total is a summary of their average out-of-possession behaviour across all game states — useful, but not a complete description of their defensive approach.
There is also a subtle mechanical dependency: possession-adjustment applied to attacking stats (progressive carries, touches in the box) uses the same formula but inverted — you adjust for in-possession time rather than out-of-possession time, replacing (1 − possession_share) with possession_share. Using the wrong version of the formula on the wrong type of stat is a common source of error.
Putting it into practice
Most major data providers — FBref, Understat, StatsBomb — now publish possession-adjusted stats alongside raw figures, often labelled with a "90" suffix to indicate they are per-90-minutes. When you see a defensive column in a data export, checking whether it is raw or pAdj is the first thing worth doing. The difference, as the Tunisia-vs-Spain comparison shows, can be enormous. Raw counts are not wrong — they tell you how much defending a team actually did. But if the question is how well a team defends, or how effective a player is out of possession, you want the adjusted version. Let the formula absorb the possession noise so you can focus on what is left.
Sources & further reading
- Free textbook: Chapter 11: Possession and Territorial Control — the theory behind this, at DataField.dev.
- StatsBomb open data — the event-level data for the 2022 World Cup used throughout this article.
- StatsBomb — documentation on their event data schema and possession metrics.
- FBref — publishes possession-adjusted defensive stats (via Opta) for major European leagues.
- Understat — match and season-level stats for the top European divisions.
More from Stat Explainers
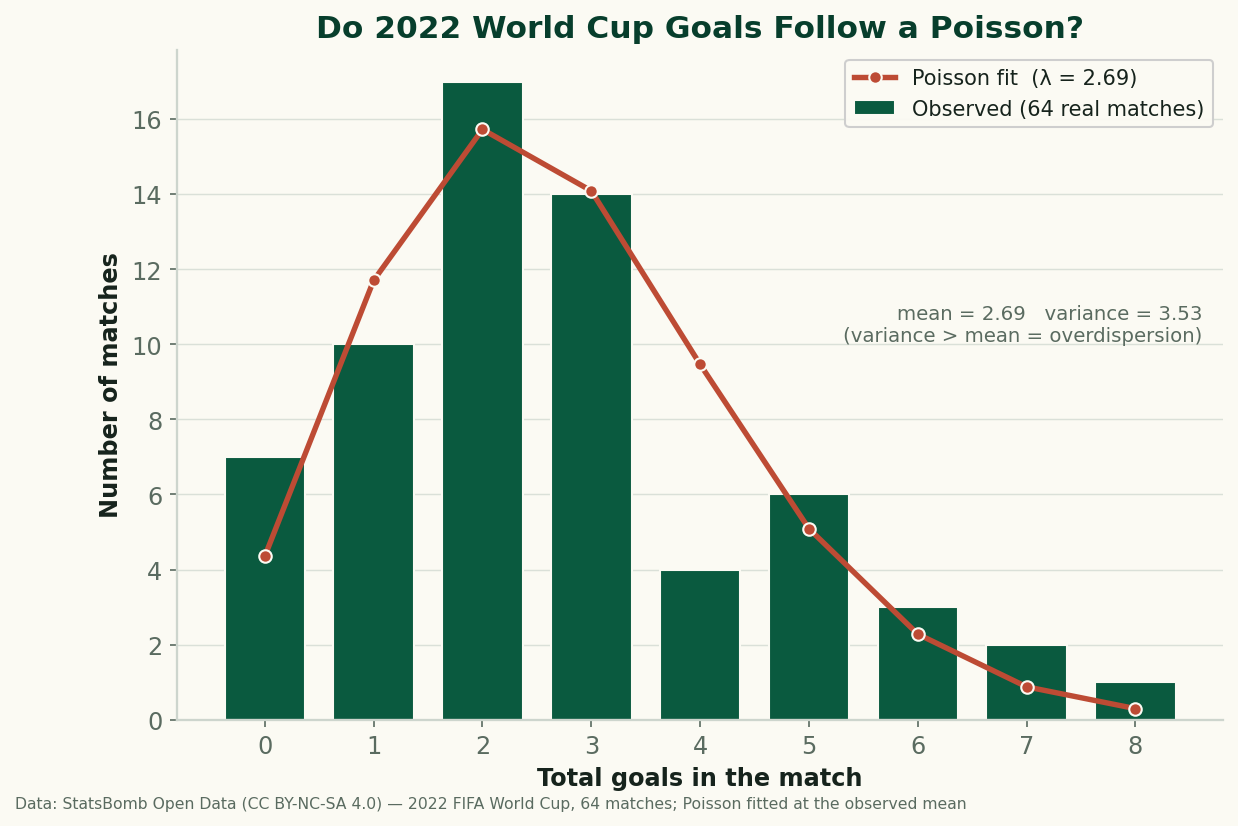
Do Football Goals Follow a Poisson? Testing the Standard Model on All 64 Games of 2022
Every scoreline prediction in football rests on the Poisson distribution. So I fit it to all 64 real matches of the 2022 World Cup and checked the residuals — it gets the shape right and fails in one specific, informative way: real goals are overdispersed. Here's why, with the formula and the code.
Aerial Duels and Heading Data: Reading Win Rate Without Getting Fooled by Volume
Aerial-duel win percentage, why raw counts mislead, where aerial dominance actually matters — set pieces, target men, defending crosses — and how to read heading data without confusing volume for quality.
Expected Points (xPts): Turning Shot-Level xG Into a Fairer Table
Expected points (xPts) simulates a match from its shot-level xG to get win, draw and loss probabilities, then a points total that rewards the chances a team created rather than the goals that happened to go in. How it is computed and what it reveals against the real table.