Expected Points (xPts): Turning Shot-Level xG Into a Fairer Table
A scoreline is one roll of the dice. xPts asks how the match would have ended on average.
Why should a season's worth of judgment hang on which way a couple of one-goal games happened to bounce? That question is what expected points exists to answer. A final score is a single sample from a noisy process: the same set of chances, replayed a hundred times, would not always end 2–1 — sometimes 1–1, sometimes 3–0 the other way. Rather than record who scored on the day, xPts asks what would have happened on average across all the matches those chances could have produced, and converts the answer into the points a team deserved. (For the xG foundation underneath all of this, start with expected goals explained; this piece is about what you build on top of it.)
From xG to points: the core idea
Every shot in a match carries an expected-goals value — the probability that a shot of that type, from that position, becomes a goal. Add up a team's shot xG and you get the goals an average finisher would have scored from those chances. Expected points goes one step further. Rather than collapsing all those probabilities into a single expected-goals number and comparing the two totals, it treats each shot as the independent coin-flip it really is and works out the full distribution of possible scorelines.
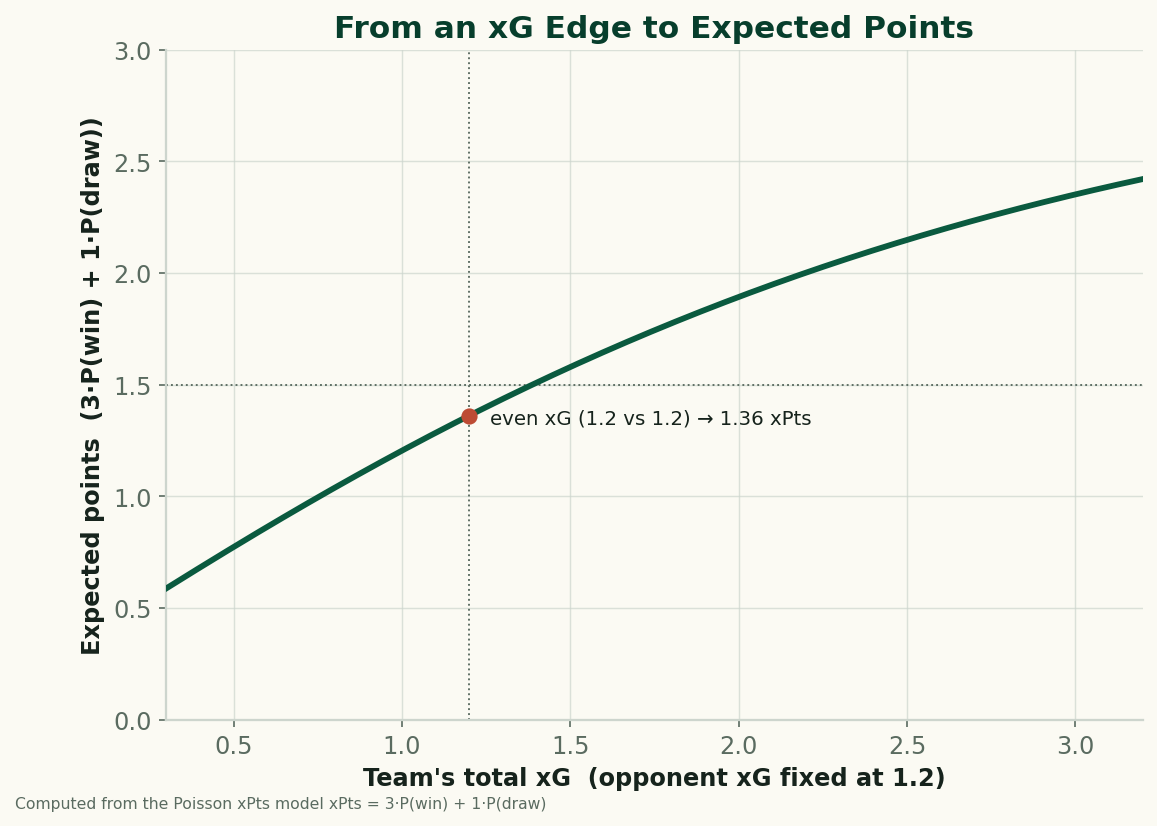
Once you have the probability of every plausible scoreline — 0–0, 1–0, 2–1, and so on — you can sort them into three buckets: the home team wins, the match is drawn, or the away team wins. Those three probabilities are the heart of xPts. Multiply them by the points football awards, and you have the points each side earned on average.
where the three probabilities come from the full distribution of scorelines implied by the match's shot-level xG.
The result is a number between 0 and 3 for each team in a match, and the two need not sum to 3 — a tight game where a draw is the most likely outcome can leave both sides on something like 1.4 expected points apiece, because the draw mass is shared. Summed across a season, each team's xPts is the points total they would have collected if every match had paid out according to the chances created rather than the goals that happened to go in.
How it is computed: two routes to the same place
There are two standard ways to turn shot-level xG into win/draw/loss probabilities, and they tend to agree closely.
Monte Carlo simulation
The most intuitive route is to simulate the match many times. For each simulated match, walk through every shot and flip a weighted coin: a shot worth 0.30 xG scores in 30% of simulations, a shot worth 0.05 scores in 5%, and so on. Tally each team's simulated goals, record who won, and repeat — ten thousand times, a hundred thousand times, however many it takes for the proportions to settle. The fraction of simulations the home team won is P(home win); the fraction drawn is P(draw); the rest is P(away win). It is brute force, and I'll admit it offends people who prefer a closed-form answer — but it is honest and transparent: you are literally replaying the match's chances over and over and counting what happens.
Poisson / convolution
The analytic route skips the dice. Because each shot is an independent Bernoulli trial with its own success probability, a team's goal total is a sum of independent Bernoulli variables — a Poisson-binomial distribution. You can compute the probability that a team scores exactly 0, 1, 2, … goals directly, then combine the two teams' goal distributions (a convolution) to get the probability of every scoreline. Sum the scorelines into win, draw and loss. A common simplification approximates each team's total with a single Poisson distribution whose mean is the team's total xG, which is faster and usually close, though it loses a little of the structure that comes from treating one big chance differently from several small ones.
A worked example
Take a hypothetical match to see the machinery turn. Suppose the home side takes four shots worth 0.40, 0.20, 0.10 and 0.05 xG (total 0.75), and the away side takes two shots worth 0.50 and 0.15 xG (total 0.65). Run the shot-by-shot distribution and you might find the home team wins about 42% of the time, the away team about 33%, and the match is drawn about 25%. That gives the home side roughly 3 × 0.42 + 1 × 0.25 ≈ 1.51 expected points and the away side roughly 3 × 0.33 + 1 × 0.25 ≈ 1.24. If the match actually finished 1–0 to the away team — their 0.50 chance going in, the home side's four chances all missing — the away side banks 3 real points against 1.24 expected, and the table records a result that the chances only half-deserved. (These numbers are an illustrative construction, not a real fixture.)
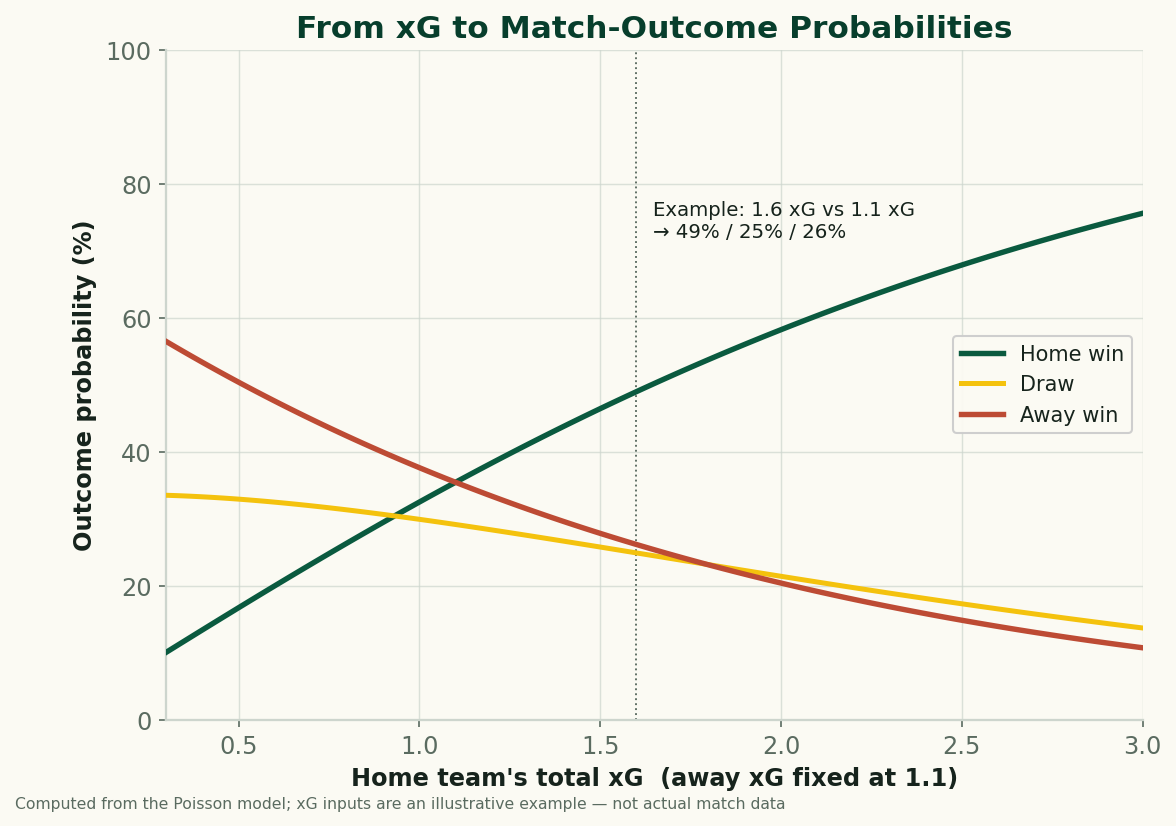
Try it: xG to outcome and xPoints
Enter two xG totals and watch the scoreline grid resolve into win, draw and loss probabilities — and the expected points each side banks. The classic worked case (home 1.6 xG, away 1.1) lands near a 49% home win, 26% draw and 25% away win, for about 1.74 home xPoints.
This calculator needs JavaScript. The method: model each team's goals as Poisson with mean equal to its total xG, build the scoreline grid, sum it into win / draw / loss, then xPoints = 3·P(win) + 1·P(draw).
Open this calculator on the tools page →
What it reveals against the real table
The point of an xPts table is the gap between it and the real one. Line the two up and the differences sort teams into stories.
Over-performers. A side sitting well above its expected points is converting a normal set of chances into an abnormal number of results — clinical finishing, hot goalkeeping, a run of late winners, or simple variance. Some of that is skill that may persist; much of it is luck that regression tends to claw back. Either way, the real table is flattering them relative to the process underneath.
Under-performers. The mirror image: a team creating and conceding chances like a mid-table side but losing the matches a coin-flip would have split differently. Their xPts says the points should come; the real table says they have not yet. These are the teams analysts flag as buys — the process is sound, the results just haven't arrived yet. (I'd add the usual caveat: "should come" is not "will come," and a team can under-run its xPts for a reason the model can't see.)
Confirmation. Often the two tables broadly agree, which is itself useful: it says a team's league position is built on the chances they create and concede, not on variance, and is therefore more likely to hold.
The cautions that keep xPts honest
xPts inherits every limitation of the xG it is built on and adds a few of its own. It assumes shots are independent, which ignores that a rebound and the shot that forced it are correlated events. It is silent about everything that is not a shot — a chance cleared off the line before the shot, the big opening a team failed to actually get a shot away from, the red card that warped the second half. Like all aggregate measures it is bent by game state: a team defending a lead takes fewer and worse shots on purpose, so a full-match xPts can understate a side that controlled the game and then shut up shop. And it is a small-sample instrument — over one match xPts is a soft suggestion, over a season it is one of the more honest tables you can build.
How to read it well
Treat xPts as the table the season would have produced if luck were evenly distributed, and read it next to the real one rather than instead of it. Where they diverge, ask why: a finishing streak, a goalkeeping run, a cluster of one-goal games that fell the wrong way. Trust it more over many matches than over few, split it by game state when you can, and remember that it values the chances that became shots — not the territorial control or chance suppression that a fuller possession-value model would capture. Used that way, expected points is the cleanest single answer to the question the league table cannot ask: not who won, but who deserved to.
Sources & further reading
- Free textbook: Chapter 9: Expected Threat (xT) and Ball Progression — the theory behind this, at DataField.dev.
- Understat — publishes xG-based expected points tables for the major European leagues.
- StatsBomb open data — shot-level xG you can use to compute xPts yourself.
- FBref — xG and results data for checking xPts against real outcomes.
- Expected points from xG in Python — a step-by-step build of an xPts table in code.
More from Stat Explainers
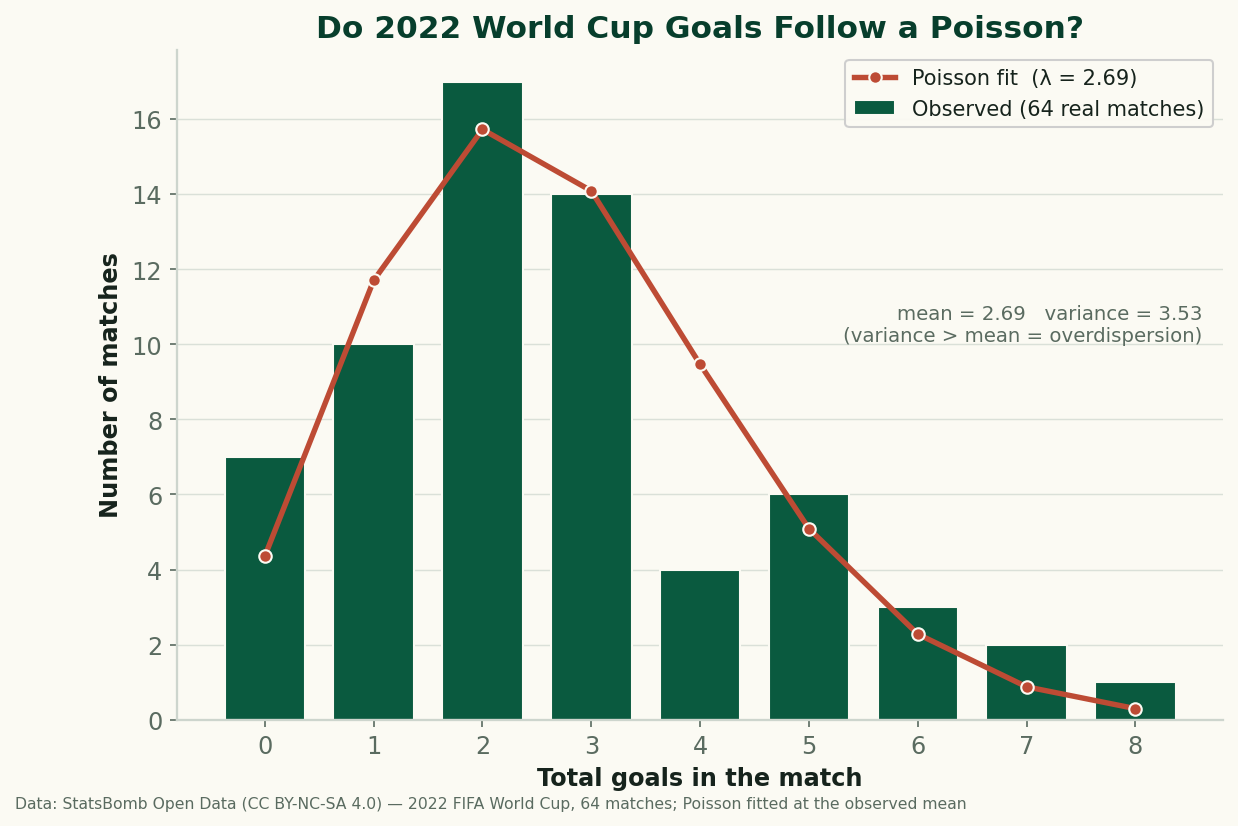
Do Football Goals Follow a Poisson? Testing the Standard Model on All 64 Games of 2022
Every scoreline prediction in football rests on the Poisson distribution. So I fit it to all 64 real matches of the 2022 World Cup and checked the residuals — it gets the shape right and fails in one specific, informative way: real goals are overdispersed. Here's why, with the formula and the code.
Aerial Duels and Heading Data: Reading Win Rate Without Getting Fooled by Volume
Aerial-duel win percentage, why raw counts mislead, where aerial dominance actually matters — set pieces, target men, defending crosses — and how to read heading data without confusing volume for quality.
Goalkeeper Distribution and Playing Out From the Back: Reading the Numbers Behind Buildup
Short versus long goalkeeper distribution, launch %, pass completion under pressure, and how a keeper's distribution choices shape a team's buildup. How to read the data without mistaking a stylistic choice for a skill.