The USA's World Cup, by the Numbers: A Home Run That Thinned Out
The United States held the ball in every round of its home World Cup and left it in the round of 16 anyway. The post-mortem is in one column of the stat sheet — the attack produced two shots on target a game from the group stage onward.
The United States is out of its own World Cup, beaten 1–4 by Belgium in the round of 16, and the autopsy doesn’t require a single replay. Across five games the Americans held 56.8% of the ball on average — a share that would sit comfortably among the qualified quarter-finalists we profiled, above Norway’s and within two points of England’s — and their shots-on-target line reads 6, 2, 7, 2, 2. After the opener, the host’s attack managed two shots on target in three of four games. Possession was never the problem. What the possession produced was.
Sourcing. All numbers computed from our bundled match dataset — 94 completed matches as of July 7, from ESPN’s public scoreboard and match-summary feeds, served raw at /data/wc2026_results.json. The feed is team-level (scores, possession, shots, cards); no player data, so this is a team post-mortem by design.
The file
| Date | Result | Possession | Shots (on target) | Opponent shots (on target) |
|---|---|---|---|---|
| Jun 12 | USA 4–1 Paraguay | 65% | 16 (6) | 9 (1) |
| Jun 19 | USA 2–0 Australia | 62% | 10 (2) | 5 (2) |
| Jun 25 | USA 2–3 Türkiye | 53% | 18 (7) | 9 (3) |
| Jul 1 | USA 2–0 Bosnia-Herzegovina | 48% | 8 (2) | 10 (3) |
| Jul 6 | USA 1–4 Belgium | 56% | 7 (2) | 15 (7) |
Totals: 3W–2L, 11 scored, 8 conceded, 59 shots, 19 on target. The record was never embarrassing — two group wins, a competitive defeat to Türkiye, a clean round-of-32 win — and the exit was still the joint-heaviest of the six round-of-16 ties played so far, level with Canada’s 0–3 against Morocco.
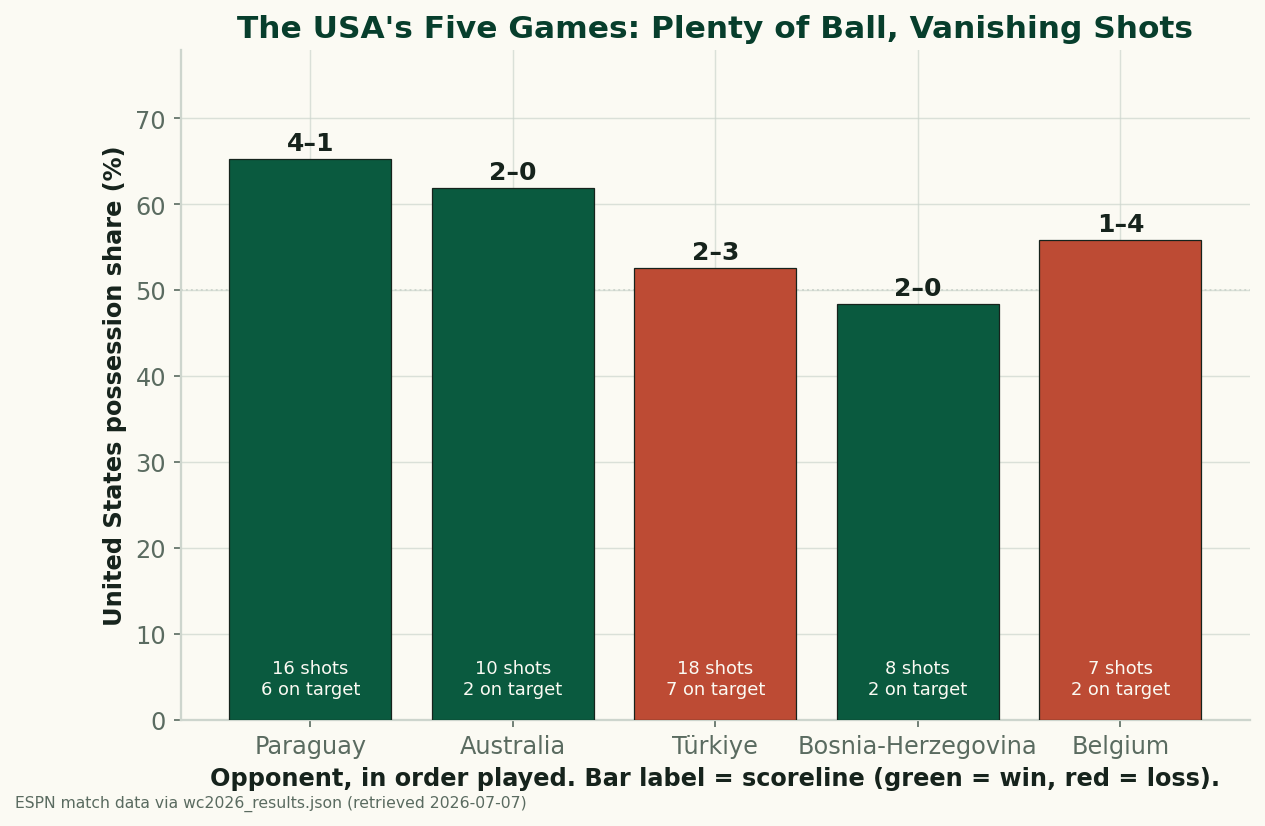
The attack shrank a round at a time
Strip out the opener and the pattern is stark. Against Paraguay the US produced 16 shots and 6 on target — a genuine, functioning attack. From there: 10 shots, then 18 in the wild Türkiye game, then 8 against Bosnia and 7 against Belgium — the two knockout games were the team’s two thinnest attacking nights of the tournament, against progressively better opponents. The conversion rate stayed excellent to the end (11 goals from 59 shots is 18.6%, well above the tournament’s 11.8% average), which is precisely what made the record look healthier than the process: finishing efficiency was papering over declining volume. We’ve documented all tournament that shots on target is the stat that separates winners here — on the night that ended the run, Belgium won that count 7 to 2.
The Belgium game wasn’t a smash-and-grab
It would be comforting to file the exit under knockout randomness — a coin-flip tie that bounced wrong. The stat line refuses. Belgium conceded the ball (44%) and still doubled the American shot count 15–7, tripled the on-target count 7–2, and scored four. Of the six round-of-16 ties completed, it shares the widest margin (with Morocco’s 3–0) and stands alone as the most winner-dominated shot count. In the round’s running note we tracked how the early “busier attack loses” quirk evened out to 3–3; Belgium’s win was the corrective case in point — volume and precision and the result, all on the same side for once.
What the host file says in context
Three hosts entered this World Cup; all three are out at the round of 16, on consecutive nights — Canada without scoring against Morocco, Mexico in a five-goal classic against England, and the US in the round’s heaviest defeat. The American file is the strangest of the three: Canada and Mexico were out-created in their exits by teams playing sharper football, while the US spent five games looking like the protagonist — majority possession in four of five — and generating the shot volume of a counter-punching side without a counter-punching side’s efficiency excuse. Norway, profiled here, made the same low volume lethal by hitting 47% of shots on target; the US hit 32%. Same tournament, same possession-heavy profiles on paper — a quarter-final berth of difference in the execution.
Honest limitations
- Team-level data only. Our feed has no shot locations, no xG, no player events for 2026 — so “the attack thinned” is measured in volume and accuracy, not chance quality. The shape of the decline is unambiguous; its tactical cause is outside this dataset.
- Five games, one of them chaotic. The Türkiye defeat (18 shots, 7 on target, still lost) fits the efficiency story awkwardly, and with n=5 nothing here is a skill estimate — it’s a record of what happened.
- Group context matters. Türkiye beat the US and then failed to reach the round of 32 at all — group results and knockout results are different tests, and the US passed one of them.
- No what-ifs. Our data can’t say what a different bracket would have produced, so this piece doesn’t either.
Sources
- Match results and team stats: ESPN public scoreboard + match-summary APIs, parsed to
data_layer/wc2026_results.json(94 completed matches, retrieved 2026-07-07); raw snapshot served at /data/wc2026_results.json. Chart:charts/chart_wc2026_usa.py. - Related: all three hosts are out (the round’s running note), Norway’s World Cup, by the numbers (the profile format’s other half), and what wins games at this World Cup.
More from World Cup 2026
The 2026 Dark-Horse Audit: Grading Our June Checklist
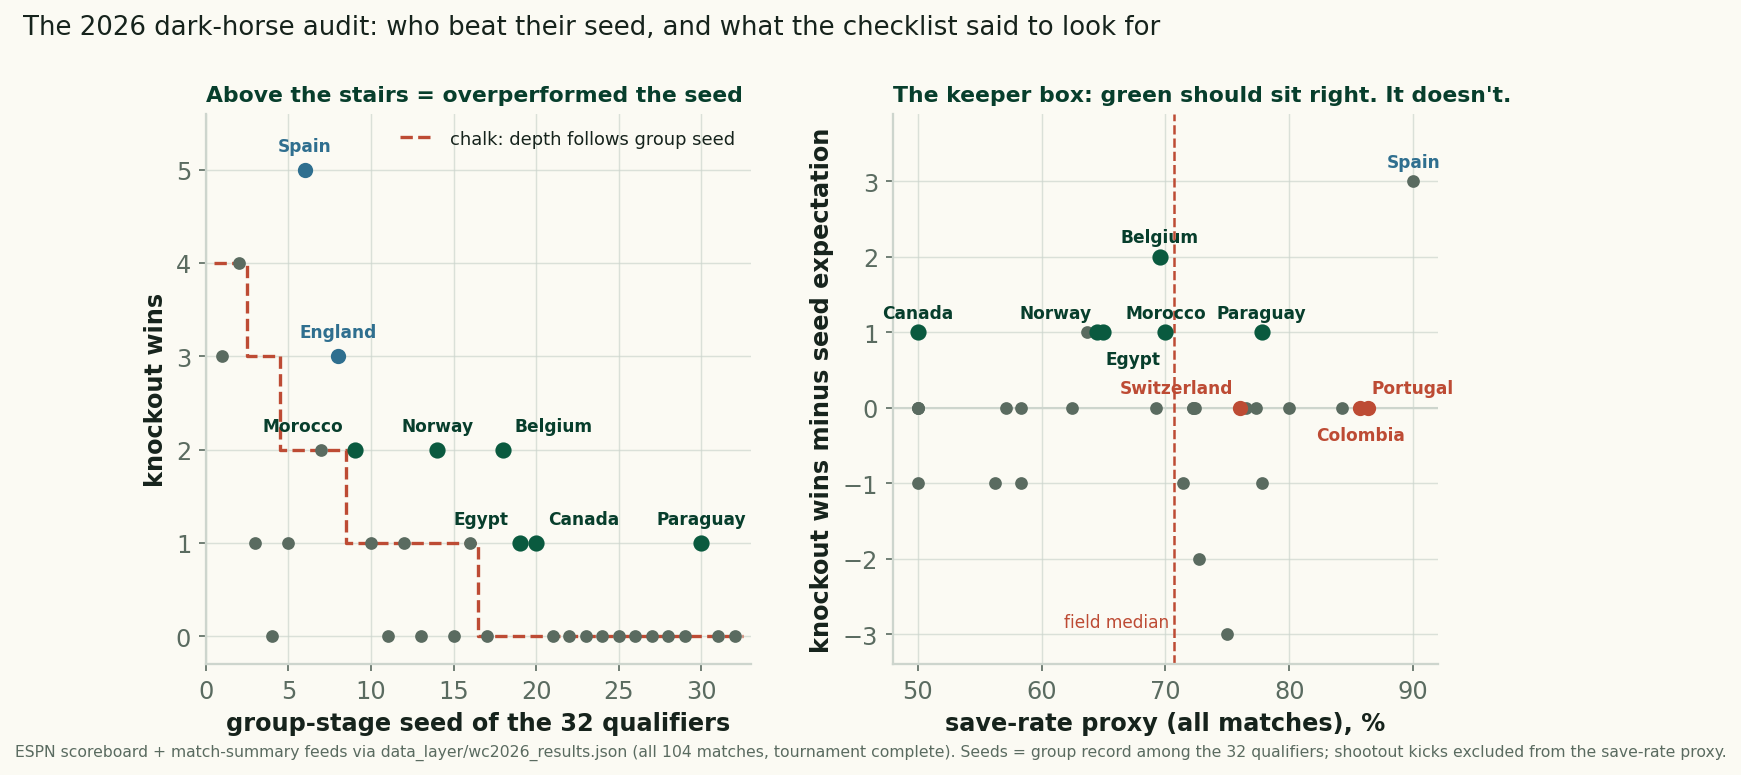
Six teams beat their group seed at the 2026 World Cup, scored against our pre-tournament checklist: the keeper box failed, the kind draw barely helped.
The Shootouts: Rarer, Earlier, and a Reprieve That Never Lasted
Retro #4 closes the series: the shootout rate fell to 12.5% of knockout games from 2022's 31%, all four came early, and survivors went 1-3 next time out.
The Groups Told the Truth: How June Predicted July at the 2026 World Cup
Group-stage points strongly predicted knockout survival: 9-point teams went 3-for-3, 4-point teams 2-for-11, and the last four all ranked top-8.