The First Four Quarter-Finalists, by the Numbers
Half the quarter-final field is set. Five games into their tournaments, the four teams already through share exactly one trait — they all finish better than the field — and differ on almost everything else.
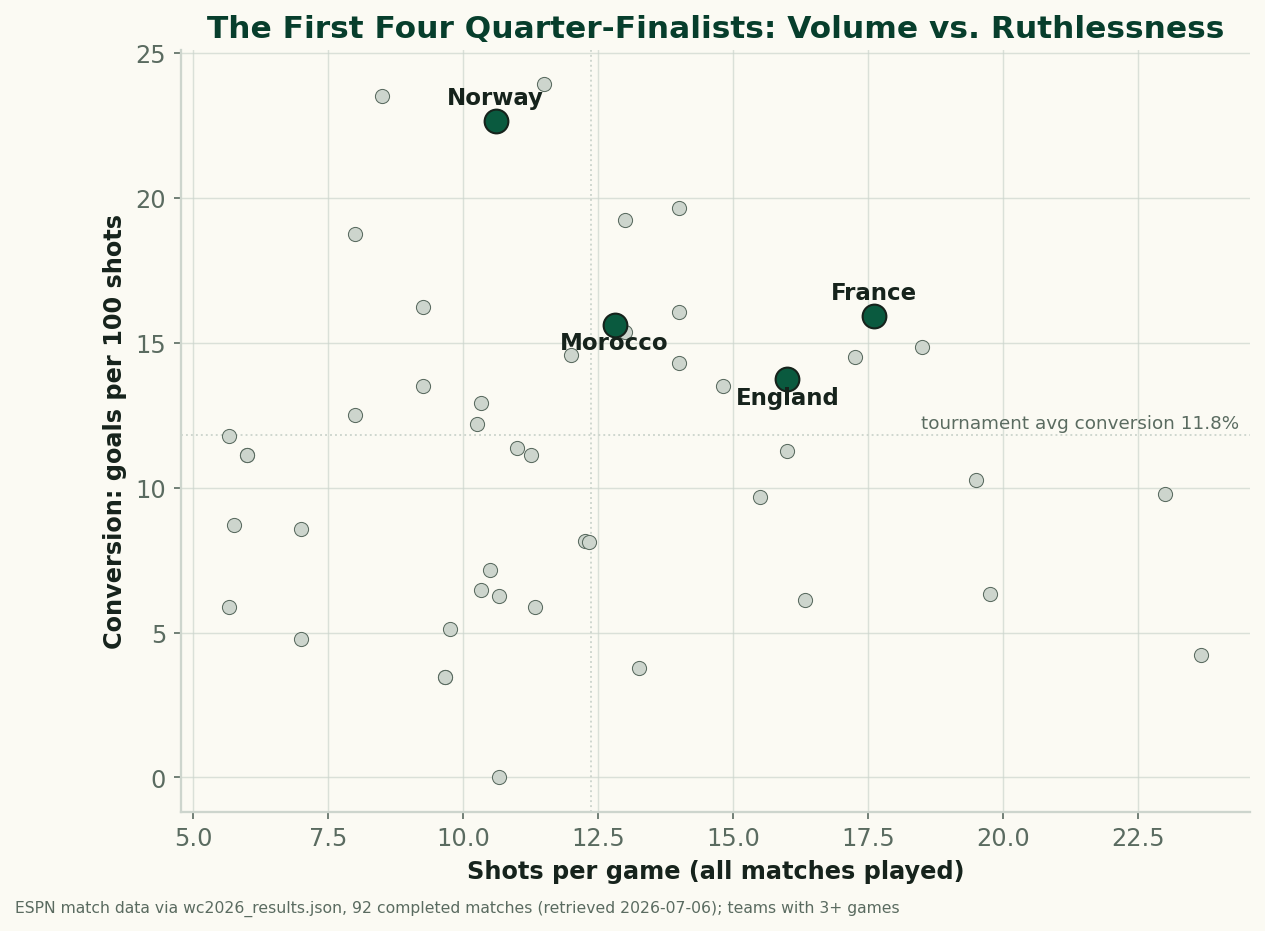
Four of the eight quarter-final places are filled: Morocco, France, Norway and England. They got there by four very different routes — a possession side that refuses to lose, a favourite winning on schedule, an underdog converting at nearly twice the tournament rate, and a heavyweight that just survived the round’s wildest game. Five matches into each of their tournaments, the profiles below are what the data actually says about them. The one thing all four share: every one of them finishes above the tournament’s average conversion rate.
Sourcing. Everything here is computed from our bundled match dataset — 92 completed matches as of July 6, from ESPN’s public scoreboard and match-summary feeds, served raw at /data/wc2026_results.json. Per-team numbers aggregate each side’s five games (three group matches, a round of 32, a round of 16). The other four quarter-finalists weren’t decided when this was written; we’ll profile them the same way once the round of 16 finishes — no predictions about who they’ll be.
The four, side by side
| Team | Record | GF–GA | Avg possession | Shots/game | On target/game | Conversion |
|---|---|---|---|---|---|---|
| France | 5W–0D–0L | 14–2 | 60.5% | 17.6 | 7.8 | 15.9% |
| England | 4W–1D–0L | 11–5 | 58.1% | 16.0 | 6.4 | 13.8% |
| Morocco | 3W–2D–0L | 10–4 | 60.4% | 12.8 | 5.0 | 15.6% |
| Norway | 4W–0D–1L | 12–9 | 53.1% | 10.6 | 5.0 | 22.6% |
France: the favourite behaving like one
France’s file is the least surprising and the most complete: five wins from five, 14 scored, 2 conceded, and the double of volume and quality — most shots per game of the four (17.6), most on target (7.8), converting at 15.9%. The round of 32 was a 3–0 stroll past Sweden; the round of 16 a 1–0 win over Paraguay in which they held 76% of the ball, their highest control figure of the tournament. Their 4–1 group-stage dismantling of Norway is, so far, the only defeat on any quarter-finalist’s record. Two goals conceded in five games is the best defensive line among the four, and it isn’t close to their leakiest rival’s.
England: heavyweight numbers, one strange blank, one wild night
England’s five games contain the tournament’s tidiest cautionary tale about reading possession. Their only dropped points came in a 0–0 with Ghana in which they had 79% of the ball and put just 3 of 19 shots on target. Their round of 16 was the mirror image: 33% possession against Mexico, six shots all night — and a 3–2 win, because five of the six were on target and three went in. Between those extremes they've been steadily excellent: 4–2 over Croatia, 2–0 Panama, 2–1 Congo DR, 16 shots a game across the run. We wrote in the group stage that shots on target, not possession, separates winners here; England have now personally demonstrated both halves of that finding.
Morocco: still unbeaten, and quietly heavy control
The 2022 semi-finalists are unbeaten through five games, and their 2026 file shows a team that has upgraded from counter-punchers to a control side: 60.4% average possession — essentially level with France — against more modest shot volume (12.8 a game). They have not lost in five: 1–1 with Brazil in the group, wins over Scotland and Haiti, a 1–1 with the Netherlands in the round of 32 that they survived on penalties, then the knockout stage’s joint-biggest statement so far, 3–0 over co-host Canada from just five shots. Ten scored, four conceded, and a conversion rate (15.6%) that sits fourth among all teams still alive. The penalty shootout they came through is one of only three so far — we measured what shootouts do to penalty conversion here.
Norway: the outlier
Norway’s row on the table barely looks like it belongs at this stage of a World Cup: the fewest shots per game of the four (10.6), the most goals conceded (nine — they haven’t kept a clean sheet all tournament), and a 22.6% conversion rate that is the highest of any team still in the competition. Only two sides in the whole 48-team field finished their tournaments converting better — the Netherlands (23.9%) and Japan (23.5%) — and both are already out, which says something about how far finishing alone carries you and how remarkable it is that Norway keep converting anyway. Their round of 16 win over Brazil, in which they held 66% of the ball, gets a full profile of its own.
What the four have in common
Almost nothing stylistically — which is the honest headline. Possession ranges from Norway’s 53% to France’s 60.5%; shot volume from 10.6 to 17.6 a game. The single shared trait is that all four convert above the tournament’s 11.8% average — France and Morocco by about four points, England by two, Norway by nearly eleven. Through 92 games, this tournament has repeatedly shown that chance quality and finishing, not chance volume, decides knockout ties; the four survivors so far are a clean sample of exactly that pattern. Whether it holds through the last eight is a question the next two weeks answer — finishing rates are the least stable stat in football, a regression warning we’ve documented on 2022’s full shot data.
Honest limitations
- Five games is five games. These profiles describe what happened; they are not power ratings. A single red card or an early goal reshapes every rate in a sample this size.
- No shot coordinates for 2026 exist publicly, so there is no xG here — conversion is goals over raw shots, which mixes chance quality with finishing. Our 2022 work separates those; for 2026 we can’t yet.
- Opponent strength is unadjusted. France’s five opponents and Morocco’s five are not the same difficulty, and the numbers don’t pretend otherwise.
- Half the field is missing. The United States, Spain, Portugal, Switzerland, Argentina, Colombia, Belgium and the Australia–Egypt survivor still contest the remaining four places. Part two profiles them when they’re real, not before.
Sources
- Match results and team stats: ESPN public scoreboard + match-summary APIs, parsed to
data_layer/wc2026_results.json(92 completed matches, retrieved 2026-07-06); raw snapshot served at /data/wc2026_results.json. Chart:charts/chart_wc2026_qf_first_four.py. - Related: the round of 16 at halfway, the knockout stage by the numbers, and Norway’s World Cup, quantified.
- The World Cup hub collects the whole 2026 series, including the self-updating tournament dashboard.
More from World Cup 2026
The 2026 Dark-Horse Audit: Grading Our June Checklist
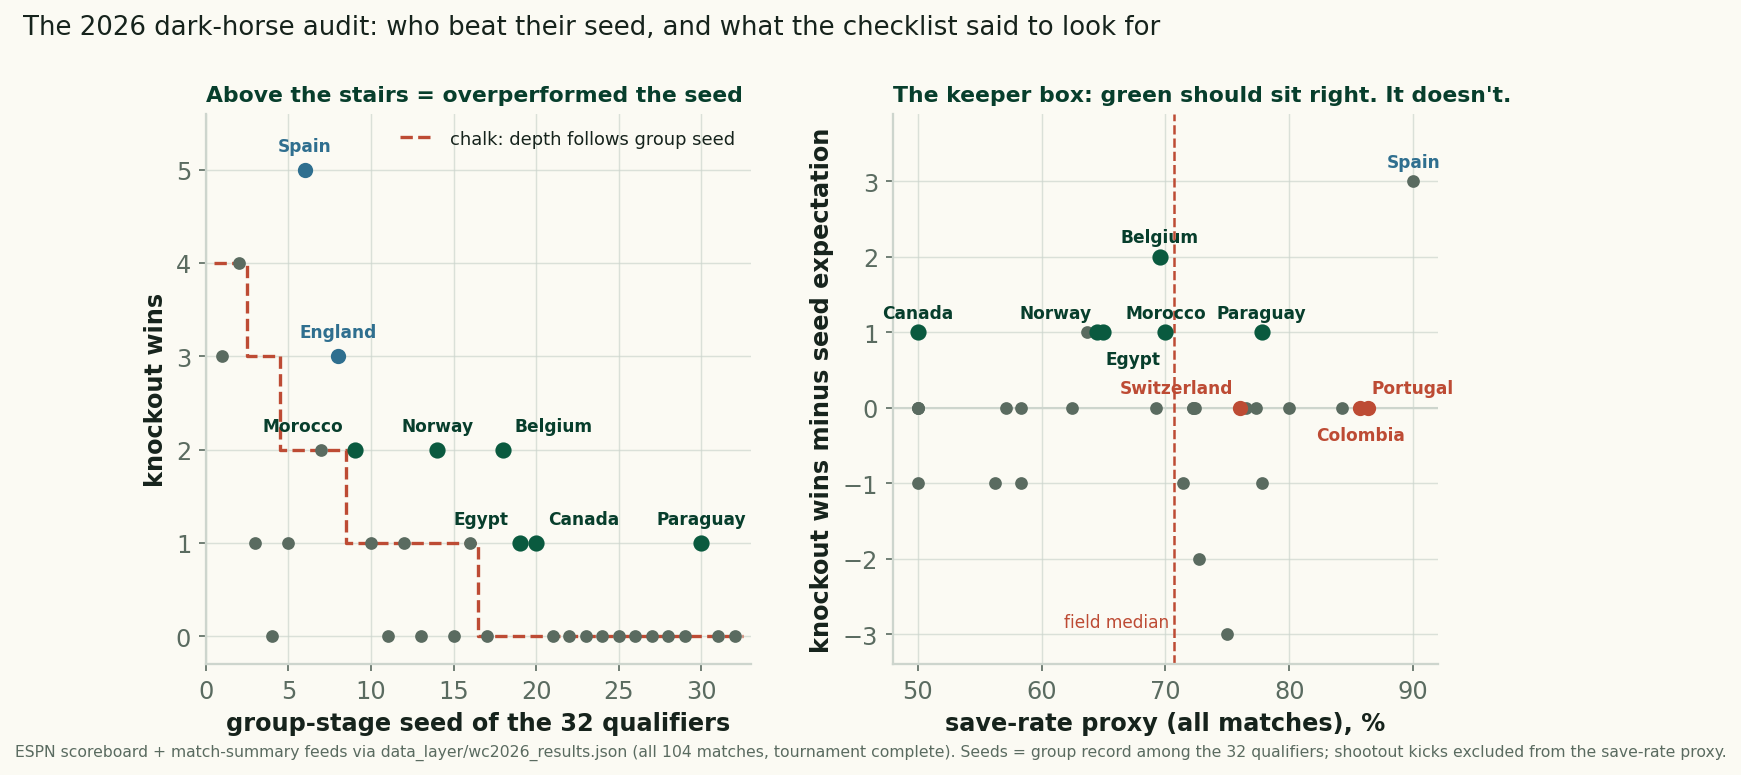
Six teams beat their group seed at the 2026 World Cup, scored against our pre-tournament checklist: the keeper box failed, the kind draw barely helped.
The Shootouts: Rarer, Earlier, and a Reprieve That Never Lasted
Retro #4 closes the series: the shootout rate fell to 12.5% of knockout games from 2022's 31%, all four came early, and survivors went 1-3 next time out.
The Groups Told the Truth: How June Predicted July at the 2026 World Cup
Group-stage points strongly predicted knockout survival: 9-point teams went 3-for-3, 4-point teams 2-for-11, and the last four all ranked top-8.