Expected Goals (xG) Explained: The Stat That Changed How We Watch Football
What xG measures, how the model is built, and how to read it without getting fooled.
Twenty years ago, a shot was a shot. Now every televised chance flashes an expected-goals value before the ball has stopped rolling, and "but the xG…" has become the way arguments about football are won and lost. It is the most important number in the modern game, and also the most misunderstood. Here is what it actually says.
What expected goals actually measures
Expected goals, or xG, is a single number attached to a single shot: the probability that a shot taken from that position, in that situation, becomes a goal. It runs from 0 to 1. A tap-in from two yards might be worth 0.9 xG — nine times out of ten, it's a goal. A hopeful dig from thirty yards might be 0.03 — you'd expect it to go in about once every thirty-three attempts. Add up every shot a team takes in a match and you get the team's xG: the number of goals an average finisher would have scored from those chances.
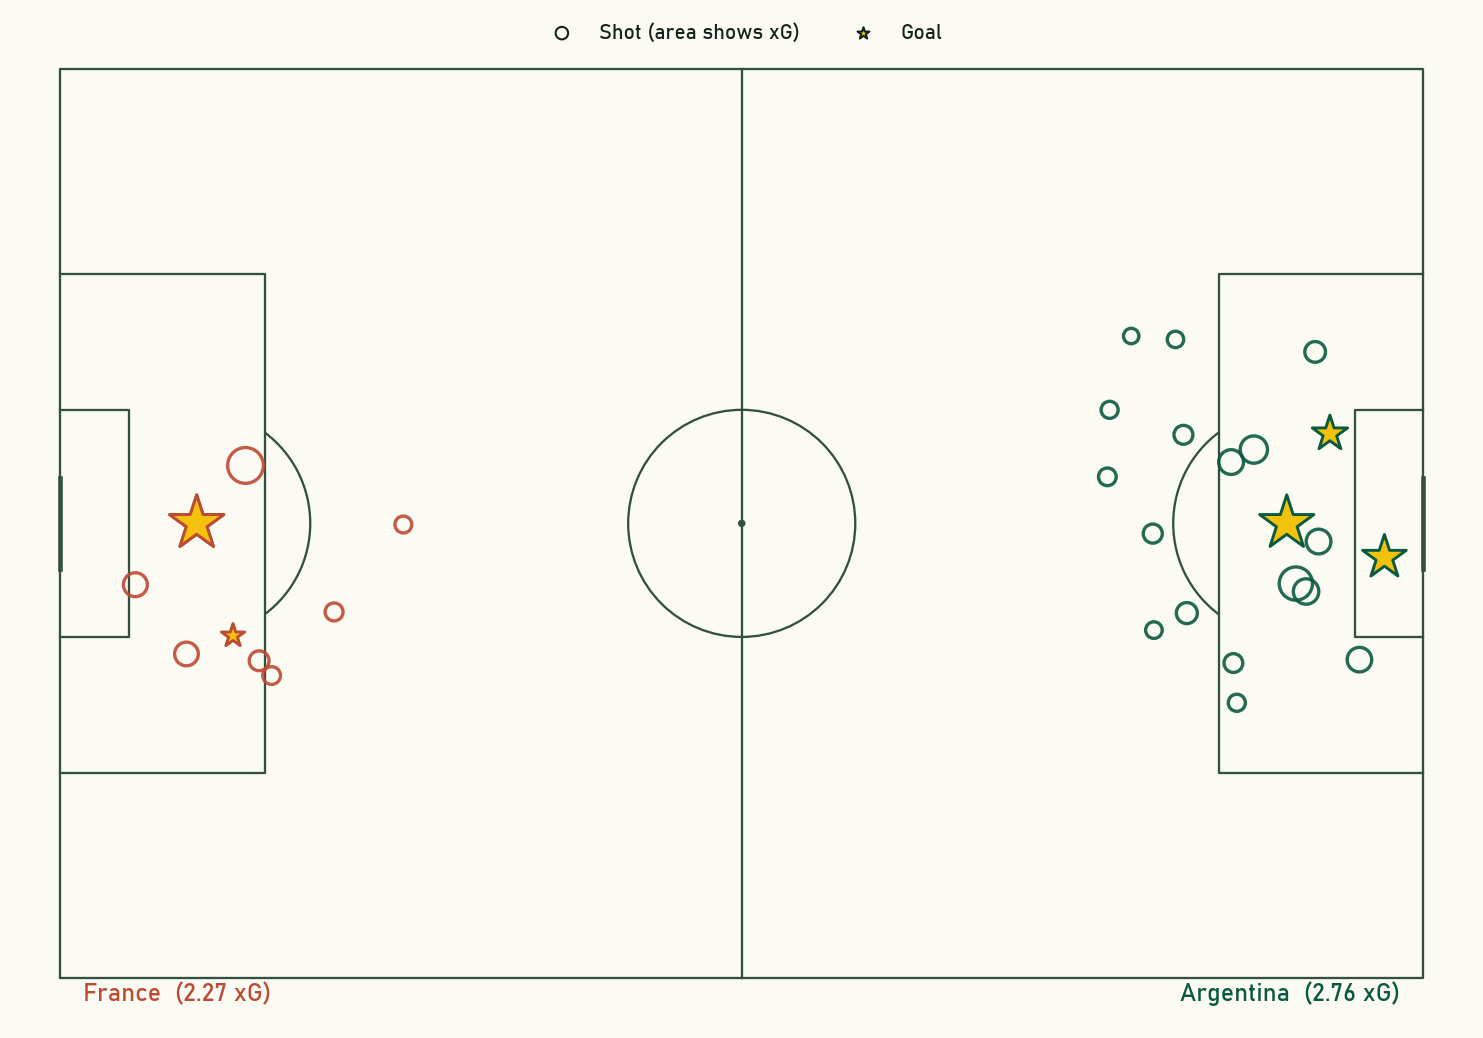
That reframing is the whole point. A 1–0 scoreline tells you who won. The xG tells you whether the winner deserved to — whether they manufactured better chances or simply had a better afternoon in front of goal. Take the 2022 World Cup final, a 3–3 epic that Argentina won on penalties. Strip out the shootout and the underlying numbers were less of a coin-flip than the scoreline suggested.
Argentina out-created France 2.76 to 2.27 and out-shot them two to one. France's evening was a monument to finishing: three goals — two of them Kylian Mbappé penalties and a half-volley — from 2.27 xG and ten shots. The single biggest chance of the match belonged to Lionel Messi, a penalty worth 0.78 xG, which he scored. That is xG in one game: not a verdict, but a much fuller account of the story than the final score.
How an xG model is actually trained
An xG model is not a panel of pundits assigning gut-feel difficulty scores. It is a machine-learning model trained on hundreds of thousands of historical shots, each one labelled with whether it was scored. The model learns, from that mountain of evidence, how the features of a shot map to the probability of a goal.
The features that matter most are geometric, and they are exactly the ones your eyes already use:
- Distance to goal. The single strongest predictor. Closer is better, and the relationship is steep.
- Angle to goal. How much of the goal mouth the shooter can actually see. A shot from the byline has almost nothing to aim at, even from close range.
- Body part. Headers convert worse than the equivalent shot with the feet; a header from the penalty spot is a different proposition from a volley there.
- Type of chance. Was it a fast break with the defence scrambling, a set-piece scramble, a penalty (a near-constant 0.76-ish), a one-on-one with the keeper?
- Defenders and the goalkeeper. The richest datasets — StatsBomb's among them — record the exact position of every defender and the keeper at the instant of the shot, so the model knows whether the shooter was crowded out or clean through.
Feed those features into a model — historically a logistic regression, now usually a gradient-boosted ensemble — and out comes a probability. Crucially, the model is fit on what actually happened to similar shots, not on anyone's opinion. When it says 0.107, it means: across all the shots that have ever looked like this one, about 11 in 100 were scored.
Does it actually work? The calibration test
A probability model is only as good as its calibration: when it says 0.20, do those shots really go in about a fifth of the time? The honest way to check is to bin a big pile of shots by some feature, then compare the model's average xG in each bin against how often those shots were actually scored. If the model is any good, the two lines should sit on top of each other.
Here is that test run on every open-play shot at the 2022 World Cup — 1,425 of them — grouped by distance from goal.
| Distance band | Shots | Mean xG (model) | Actual conversion |
|---|---|---|---|
| 0–6 yards | 50 | 0.43 | 44% |
| 6–12 yards | 314 | 0.16 | 19% |
| 12–18 yards | 366 | 0.11 | 13% |
| 18–24 yards | 314 | 0.05 | 5% |
| 24–40 yards | 381 | 0.02 | 2% |
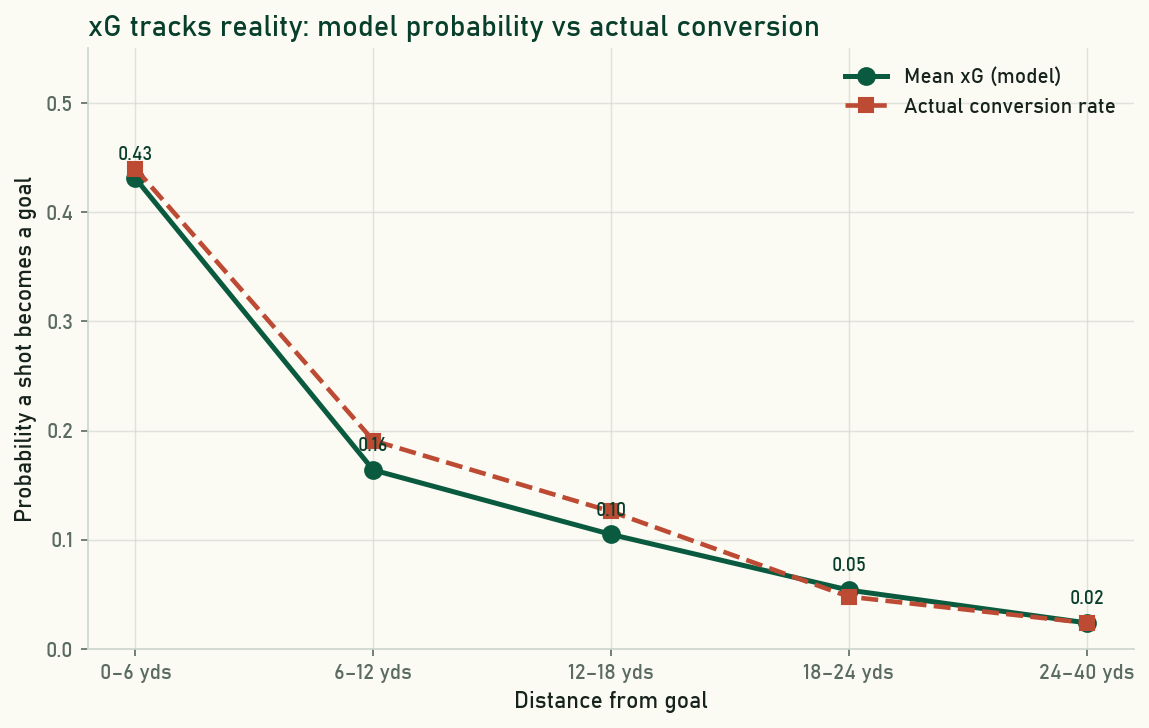
Band by band, the model's average probability lands within a couple of points of reality. That is what "xG works" means in practice: not that it predicts any single shot — it can't, and doesn't try — but that across many shots its probabilities come true. The average World Cup shot was worth 0.107 xG, and the tournament's 1,453 shots produced 169 goals. The model knew that before a ball was kicked.
What xG is good for — and what it isn't
xG is a sample-size instrument. Over a season it is one of the most predictive numbers in football: teams that consistently create more than they concede tend to climb, and a side massively outscoring its xG is usually living on borrowed time. Over ninety minutes it is noisier — a single fluke screamer or a missed sitter can flip the xG narrative, which is why "they lost the xG battle" is a thin argument about one game and a strong one about ten.
The most common abuse is treating xG as a measure of finishing. It isn't; it's a measure of chance quality. A striker who repeatedly outscores his xG might be an elite finisher — or might be on a hot streak that regression will quietly end. The honest stance is humility: xG tells you how good the chances were, and the gap between xG and goals is a question to investigate, not an answer to brandish. Used that way, it really did change how we watch the game.
Sources & further reading
- Free textbook: Chapter 7: Expected Goals (xG) Models — the theory behind this, at DataField.dev.
- StatsBomb open data — the shot-level data and xG values used throughout this article.
- StatsBomb — primers on their xG model and what its freeze-frame features add.
- Understat — season-long xG tables for the major European leagues.
- FBref — xG and advanced data (via Opta) for a wide range of competitions.
More from Stat Explainers
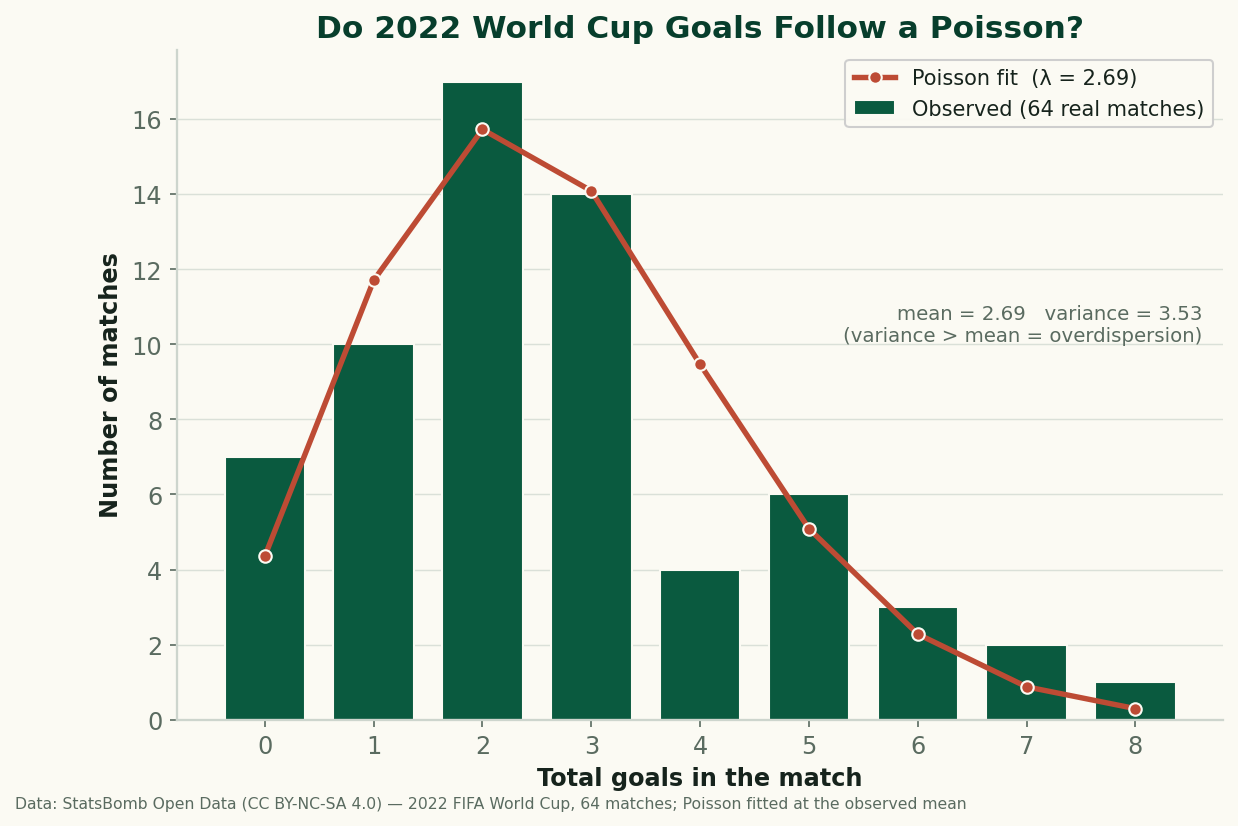
Do Football Goals Follow a Poisson? Testing the Standard Model on All 64 Games of 2022
Every scoreline prediction in football rests on the Poisson distribution. So I fit it to all 64 real matches of the 2022 World Cup and checked the residuals — it gets the shape right and fails in one specific, informative way: real goals are overdispersed. Here's why, with the formula and the code.
Aerial Duels and Heading Data: Reading Win Rate Without Getting Fooled by Volume
Aerial-duel win percentage, why raw counts mislead, where aerial dominance actually matters — set pieces, target men, defending crosses — and how to read heading data without confusing volume for quality.
Expected Points (xPts): Turning Shot-Level xG Into a Fairer Table
Expected points (xPts) simulates a match from its shot-level xG to get win, draw and loss probabilities, then a points total that rewards the chances a team created rather than the goals that happened to go in. How it is computed and what it reveals against the real table.