xA and Expected Threat: Measuring Creativity Beyond Assists
Why assists undersell creators, and how xA and xT fix it.
Here is my problem with the assist as a statistic: it credits the wrong skill to the wrong player. Thread a defence-splitting pass to a striker who is clean through, watch him blaze it over the bar, and you get nothing on the scoresheet. Roll a lazy square ball to a teammate who taps into an empty net from six yards, and you get an assist — officially the identical creative contribution. An assist isn't really a measure of creativity at all; it is an accounting of other people's finishing, filed under your name. Expected assists (xA) and expected threat (xT) are the two metrics that try to fix that, and they fix it in different ways.
What expected assists actually measure
xA attaches the xG of the resulting shot to the player who created it, rather than to whether the ball happened to go in. The mechanic is almost insultingly simple, and that simplicity is the point: for every pass a player makes that leads directly to a shot, they bank the shot's xG value as credit. Sum those across any time period and you have their xA.
That means a player who consistently finds teammates in the penalty area with good looks at goal will accumulate high xA whether or not those teammates convert. The finisher's luck — or skill — is stripped out. A through-ball that sets up a 0.4 xG shot from the penalty spot counts as 0.4 xA, always, regardless of what happens next.
The contrast with assists is pointed. The most common ways raw assists inflate the wrong player: tap-ins where the "assist" was a routine corner; set-piece deliveries where the scorer did all the work with their head; deflected crosses that bobbled in off a defender. And the ways assists undercount real creators: the player who generated twelve 0.4 xG shots whose strikers missed every one, or the playmaker who was dispossessed the moment before a teammate scored and so appears on no record at all.
The 2022 World Cup xA leaders
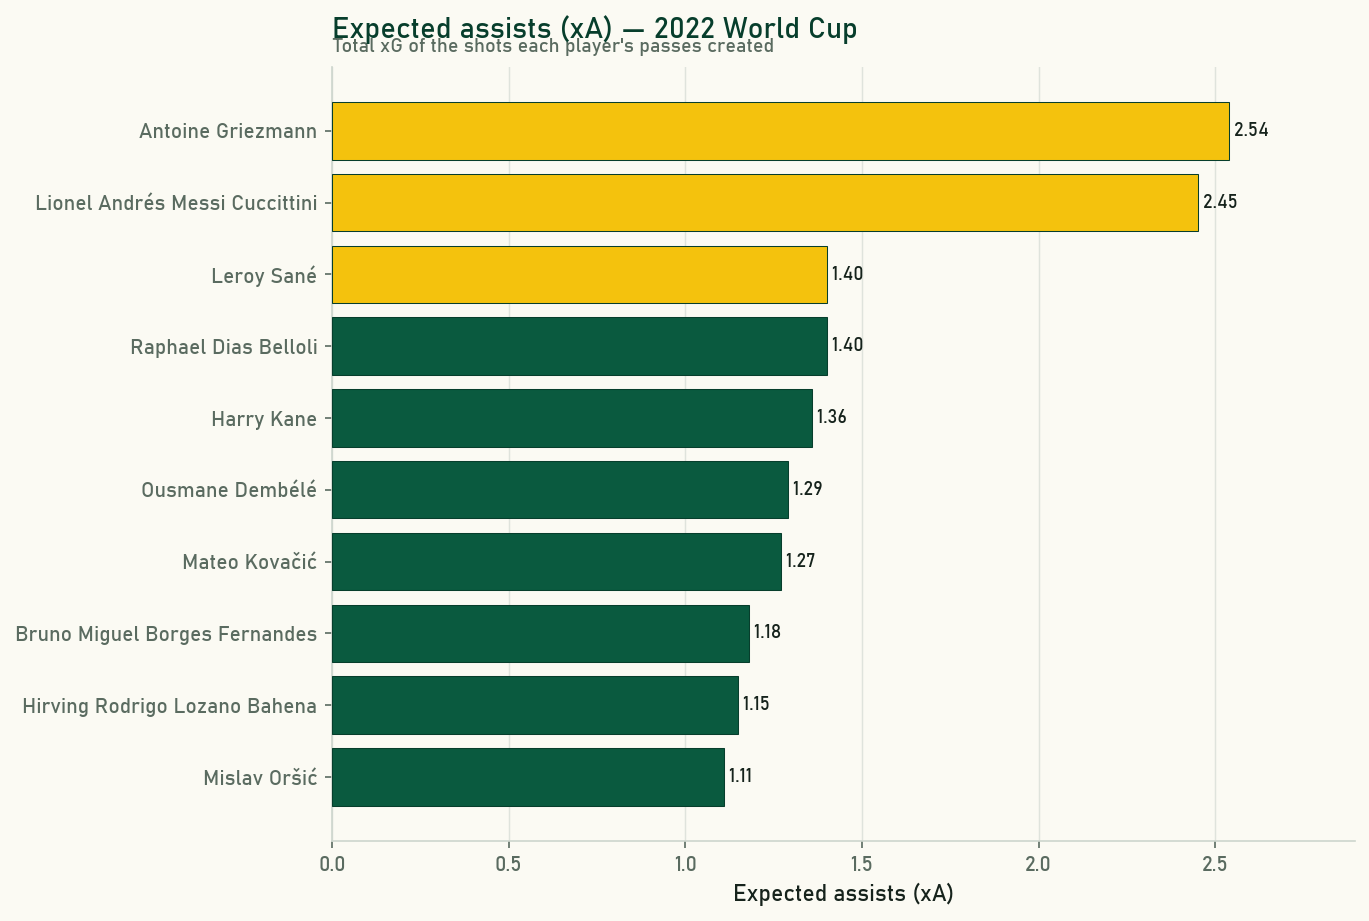
The 2022 World Cup across 64 matches provides a clean sample with every chance built from StatsBomb's detailed event data. The xA leader was Antoine Griezmann — and I'd wager he isn't the first name that comes to mind when you think "World Cup creative force." He ended up with 2.54 xA, edging Lionel Messi at 2.45. Both numbers capture something the raw assist counts buried entirely.
| Player | xA |
|---|---|
| Antoine Griezmann | 2.54 |
| Lionel Andrés Messi Cuccittini | 2.45 |
| Leroy Sané | 1.40 |
| Raphael Dias Belloli (Raphinha) | 1.40 |
| Harry Kane | 1.36 |
| Ousmane Dembélé | 1.29 |
| Mateo Kovačić | 1.27 |
| Bruno Miguel Borges Fernandes | 1.18 |
| Hirving Rodrigo Lozano Bahena | 1.15 |
| Mislav Oršić | 1.11 |
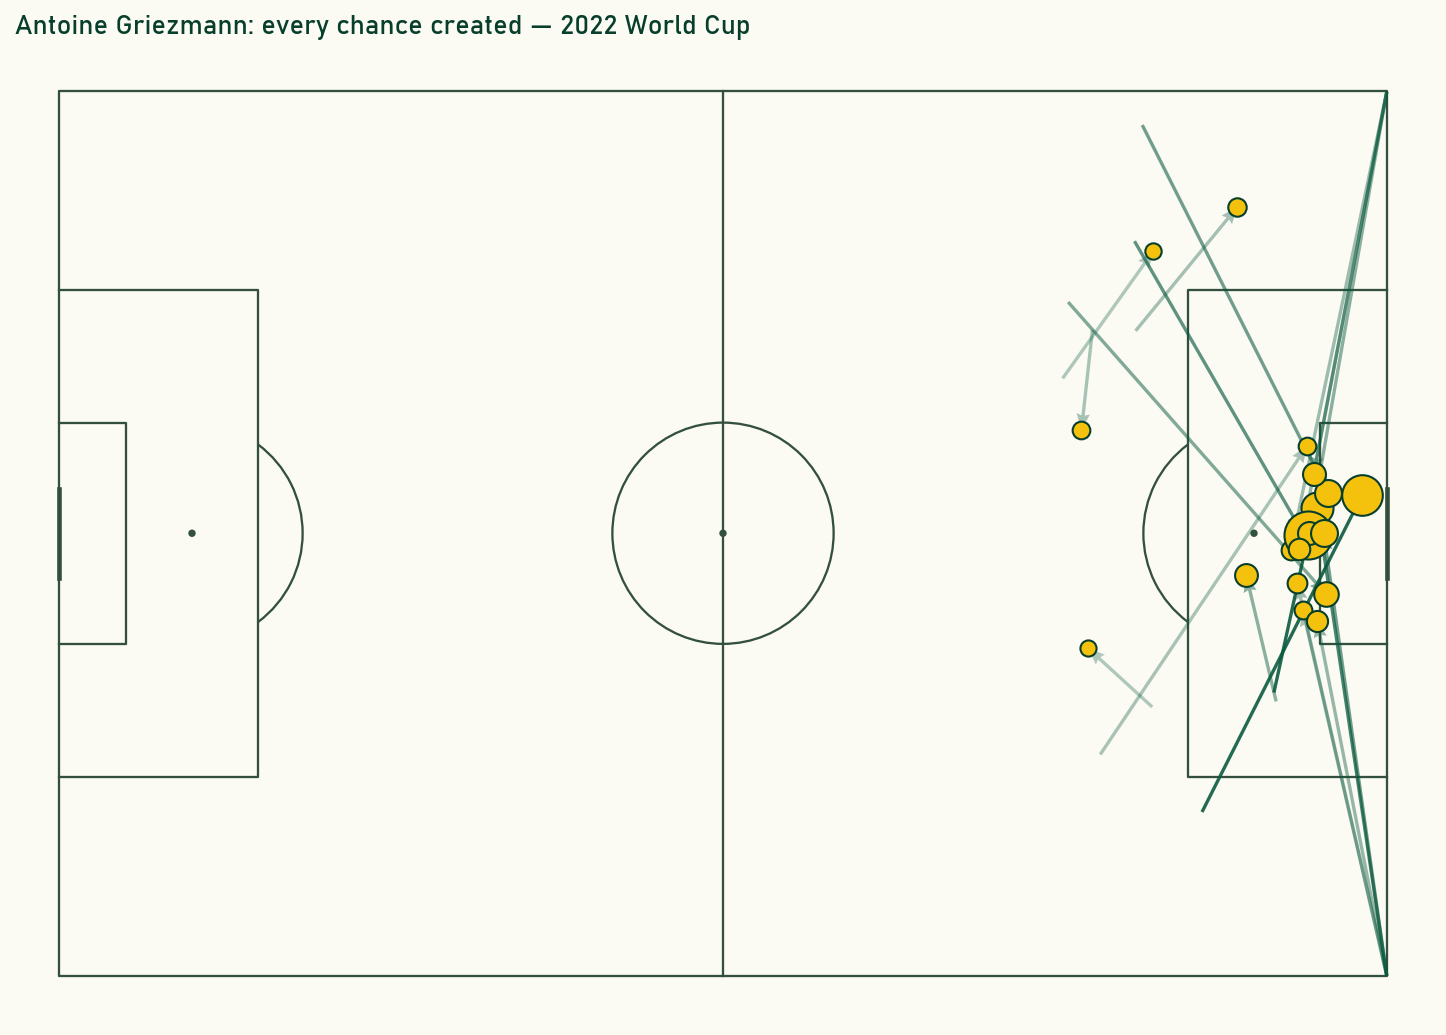
Griezmann leading that list is not a surprise to anyone who watched France closely. He spent much of the tournament operating in the half-spaces as a second striker, dropping deep to collect and then picking out runners. Most of that creation never made the assist column because French strikers spurned the chances. xA saw it anyway.
The limit xA runs into
xA is a significant improvement on raw assists, but it inherits one structural flaw: it only credits the player if their action directly preceded a shot. That last pass gets everything; the one before it gets nothing. Think about the midfielder who plays a quick turn-and-release out of pressure to an overlapping fullback, who then delivers the cross — the midfielder's contribution vanishes from the xA record. And an entire category of creative action is invisible to xA: carrying the ball through midfield, switching the play to open up the width, drawing defenders to create pockets for others. A box-to-box runner who breaks defensive lines with carries every other game and never touches the ball at the point of the shot simply doesn't exist in xA's world.
That is the gap expected threat was designed to fill.
Expected threat: valuing every action on the pitch
Expected threat (xT) is a possession-value model built around a simple question: given that a player has the ball in zone X, what is the probability that the team scores within the next few actions? The model assigns each point on the pitch a number between 0 and 1 that represents that probability. Any pass or carry that moves the ball from a lower-value zone to a higher-value zone gets credited with the difference. Any action that moves the ball backward — or gives it away — incurs a cost.
The intuition lands immediately. The areas near the opposing goal are worth a lot; deep in your own half, almost nothing. Nobody is going to argue with that. What xT makes rigorous is every gradient in between — the half-space outside the penalty area is more valuable than the same distance from goal directly down the wing, because the angle to shoot is better and defenders are split. The model learns those gradients from data, not from anyone's opinion.
Divide the pitch into, say, 192 cells (16 columns × 12 rows). For each cell, estimate two probabilities from historical data: pshoot — how often a team with the ball here takes a shot within the next three actions — and pgoal | shot — how often those shots become goals. The cell's xT value is pshoot × pgoal | shot, plus a weighted sum over every zone the ball could move to next (a pass or carry), capturing the downstream value. Solve the system of equations and you get a value map. A pass from deep midfield to the edge of the penalty box might raise the ball from an xT of 0.04 to 0.13, crediting the passer with 0.09 xT.
A worked example
Suppose a central midfielder on the halfway line — xT roughly 0.02 — plays a precise diagonal to a winger at the corner of the penalty area, where the xT value is approximately 0.10. That single pass earns the midfielder 0.08 xT. The winger then cuts inside to the penalty spot, a carry from xT 0.10 to maybe 0.20, earning 0.10 xT. The winger shoots — at that point, the shot is handled by the xG model rather than xT — and misses. Under xA, neither player gets anything. Under xT, the midfielder's diagonal and the winger's carry are both credited, capturing the genuine value they added to the attacking move. The miss is the striker's problem, not theirs.
That is the philosophical difference. xT is a model of progression; xA is a model of shot creation. They measure different things, and the most complete picture of a creator uses both.
Reading xA and xT together
A player who leads in xA almost certainly creates high-quality shots directly. A player who leads in xT might be driving dangerous ball progressions that end in shots for others — a deep-lying playmaker or an advancing fullback whose involvement is always three passes before the chance. High xT with modest xA is the signature of a player who shifts the structure of an attack rather than making the final key pass. High xA with modest xT could be an efficient final-third operator who contributes less to the build-up.
Neither stat is a verdict on a player's total value, and I'd push back on anyone who treats them that way. xT can be gamed somewhat — if a player only ever receives the ball in high-value zones, their carry xT looks impressive for fairly modest effort. And xA, like xG, is noisy in small samples: a player can rack up 1.5 xA in one game and nothing across the next four. Both metrics stabilise with larger samples, and both are most useful as a diagnostic rather than a single-number ranking.
The old assist column told you who touched the ball last before a goal. xA and xT together tell you who made dangerous things happen and at what stage — irrespective of what a keeper or striker did about it. That is a truer account of creativity.
Sources & further reading
- Free textbook: Chapter 9: Expected Threat (xT) and Ball Progression — the theory behind this, at DataField.dev.
- StatsBomb open data — match events including shot xG and key-pass links used to derive the xA figures here.
- StatsBomb — documentation on their event model and possession-value research.
- Karun Singh's blog — the original public description of the xT framework.
- FBref — xA and progressive passing data for domestic leagues.
- Understat — xA and xG breakdowns for top European leagues.
More from Stat Explainers
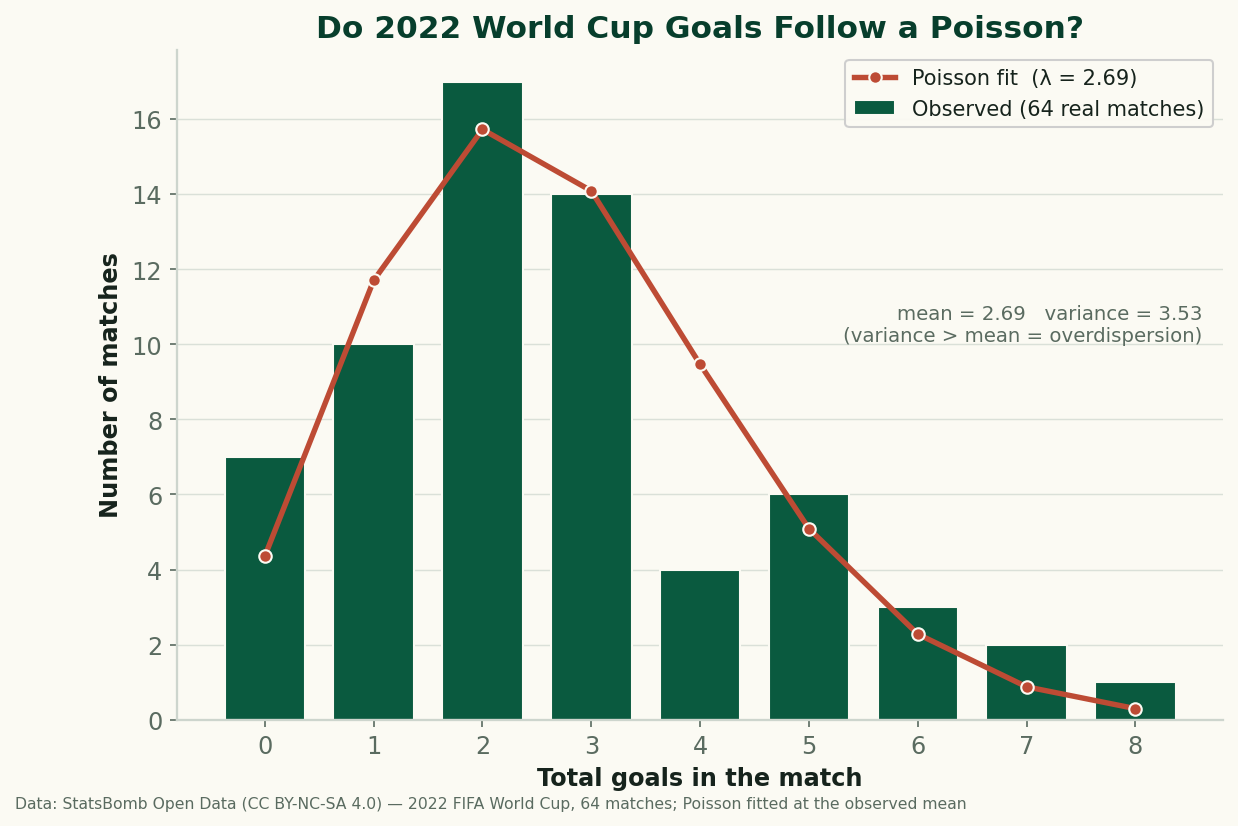
Do Football Goals Follow a Poisson? Testing the Standard Model on All 64 Games of 2022
Every scoreline prediction in football rests on the Poisson distribution. So I fit it to all 64 real matches of the 2022 World Cup and checked the residuals — it gets the shape right and fails in one specific, informative way: real goals are overdispersed. Here's why, with the formula and the code.
Aerial Duels and Heading Data: Reading Win Rate Without Getting Fooled by Volume
Aerial-duel win percentage, why raw counts mislead, where aerial dominance actually matters — set pieces, target men, defending crosses — and how to read heading data without confusing volume for quality.
Expected Points (xPts): Turning Shot-Level xG Into a Fairer Table
Expected points (xPts) simulates a match from its shot-level xG to get win, draw and loss probabilities, then a points total that rewards the chances a team created rather than the goals that happened to go in. How it is computed and what it reveals against the real table.