Set-Piece xG Explained: Why Corners Feel Deadly and Mostly Aren’t
The gap between how dangerous a corner feels and what it is worth.
The corner is the most overrated moment in football, and I say that as someone who still leans forward every time one is won. Our instincts and the evidence point in opposite directions here. The stadium senses danger; the data records a clearance and play restarting forty yards away. That gap — between how lethal a corner feels and what it is actually worth — is the single best reason to look at set pieces through expected goals rather than through the pit of your stomach. So let me take the dead ball apart, situation by situation, and show you where the menace is real and where it is theatre.
What a set piece is actually worth
Expected goals attaches a probability to a shot: the chance that a shot from that position, in that situation, becomes a goal. Run dead-ball situations through that lens and the headline finding is, frankly, humbling. The average corner is worth only a few hundredths of a goal, and the overwhelming majority of corners produce no shot at all — the ball is cleared, recycled, or won straight back by the defending side. The feeling of menace is real; the conversion is not.
The reason is geometry, the same thing that drives xG everywhere else. A corner is a delivery into a crowd, usually met first time, often with the head, by a player who is moving, marked, and facing away from the most of the goal. Every one of those factors pushes the probability of a goal down. A clean header from the penalty spot is a decent chance; a flick-on in a six-man scrum, contested in the air, is not. The chance the average corner generates — if it generates one at all — is a low-value one.
None of this means corners are worthless. A team wins a great many of them over a season, and a few hundredths of a goal repeated dozens of times adds up to real goals. The point is the rate, not the total: any single corner is far more likely to end in nothing than in a shot, and the shot it does produce is usually a poor one. If you have ever shouted at a team to “just win a corner” while chasing a game, the data gently suggests you were asking for very little.
Direct free kicks: distance, the wall, and a low ceiling
The direct free kick feels like the glamour set piece — the dead ball struck cleanly at goal, the wall, the wait. Its expected-goals profile is sobering for a different reason than the corner’s. Here the shot does happen, every time, but it is taken from distance, against a set defence, into a goal that has been deliberately made smaller.
Two things suppress the value. The first is distance, the strongest predictor in any xG model: conversion falls steeply as the ball is placed further from goal, and most direct free kicks are struck from ranges where open-play shots are already long shots. The second is the wall and the set goalkeeper. A direct free kick is one of the few shots in football where the defence is allowed to build a partial obstruction and the keeper has a moment to set his feet and read the angle. The shooter must beat both, usually by bending the ball over or around the wall and inside a post, which is precisely why the spectacular free-kick goal is celebrated as a piece of skill rather than expected as a matter of course.
So the honest framing is that even from promising central positions, a direct free kick is a low-probability event. It is worth taking — the alternative is conceding the shot entirely — and a genuine specialist tilts the odds in his favour over a career. But it sits much closer to the hopeful long-range effort than to the gilt-edged chance the crowd reaction implies.
The penalty: the high-value exception
Against that backdrop the penalty is the great outlier. It is the one dead-ball situation that is reliably, overwhelmingly a good chance. A penalty is worth roughly 0.76 to 0.79 xG — a near-constant in every model precisely because it is the same shot every time: a fixed spot, a fixed distance, an unobstructed strike with no defender between the ball and the goal except the keeper, who is not allowed to move off his line until the ball is struck.
That value — roughly three goals in every four — dwarfs anything a corner or a typical free kick offers. It is the reason a foul in the box is a catastrophe and a foul just outside it is merely a setback, and it is why winning a penalty is one of the most valuable single events in a match. If you want the full anatomy of why the number sits where it does, we devote a whole piece to it in the penalty conversion rate. For everything else on this page, just hold onto the contrast: penalties are the exception that proves how unthreatening the average set piece really is.
Why set-piece xG is genuinely hard to model
There is a deeper reason to treat set-piece xG with extra caution, and it is one I wish more match-day graphics acknowledged: it is genuinely harder to model than open play, and the usual freeze-frame features do less of the work. A standard xG model is trained on shot location, angle, body part, and the positions of defenders and the keeper at the moment of the shot. That works beautifully for an open-play chance, where the shot tends to be the clean end of a sequence. Set pieces break the assumptions.
The trouble is that a corner or an indirect free kick is a controlled act of chaos. The first contact is often a flick-on or a knockdown, not a shot. The dangerous shot — if one comes — frequently arrives from the second ball: a header that drops to a lurking midfielder, a clearance that falls to the edge of the box, a scramble after the keeper parries. Those second-phase shots are messy to attribute and noisy to value. Crowding makes it worse: a dozen players are packed into a tiny space, so “how many defenders are near the shooter” stops discriminating between chances the way it does in open play, where it is a powerful signal.
The practical consequences are real. Set-piece xG is noisier per shot than open-play xG, second-phase chances are easy to mis-credit, and the small samples any one team generates in a season mean a couple of flukey conversions can badly distort a set-piece “rating” over a short window. The metric is still useful in aggregate — it is the right tool for asking whether a team’s routines manufacture good chances — but it deserves more humility, and a larger sample, than the open-play number. Post-shot models, which value what happens after the ball leaves the foot or head, help with the keeper’s side of the ledger; we cover them in post-shot xG and goalkeeper metrics.
How smart teams attack the low base rate
If the average corner is nearly worthless, the interesting question is not whether to bother but how to do meaningfully better than average. Over the last decade a quiet specialism has grown up around exactly that, and it has changed how good teams treat the dead ball.
The first response is to stop playing the percentages everyone else plays. The short corner — declining the contested delivery in favour of keeping the ball, drawing a defender out, and attacking from a better angle or simply retaining possession — is a rational answer to a delivery that usually fails. So are designed routines: blocks and screens to free a runner, decoy movement to drag markers out of the danger zone, deliveries aimed at a specific pre-rehearsed spot rather than hopefully into the mixer. The aim is the same in every case — to manufacture the one thing the average corner lacks, a clean contact for a free attacker.
The second response is organisational, and it is the clearest sign the analytics took hold: the rise of the dedicated set-piece coach. A role that barely existed a decade ago is now common at the top of the game, and the logic is pure expected goals. Set pieces are a large, repeatable share of a season’s chances; the base rate is low; marginal gains compound. A coach who can lift a team from a poor set-piece process to a good one is buying extra goals at the margin, on both sides of the ball, for a fraction of the cost of a transfer. That is what it looks like when a sport reads its own data: not abandoning the corner, but refusing to accept the average return on it.
Sources & further reading
- Free textbook: Chapter 7: Expected Goals (xG) Models — the theory behind this, at DataField.dev.
- StatsBomb — research on set-piece value, second-phase chances, and how freeze-frame features feed an xG model.
- StatsBomb open data — shot- and event-level data, including set-piece play patterns, for analysts who want to compute this themselves.
- Understat — season-level xG tables that let you separate set-piece and open-play contributions.
- FBref — set-piece and shot data (via Opta) across a wide range of competitions.
More from Stat Explainers
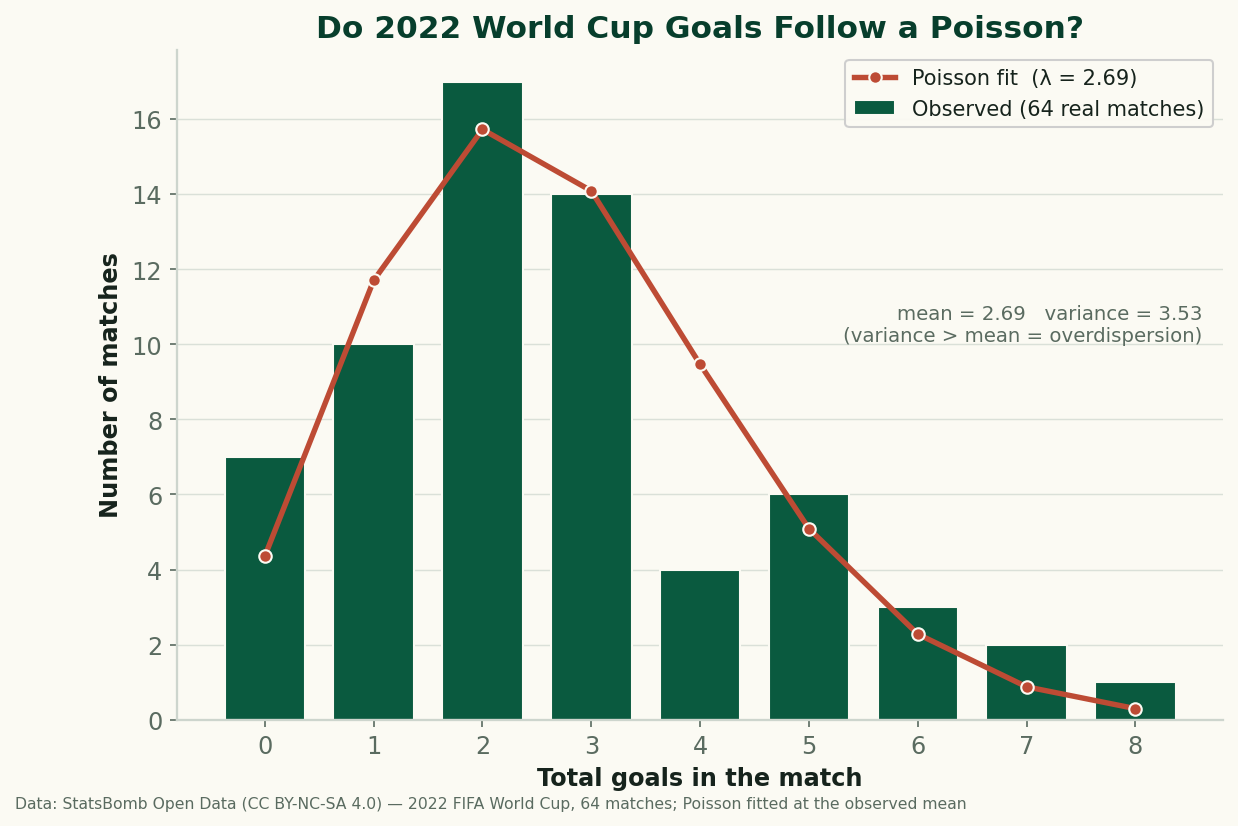
Do Football Goals Follow a Poisson? Testing the Standard Model on All 64 Games of 2022
Every scoreline prediction in football rests on the Poisson distribution. So I fit it to all 64 real matches of the 2022 World Cup and checked the residuals — it gets the shape right and fails in one specific, informative way: real goals are overdispersed. Here's why, with the formula and the code.
Aerial Duels and Heading Data: Reading Win Rate Without Getting Fooled by Volume
Aerial-duel win percentage, why raw counts mislead, where aerial dominance actually matters — set pieces, target men, defending crosses — and how to read heading data without confusing volume for quality.
Expected Points (xPts): Turning Shot-Level xG Into a Fairer Table
Expected points (xPts) simulates a match from its shot-level xG to get win, draw and loss probabilities, then a points total that rewards the chances a team created rather than the goals that happened to go in. How it is computed and what it reveals against the real table.