PPDA Explained: How Analysts Quantify the Press
Putting a number on how hard a team presses.
For years I could watch a team press, point at the screen, and tell you it was happening — but I couldn't put a number on it, and neither could anyone else. That gap bugged me. Pressing has been the dominant tactical idea of my lifetime as a watcher; every manager talks about it and every fan recognises it on sight, yet for a long stretch it sat completely outside the box score. PPDA is the metric that finally closed the gap. It is not perfect — I'll spend half this article on where it lies to you — but it is genuinely useful, and pulling apart its exact construction is the fastest way to see both what it captures and what it quietly hides.
What PPDA measures
PPDA stands for passes allowed per defensive action. The core idea is simple: how many times did the opponent pass the ball before your team did something about it? More passing before a defensive intervention means a softer, more passive press. Fewer passes means you were on them quickly, disrupting their rhythm and making their goalkeeper nervous.
There is one critical spatial restriction that makes the metric coherent rather than noisy: only events that occur in the opponent's build-up zone are counted. In practice, this means the defending team's own 60% of the pitch — roughly from their goal to around the halfway line and slightly beyond. Why the restriction? Because a team defending a set piece sixty yards from their own goal, or a team holding a late lead in the opposition's half, is doing something completely different from a team that is actively hunting the ball high up the pitch. Strip out the final 40%, and you isolate the pressing behaviour you actually want to measure.
The formal definition, then:
where defensive actions = tackles + interceptions + blocks + fouls
Note the direction of the scale, because it trips people up constantly: a lower PPDA means a more intense press — you are allowing fewer passes before you win the ball back, foul someone, or force an error. A PPDA of 6 means you are, on average, intervening after six opponent passes. A PPDA of 11 means the opposition is stringing together nearly a dozen passes in their own territory before they feel any pressure at all.
Walking through the calculation
Take a single defensive sequence. The goalkeeper rolls to the right centre-back. He plays it short to the left centre-back. She drives forward, is closed down by the pressing forward, and concedes a foul. That is two passes and one defensive action, contributing 2/1 = 2.0 to the running numerator and denominator respectively. Repeat that over an entire match, then over an entire tournament, and you build up a stable aggregate ratio.
In event-level data — StatsBomb's open dataset is the source here — each event has a location coordinate on a 120×80 grid. A pass counts toward PPDA if the pass location falls within approximately x ≤ 48 (the defending team's half of the field, extended slightly into the opponent's territory). Defensive actions — tackles, interceptions, blocks, and fouls — are counted in the same zone. The aggregation is then:
import pandas as pd

def calc_ppda(events: pd.DataFrame) -> float:
    """
    events: a StatsBomb events DataFrame for one team's defensive phase.
    PPDA zone: opponent's build-up zone (opponent passes where x <= 48,
    i.e. their own 60% of the pitch when attacking toward x=120).
    Returns PPDA (float). Lower = more intense press.
    """
    # Passes by the *opponent* in their own build-up zone
    opp_passes = events[
        (events["type"] == "Pass") &
        (events["location"].apply(lambda loc: loc[0] <= 48))
    ]

    # Defensive actions by the *pressing team* in the same zone
    def_actions = events[
        (events["type"].isin(["Tackle", "Interception", "Block", "Foul Committed"])) &
        (events["location"].apply(lambda loc: loc[0] <= 48))
    ]

    if len(def_actions) == 0:
        return float("inf")  # no defensive actions = no press at all

    return round(len(opp_passes) / len(def_actions), 2)
That is, more or less, how every serious PPDA implementation works. The variation between providers comes from slightly different zone boundaries, whether fouls are included, and how possession phases are segmented. The StatsBomb implementation used here excludes Pressure events from the denominator, keeping it to actions that physically contest or end a possession rather than movement intent.
PPDA at the 2022 World Cup
With 64 matches and 32 teams, Qatar 2022 gives us enough data to rank teams and see real differentiation. The full tournament PPDA for all 32 sides, averaged across their group and knockout matches, is below.
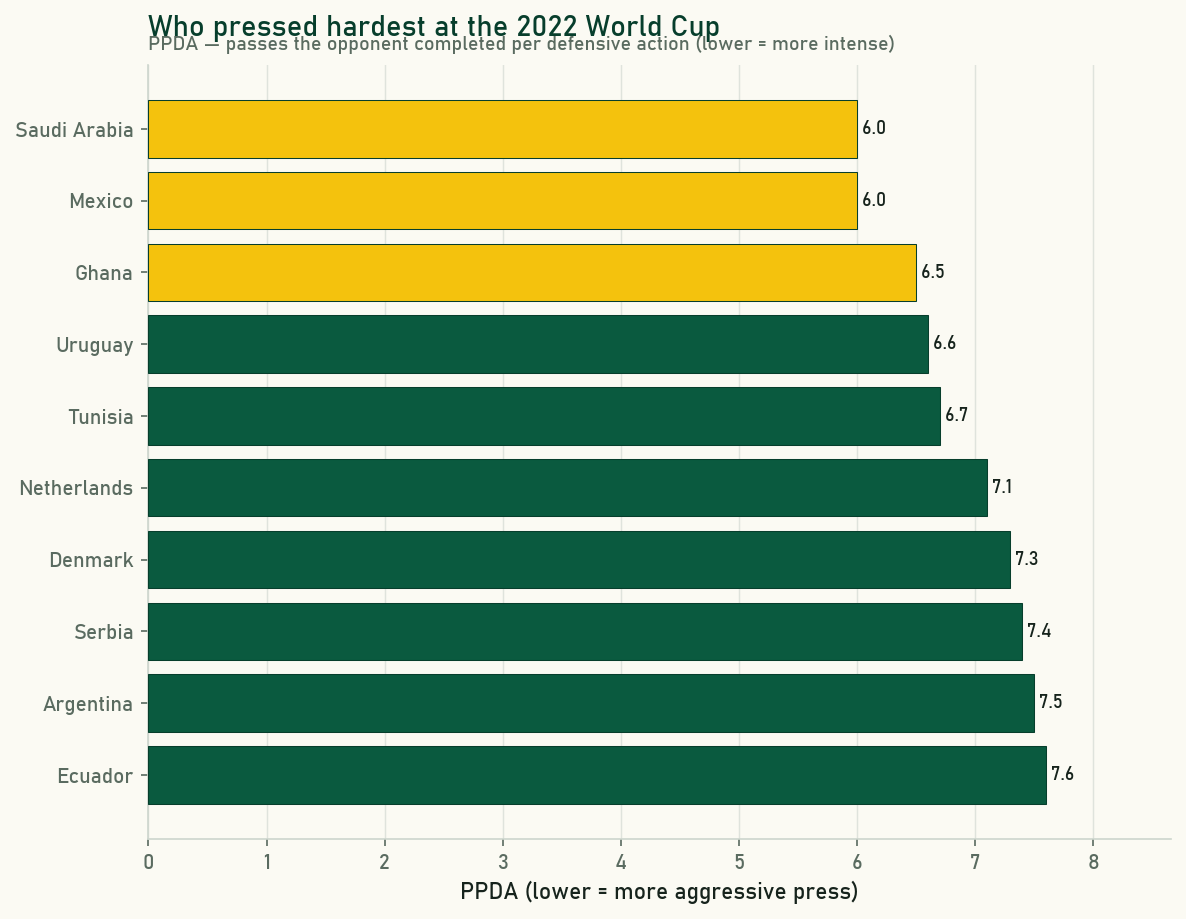
| Team | PPDA | Team | PPDA |
|---|---|---|---|
| Saudi Arabia | 6.0 | Iran | 8.0 |
| Mexico | 6.0 | England | 8.1 |
| Ghana | 6.5 | Cameroon | 8.2 |
| Uruguay | 6.6 | Costa Rica | 8.5 |
| Tunisia | 6.7 | Poland | 8.6 |
| Netherlands | 7.1 | Morocco | 8.8 |
| Denmark | 7.3 | Switzerland | 8.8 |
| Serbia | 7.4 | Australia | 9.0 |
| Argentina | 7.5 | United States | 9.1 |
| Ecuador | 7.6 | Japan | 9.3 |
| France | 7.6 | Brazil | 9.3 |
| Croatia | 7.7 | Germany | 9.6 |
| Spain | 7.8 | Portugal | 9.9 |
| Wales | 7.8 | South Korea | 10.0 |
| Belgium | 7.9 | Senegal | 10.1 |
| Qatar | 10.3 | ||
| Canada | 11.3 |
Saudi Arabia and Mexico top the table at 6.0 — the same value, and I don't think it's a coincidence that both played a high-energy, reactive style that tournament. The median sits at 8.0, which gives a useful reference point: anything below that signals genuine pressing intent. Canada at 11.3 is the outlier at the other end; they let opponents string together nearly a dozen passes in their own territory before intervening, which, for a side as eager as they looked going forward, surprised me.
The champion Argentina sits at 7.5, firmly in the pressing half of the tournament. France, their opponents in the final, registered the identical value of 7.6 — which is one of those small data ironies that tells you PPDA is useful for separating approaches across a whole competition, but not for predicting a single match outcome.
Where PPDA misleads
Here is the part most explainers rush past. PPDA has four blind spots I keep running into, and knowing them is, honestly, more important than knowing the formula.
It ignores pressing traps. A team can deliberately sit deep and invite short passes, then spring forward in organised fashion to win the ball. During the invitation phase, PPDA registers a passive number. The actual organisation — the compactness, the trigger, the coordinated movement — is invisible to the stat.
It says nothing about effectiveness. PPDA measures intensity; it does not measure outcomes. A team with a PPDA of 6.0 might be winning the ball in dangerous positions and launching quick counters, or it might be committing fouls and giving away free kicks in reasonable positions. Both teams have the same number. If you want to understand whether pressing is working, you need to add something like turnover location, shots generated from recoveries, or xG generated from press-wins. PPDA alone cannot distinguish a high-quality gegenpressing side from an energetic but disorganised one.
A deep low block looks passive by PPDA. A team that defends in a 4-4-2 mid-block, inviting the opponent to build up slowly and then defending compactly in their own half, will record a high PPDA purely because they are not trying to win the ball in the build-up zone. Morocco at this tournament (PPDA 8.8) are a decent example: they were widely praised for their defensive discipline and compactness, not pressing passivity, but the PPDA value places them in the bottom third of the table. The number reflects where and how frequently they intervened, not how good their defence was.
Possession context is missing. When a team is chasing a game in the final twenty minutes, they tend to press more desperately; when they are protecting a lead, they drop off. PPDA aggregated across a full match blends these very different situations. A possession-adjusted or game-state-split version of PPDA is more informative, but the basic version that circulates in most public dashboards does not distinguish them.
Using PPDA alongside other metrics
The most honest use of PPDA is as one layer of a defensive picture, not a verdict on its own. Pair it with PPDA allowed (how much your opponent presses you, i.e., how many passes you are permitted) and you immediately learn about the balance of the press in a match. Add turnover location maps or field-tilt numbers and you get a sense of whether the pressing is territorial as well as intense. Add xG conceded from opposition counters and you can start to say something about the risk the pressing exposes.
The other practical use, and the one I lean on most, is team tracking across a season. PPDA is stable enough in aggregate that a sudden spike — say, a team's number jumping from 7 to 10 over five matches — is a meaningful signal that something has changed: fatigue, a formation shift, a manager departure, a key presser injured. Think of it less as a verdict and more as a smoke alarm. It is a monitoring tool as much as a characterisation tool.
Sources & further reading
- Free textbook: Chapter 12: Defensive Metrics and Analysis — the theory behind this, at DataField.dev.
- StatsBomb open data — the event-level match data used to compute all figures in this article.
- StatsBomb — detailed documentation of their event definitions and pressing metrics.
- FBref — pressing statistics (pressures, press successes, PPDA equivalents) for major competitions.
- Understat — season-level data for the major European leagues including defensive metrics.
More from Stat Explainers
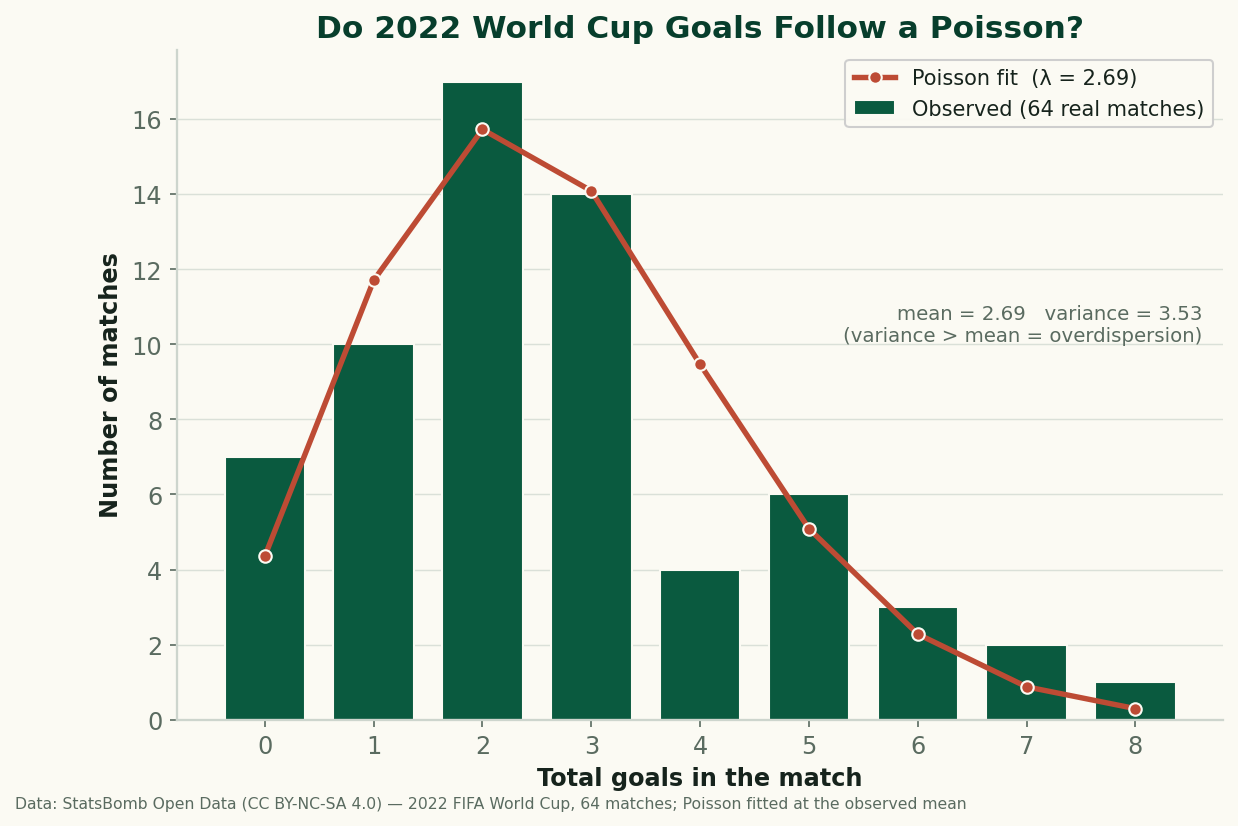
Do Football Goals Follow a Poisson? Testing the Standard Model on All 64 Games of 2022
Every scoreline prediction in football rests on the Poisson distribution. So I fit it to all 64 real matches of the 2022 World Cup and checked the residuals — it gets the shape right and fails in one specific, informative way: real goals are overdispersed. Here's why, with the formula and the code.
Aerial Duels and Heading Data: Reading Win Rate Without Getting Fooled by Volume
Aerial-duel win percentage, why raw counts mislead, where aerial dominance actually matters — set pieces, target men, defending crosses — and how to read heading data without confusing volume for quality.
Expected Points (xPts): Turning Shot-Level xG Into a Fairer Table
Expected points (xPts) simulates a match from its shot-level xG to get win, draw and loss probabilities, then a points total that rewards the chances a team created rather than the goals that happened to go in. How it is computed and what it reveals against the real table.