Field Tilt and Territory Explained: Whose Final Third Is the Game Being Played In?
Possession tells you who has the ball; field tilt tells you where.
I gave up trusting the possession bar the day I watched a side hold two thirds of the ball, lose 2–0, and still get described as “dominant” in the match report. They had the ball, sure. They just never had it anywhere that frightened anyone. That is the hole possession leaves: it counts who is holding the thing, not where the thing is being held. Field tilt fills the hole. It ignores the back-four passing carousel entirely and asks the one question the possession number ducks — whose half is the game actually being played in?
What field tilt measures
Field tilt is a team's share of the final-third activity in a match — most commonly its share of all touches, or all passes, that happen in the attacking thirds of the two teams combined. If a match contains 200 touches in either final third and your team is responsible for 130 of them, your field tilt is 65%. It is a measure of territorial dominance: the degree to which the ball, and therefore the game, is being pushed into the opponent’s defensive third rather than your own.
The choice of the final third is what makes the metric meaningful. Touches near the halfway line are cheap; every team has plenty. Touches inside the final third are the ones that sit close to where goals are scored, and a team that monopolises them has pinned its opponent back. That is the picture field tilt is built to capture in a single percentage: who is camped in whose half.
Why it tells you more than raw possession
Possession and field tilt usually move together, but the gap between them is where the insight lives. Consider the two ways a team can record 60% of the ball. In the first, that possession is sterile: the centre-backs and the holding midfielder knock it sideways and backwards, the opponent is content to sit off, and almost none of the ball reaches the final third. The possession figure is high and the field tilt is barely above even. In the second, the same 60% is relentlessly forward: the ball is worked into wide areas in the final third, recycled, and worked back in again. Here the field tilt might be 70% or more, far outstripping the possession number.
Those are two completely different performances that the possession column reports identically. A team can have most of the ball in its own half and create nothing — the possession looks like control and functions like stagnation. Field tilt separates the two, because it only ever counts the ball when it has arrived somewhere that matters. This is the same lesson that runs through possession-adjusted stats: the raw possession total is a measure of activity, not of where or how dangerously that activity took place.
The family of territory metrics
Field tilt is the best-known member of a small family of metrics that all try to answer “where is the game being played?” in slightly different ways. Knowing the relatives helps you read the headline number.
- Final-third touch share — the standard definition above, usually expressed as a percentage of the two teams’ combined final-third touches.
- Deep completions. A count of completed passes that end close to the opponent’s goal — conventionally within about twenty yards of it, excluding crosses. Where field tilt measures territory broadly, deep completions count how often a team actually reached the edge of the danger area.
- Deep progressions / entries. The number of times a team moves the ball into the final third or the penalty area, by pass or by carry, regardless of what happens next.
- Average action height. The mean distance up the pitch at which a team’s touches or actions occur — a blunt single number for how high a team is playing.
None of these is a chance-quality metric. They are all answering the territorial question, and they tend to agree with one another. When they disagree — high field tilt but few deep completions, say — that disagreement is itself informative: it suggests a team that reaches the final third easily but cannot penetrate the last twenty yards.
Territory without chance quality is empty
Here is the trap field tilt sets for the unwary: it is entirely possible to dominate territory and threaten nothing. A side can pin its opponent in for ninety minutes, rack up a field tilt north of 70%, and take all of its touches in harmless wide areas in front of a packed defensive block. The territory is real; the threat is not. Field tilt cannot tell the difference between a team working the ball into the six-yard box and a team passing it around the corner flag, because both happen inside the final third.
This is why field tilt should almost never be read alone. Its natural partner is expected goals. Field tilt tells you where the game was played; xG tells you whether being there produced anything worth having. The combination is far more revealing than either:
- High tilt, high xG. Sustained pressure that is actually breaking the opponent down — the picture of a dominant attacking display.
- High tilt, low xG. Territorial control without penetration — the classic “all the ball, no clear chances” performance against a deep, well-organised block.
- Low tilt, high xG. A team that lives in its own half but is lethal on the break — few touches up the pitch, but the ones it has are dangerous.
Read together, tilt and xG describe both the volume and the quality of a team’s attacking work. Read apart, each one can be made to tell a misleading story.
An illustrative example: the passer and the puncher
The following two teams are invented to illustrate the contrast — the numbers are not from any real match, only chosen to make the point cleanly.
| Side | Possession | Field tilt | xG |
|---|---|---|---|
| Keepball FC (slow build) | 61% | 54% | 0.8 |
| Direct United (counter) | 39% | 58% | 1.9 |
On the possession column, Keepball FC look comfortably the better side — sixty-one percent of the ball is the kind of number that wins the post-match narrative. But the field tilt tells a different story: Direct United, with far less of the ball, spent more of the match in the dangerous third. They conceded possession in midfield, absorbed pressure, and then attacked with intent, putting the ball into the final third more often than the side that monopolised it. The xG confirms what the tilt hints at — the territory Direct United won was the productive kind. Possession said one team dominated; territory and chance quality said the other did.
The caveats: game state and style
Field tilt is not a clean measure of quality, and the largest distortion is the scoreline. A team that goes a goal up and drops into a low block will happily concede territory for the rest of the match; its field tilt will crater, while the side chasing the game runs up a huge number pressing for an equaliser it may never get. The losing team can finish with 70% tilt precisely because it is losing. This is the central warning of game state and score effects: territory accumulated while behind is not the same evidence as territory won at 0–0, and a full-match tilt figure quietly blends the two.
Style matters too. A committed counter-attacking team may post modest tilt by design and still be the better side, because surrendering territory is the plan rather than a symptom. And like any share-based metric, field tilt only describes the balance between the two teams: 60% against a passive opponent is a smaller achievement than 55% against a side that presses high.
The honest use of field tilt is the same as the honest use of any single number. It is a fast answer to one question — whose final third was the game being played in — and a poor answer to almost any other. Pair it with chance quality, check it against the scoreline, and it becomes one of the most readable shorthands for the shape of a match.
Sources & further reading
- Free textbook: Chapter 11: Possession and Territorial Control — the theory behind this, at DataField.dev.
- StatsBomb — event data and writing on territory, pressing, and where teams play.
- StatsBomb open data — touch- and pass-level event data you can use to compute final-third shares yourself.
- FBref — touch locations by pitch third and other territorial breakdowns (via Opta).
- Understat — match and season xG to pair against any territory measure.
More from Stat Explainers
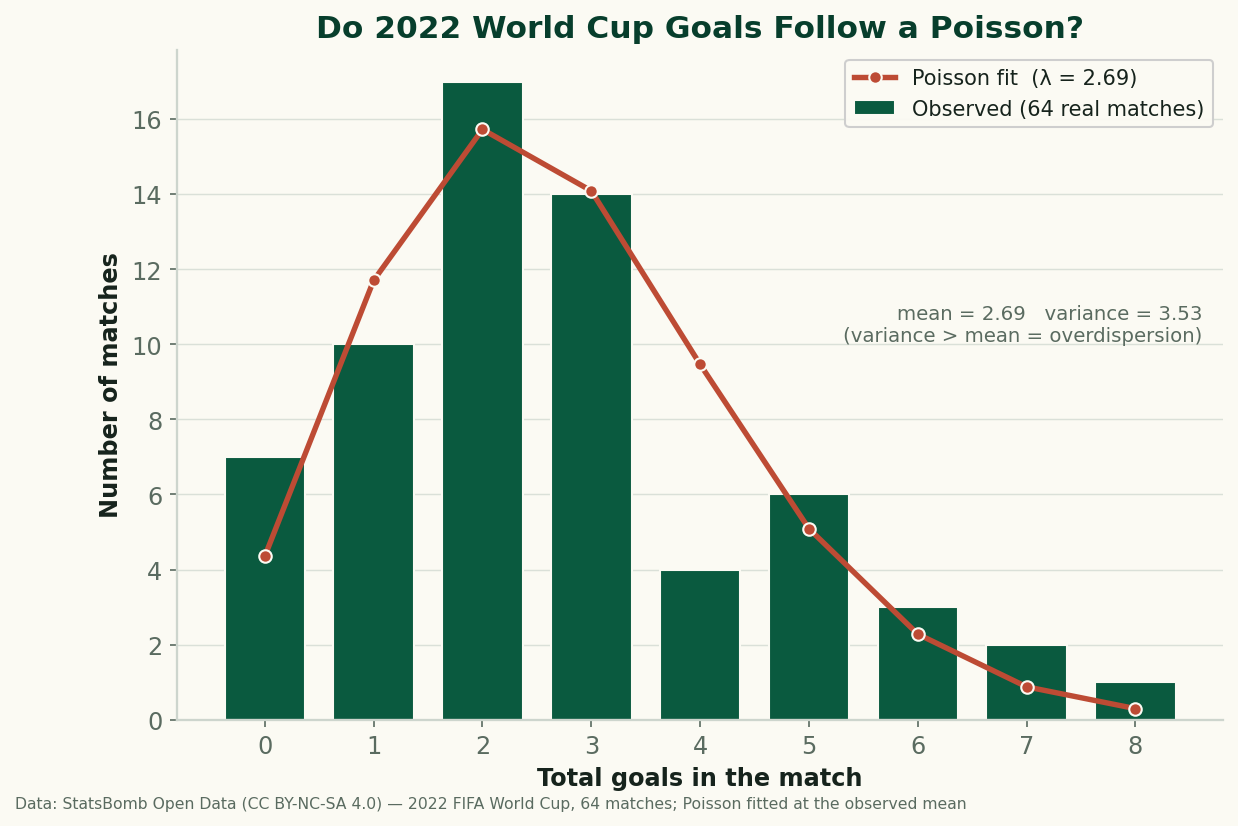
Do Football Goals Follow a Poisson? Testing the Standard Model on All 64 Games of 2022
Every scoreline prediction in football rests on the Poisson distribution. So I fit it to all 64 real matches of the 2022 World Cup and checked the residuals — it gets the shape right and fails in one specific, informative way: real goals are overdispersed. Here's why, with the formula and the code.
Aerial Duels and Heading Data: Reading Win Rate Without Getting Fooled by Volume
Aerial-duel win percentage, why raw counts mislead, where aerial dominance actually matters — set pieces, target men, defending crosses — and how to read heading data without confusing volume for quality.
Expected Points (xPts): Turning Shot-Level xG Into a Fairer Table
Expected points (xPts) simulates a match from its shot-level xG to get win, draw and loss probabilities, then a points total that rewards the chances a team created rather than the goals that happened to go in. How it is computed and what it reveals against the real table.