The Penalty Conversion Rate: Football’s Most Studied Shot
The cleanest chance in football, and why it still misses one time in four.
Almost nothing in football repeats. Every open-play shot is a one-off — a different angle, a different defender, a different bounce. The penalty is the exception. It is the same ball, from the same spot, against the same lone obstacle, taken thousands of times a season across the world. That constancy is why it is the most studied shot in the game, and why we can say something unusually precise about it: it goes in roughly three times in four, and the reasons it ever misses are worth a whole article.
The cleanest chance in football
An expected-goals model assigns a probability to a shot from its features — distance, angle, body part, the positions of defenders and the keeper. For almost every shot those features vary. For a penalty they are fixed by the laws of the game: the ball sits on a marked spot a set distance from goal, struck without obstruction, with no outfield defender allowed between it and the line. That is why a penalty carries a near-constant value in every model — commonly quoted in the region of 0.76 to 0.79 xG — and why it converts at a remarkably stable rate. The widely cited finding, across the big European leagues and over long samples, is that penalties are scored something like three times in every four.
Treat both figures as well-established ranges rather than exact constants — the precise rate drifts a little by league, era, and how you count retakes and shootouts — but the shape of the answer is not in doubt. The penalty is, by a distance, the highest-value standard chance in football. The interesting question is not why it is converted so often, but why a shot this favourable is still missed a quarter of the time.
The geometry, and the time the ball takes to arrive
The answer starts with a race the taker is heavily favoured to win but does not always win cleanly. From twelve yards a struck ball reaches the goal in a fraction of a second — less time than a goalkeeper needs to see the ball, decide which way to go, and physically travel from a central position to the corner of a goal that is wider than he can cover by standing still. That asymmetry is the whole reason the penalty is a good chance: the keeper essentially cannot react to a well-placed shot, so he must anticipate, committing before or as the ball is struck.
The corollary defines the target. The corners of the goal — high and wide, where the keeper cannot reach even with a correct guess — are effectively unsaveable if the taker hits them. The geometry hands the penalty taker a region of the goal that, struck accurately, beats any goalkeeper. The catch is in the word accurately: aiming at the unsaveable corners brings the post and the bar into play, and that tension is the source of every miss.
Placement versus power
That tension is the central trade-off of penalty taking, and it is best described qualitatively because the exact numbers vary with sample and definition. At one extreme is the placed penalty: aimed close to a corner, prioritising a spot the keeper cannot reach. It maximises the reward of a correct strike but shrinks the margin for error — miss your spot by a little and the ball is wide or against the woodwork. At the other extreme is the powered penalty: hit hard and a touch more centrally, trading some of the keeper-proof placement for a larger target and less chance of missing the goal entirely, while giving the keeper a marginally better hope if he guesses right and stays big.
There is no single correct answer, which is exactly why takers differ. Some live in the corners and accept the occasional ball into the stand; others trust power and a slightly safer line. The one robust generalisation is the failure mode of each: the placed penalty’s enemy is the post and the missed target, the powered penalty’s enemy is a keeper who reads it and gets a strong hand to a more reachable ball. Both strategies are converted at high rates — that is what “three in four” is made of — and both miss in their own characteristic way.
The goalkeeper’s dilemma and the line
The keeper’s side of the duel is a genuine decision problem, and the rules shape it tightly. Because he cannot reliably react to a well-struck shot, he is forced into anticipation: commit early to a side and you might reach a corner you could never have reached by waiting, but commit early and guess wrong and you have removed yourself from the shot the taker actually chose. Wait to read the ball and you keep your options but sacrifice the head start the geometry says you need. Some keepers try to delay the decision to the last possible instant; some try to influence the taker’s choice by their stance or by feinting; some simply pick a side and dive.
The laws constrain all of this with the line rule. The goalkeeper must stay on or in front of the goal line until the ball is kicked, and the modern requirement is that he keep at least part of one foot on or in line with the line at the moment of the kick — a slight relaxation introduced to stop keepers being penalised for a toe drifting a centimetre forward, while still forbidding the old trick of charging out to close the angle. He may move along the line and dance to distract, but he may not advance off it early. That single constraint is a large part of why the penalty stays a three-in-four chance rather than a coin flip: the keeper is pinned to his line until it is almost too late to matter.
VAR-era encroachment and retakes
Video review sharpened the enforcement of rules that referees had long policed loosely, and the penalty was an obvious target. Two infringements now get scrutinised frame by frame. The first is the keeper coming off his line before the ball is struck; the second is encroachment — attackers or defenders entering the penalty area before the kick to attack a possible rebound. In the VAR era these are flagged far more consistently than they once were.
The consequence is a small but real shift in the odds, and crucially it is asymmetric. If the keeper saves a penalty but was clearly off his line early, the kick can be retaken — handing the taker a fresh attempt at a roughly three-in-four chance. If an attacker encroaches and the penalty is scored, the goal can be disallowed and the kick retaken; if a defender encroaches and the penalty is missed or saved, it can be retaken in the attacker’s favour. Net, tighter enforcement of the line and of encroachment nudges value toward the taker on saves and toward the defence on scored kicks with attacking encroachment — a reshuffling at the margins of an already taker-friendly event. The base rate did not move much; the bookkeeping around the edges did.
Why pressure changes the picture — and a word on shootouts
Everything above describes the mechanics of the kick. It says nothing about the state of mind of the person taking it, and that is where the in-game penalty and the shootout penalty quietly diverge. A penalty in open play is one moment in a flowing match: take it, and the game continues whatever happens. A shootout penalty is isolated, sequential, and decisive — each kick taken in turn, in silence, with the tournament hanging on it, and often after 120 minutes of fatigue. The physical shot is identical; the context is not.
The honest analytical position is that pressure and fatigue plausibly depress conversion relative to the clean in-game baseline, and that shootouts have their own dynamics — order effects, the weight of going behind, the keeper’s growing information about a team’s habits. But the size of those effects is contested, the samples are smaller and noisier than league-play penalties, and it would be a fabrication to attach a precise penalty to “pressure.” So we will not. The safe summary is the one the data supports: the penalty is the most constant shot in football, worth around three-quarters of a goal and converted about three times in four — and the moment you take it out of the run of play and stand a tired player over it with everything on the line, you are no longer measuring quite the same thing. For how single events like a won penalty move a match, see how win probability models work; for the broader family of dead-ball chances around it, see set-piece xG explained.
Try it: shootout odds from a conversion rate
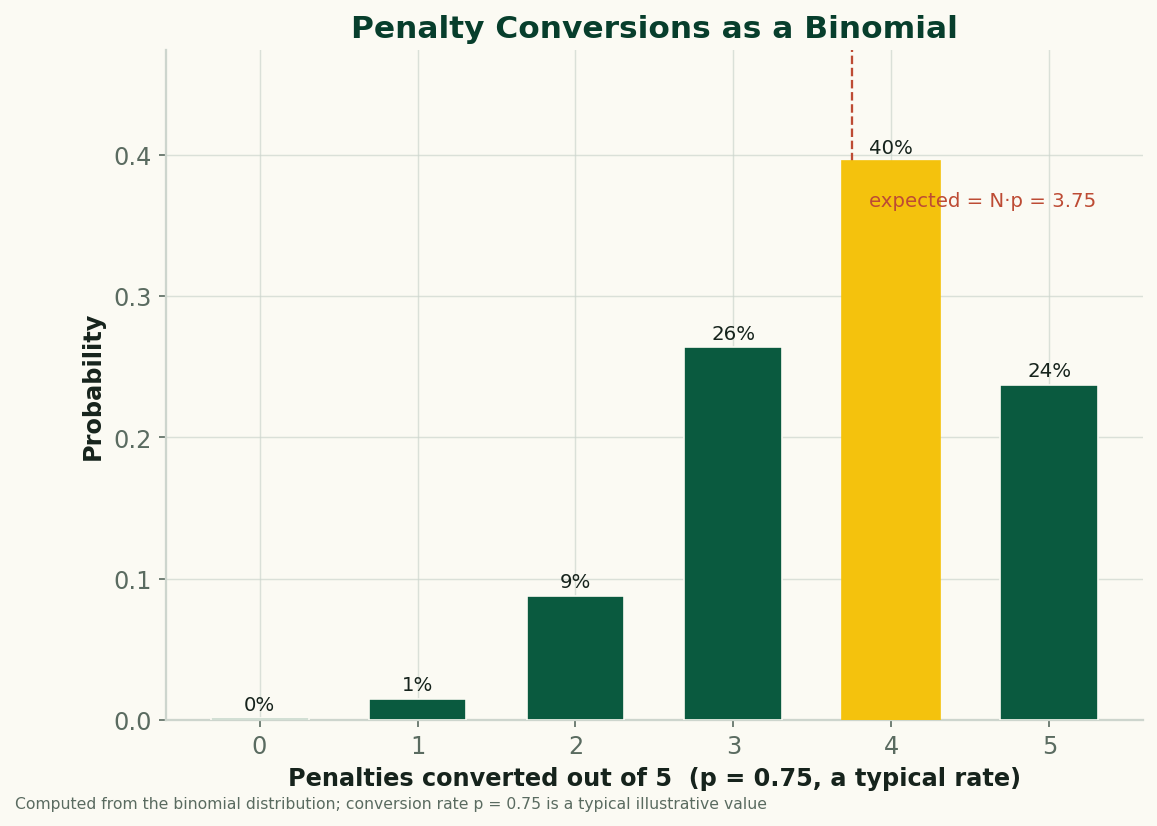
Set a per-kick conversion rate and the tool computes, exactly from the binomial, how a standard best-of-five shootout (plus sudden death) plays out between two equally-skilled sides. The surprise it surfaces: at a higher rate, more shootouts stay level after five kicks — because both sides keep scoring — so the real edge is out-converting the opponent, not the absolute rate.
This calculator needs JavaScript. The method: each of five kicks is an independent Bernoulli trial with probability p, so made kicks follow Binomial(5, p); compare two such sides and break any remaining tie 50/50 for sudden death.
Open this calculator on the tools page →
Sources & further reading
- Free textbook: Chapter 14: Set Piece Analytics — the theory behind this, at DataField.dev.
- StatsBomb open data — shot-level event data, including penalties, for computing conversion rates and xG yourself.
- StatsBomb — methodology on how penalties are valued within an xG framework.
- FBref — penalty and shot data (via Opta) across many competitions, useful for comparing eras and leagues.
- Understat — season-level shot and xG data for the major European leagues.
More from Data Deep-Dives
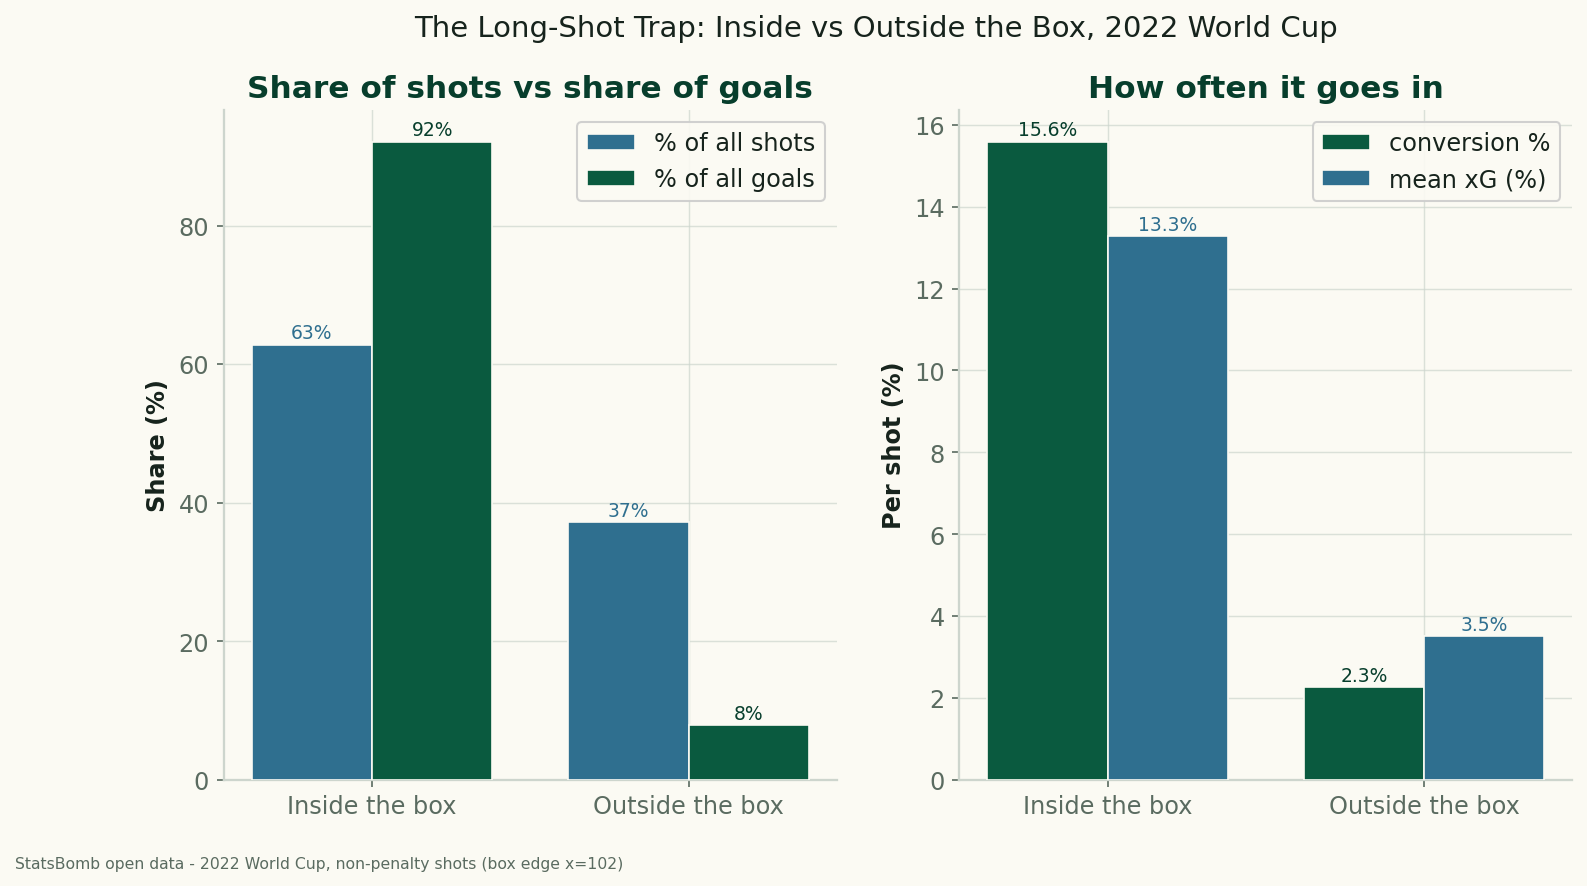
The Long-Shot Trap: Inside vs Outside the Box at the 2022 World Cup
Using StatsBomb data for all 64 matches of the 2022 World Cup, shots from outside the penalty box were 37% of all attempts but produced just 8% of the goals — a 2.3% conversion rate against 15.6% from inside. The data behind 'stop shooting from there.'
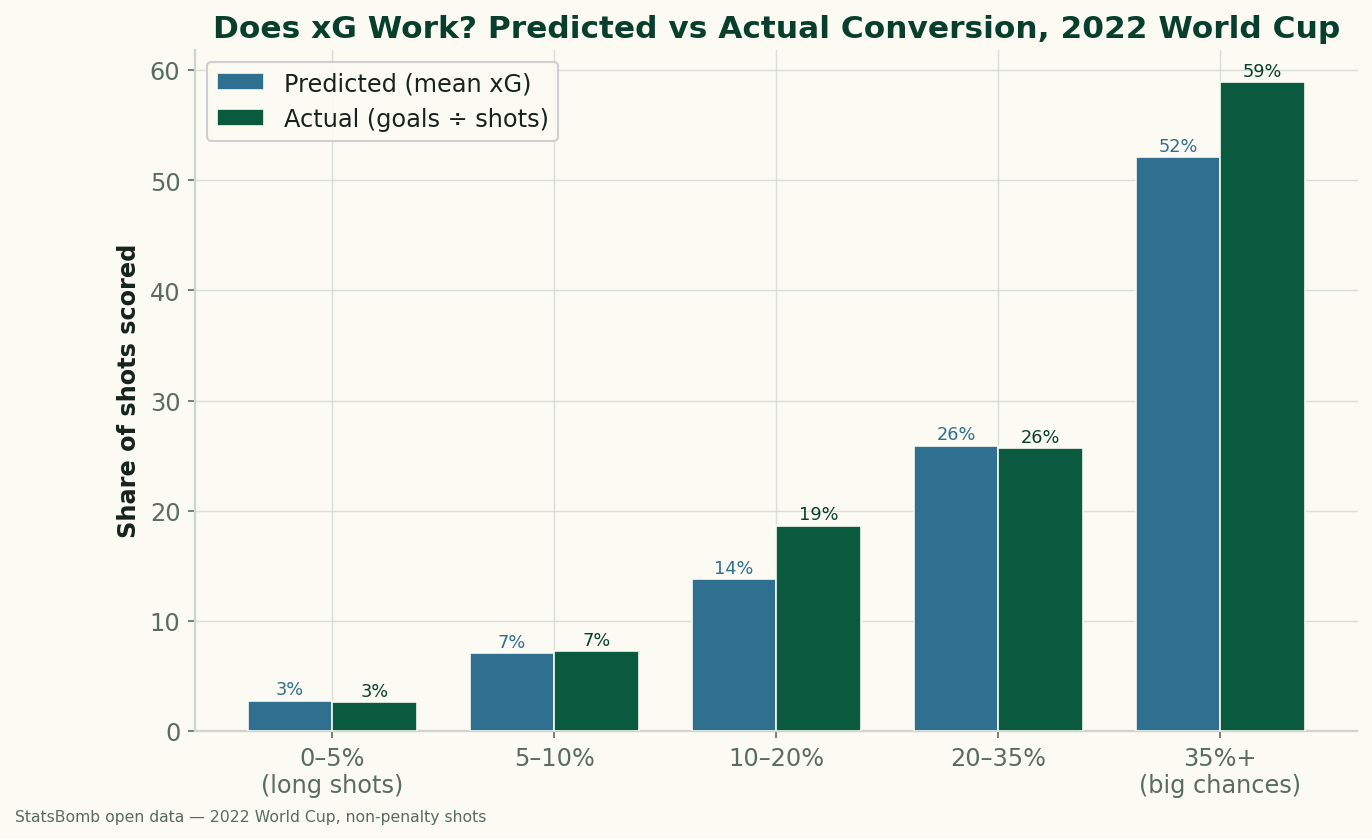
Does xG Actually Work? Big Chances vs Long Shots at the 2022 World Cup
We sorted every non-penalty shot from the 2022 World Cup by its expected-goals value and checked how often each band actually went in. xG holds up well: a 0–5% shot scored 2.6% of the time, a 'big chance' of 35%+ went in 58.9%. The calibration, and what a big chance is really worth.
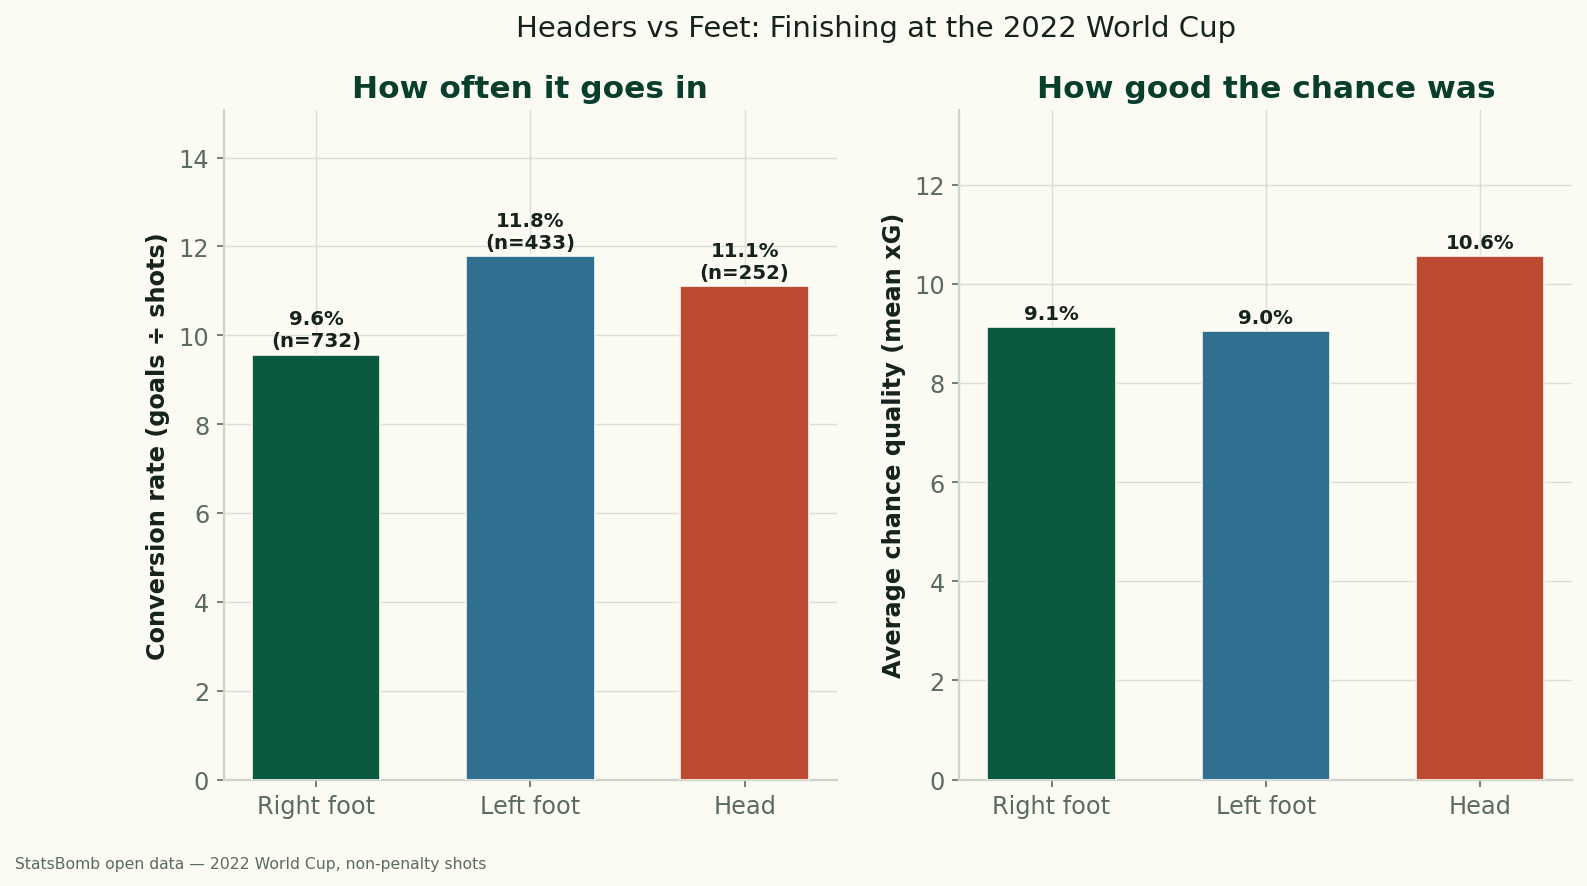
Headers vs. Feet: Which World Cup Shots Actually Go In?
Using StatsBomb data for all 64 matches of the 2022 World Cup, headers and feet convert at almost the same rate (11.1% vs 10.5%) — but only because headers come from higher-quality positions. Relative to chance quality, foot finishing beat the model, and the left foot was the most clinical of all.