The 2026 World Cup Is Cooling Off — and Still the Highest-Scoring in Generations
It opened at a goal-a-game pace not seen in decades, peaked at 3.26, and has settled to 2.98. Still sky-high — just no longer record-shattering.
When the goals were flying early, it looked like 2026 might be the most prolific World Cup of the modern era. It still might be — but the frenzy is calming down. Through 54 completed matches, the tournament is averaging 2.98 goals a game, down from a peak running average of 3.26 after the first month of action. That cooling is exactly what you'd expect as a small, hot sample regresses — and yet 2.98 is still a remarkable number: comfortably above 2022 (2.69) and 2018 (2.64), and the highest scoring rate at a World Cup since 1970.
Sourcing. Every figure is from the 54 completed matches only, pulled fresh from ESPN's public match feed and parsed in code (not from memory) on June 25, 2026. A dated snapshot of an ongoing tournament; completed games only, nothing invented for fixtures still to be played.
The exhibit: the running average, settling
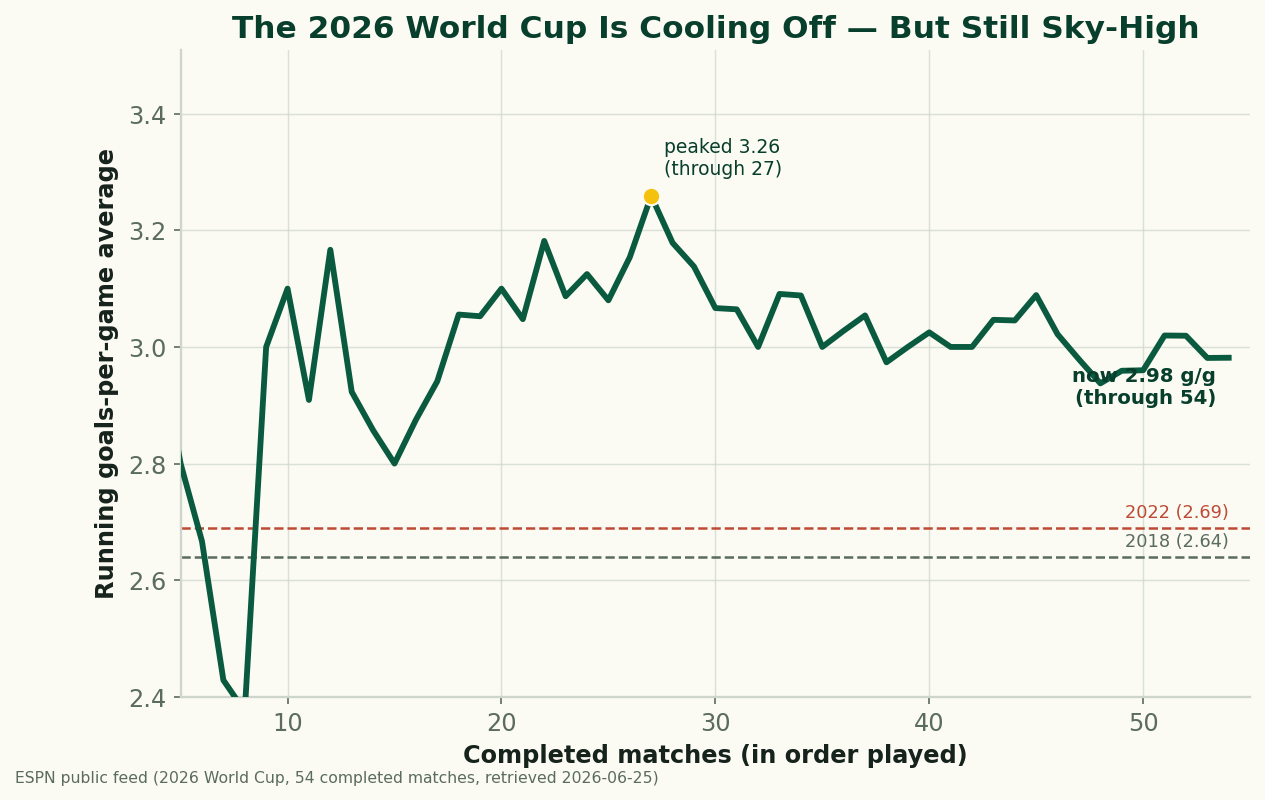
Read the curve left to right. The first handful of matches swing wildly — that's the small-sample noise any running average shows when one 5-goal game can move the line half a goal. By the 20-match mark it stabilizes in the low 3.0s, peaks at 3.26 around match 27, then grinds down toward 2.98. Crucially, even at its lowest the 2026 line never threatens the 2022 and 2018 baselines below it. This isn't a collapse in scoring; it's a record-hot start regressing toward a still-excellent number.
Why it cooled
Two ordinary forces explain the drift, and neither is “the goals dried up.” First, regression: early World Cup matches over-delivered on finishing, and finishing — as we found when we looked at xG overperformance — doesn't stay hot. A sample that opens above its true rate tends to fall back toward it. Second, tightening stakes: as the group stage progresses, more matches carry knockout implications, and teams that need only a draw to advance play more conservatively. The blowouts of matchday one give way to cagier must-not-lose affairs. Both pull the average down without anything dramatic happening.
Putting 2.98 in historical context
A shade under three goals a game sounds unremarkable until you line it up against history. The modern World Cup has lived in the 2.5–2.7 range for decades: 2.69 in 2022, 2.64 in 2018, 2.67 in 2014. You have to go back to 1970 (2.97) to find a tournament scoring at the rate 2026 is managing right now, and past that to the famously open tournaments of the 1950s for anything clearly higher. So even after cooling, 2026 is an outlier — the question is no longer “is this the highest-scoring ever?” (it isn't) but “why is it the highest in over half a century?” The expanded 48-team field, which brings in more lopsided matchups, is the leading suspect, a theme we explored in why 2026 is more polarized than 2022.
The honest caveats
- This is a moving snapshot. The figure is current as of 54 matches and will keep changing; the knockout rounds, which tend to be tighter and lower-scoring, are likely to pull the final number down further.
- Early volatility is real. The wild first few readings on the chart are small-sample artifacts, not a meaningful trend; only once a few dozen matches are in does the average mean much.
- Format inflates the rate. More teams means more mismatches in the group stage, which lifts scoring; comparing 2026's 48-team group stage to older 32-team tournaments isn't perfectly apples-to-apples.
- One source, completed games only. Counts come from a single public feed and exclude everything still unplayed.
The takeaway
The story of 2026's goals has shifted from “record-breaking” to “historically high and settling.” At 2.98 a game through 54 matches, this is still the most prolific World Cup since 1970, even as the early fireworks regress toward a more sustainable pace. Watch the line keep drifting once the knockouts begin — tighter, win-or-go-home football usually trims a tenth or two off the average. But the headline holds: by the standards of the last fifty years, 2026 has been a feast. For the fuller picture, see the World Cup hub and our early-tournament snapshot, the 2026 World Cup so far, by the numbers.
Reproduce it
Order the completed matches in data_layer/wc2026_results.json by date, accumulate total goals, and divide by the match count at each step to get the running average. Refresh the dataset with data_layer/build_wc2026_results.py (ESPN public feed, parsed in code). The chart is drawn by charts/chart_wc2026_scoring_pace.py. No network at build time, nothing hand-entered.
Sources & further reading
- Free textbook: Chapter 5: Introduction to Soccer Metrics — the theory behind this, at DataField.dev.
- 2026 results: bundled
data_layer/wc2026_results.json— ESPN public feed, 54 completed matches, retrieved 2026-06-25 viabuild_wc2026_results.py. Charted bycharts/chart_wc2026_scoring_pace.py. - Companion: the 2026 World Cup so far, by the numbers (the early snapshot) and why 2026 is more polarized.
- History: a century of World Cup scoring · the World Cup analysis & prediction hub.
More from World Cup 2026
The 2026 World Cup So Far, By the Numbers: Just Under 3 Goals a Game
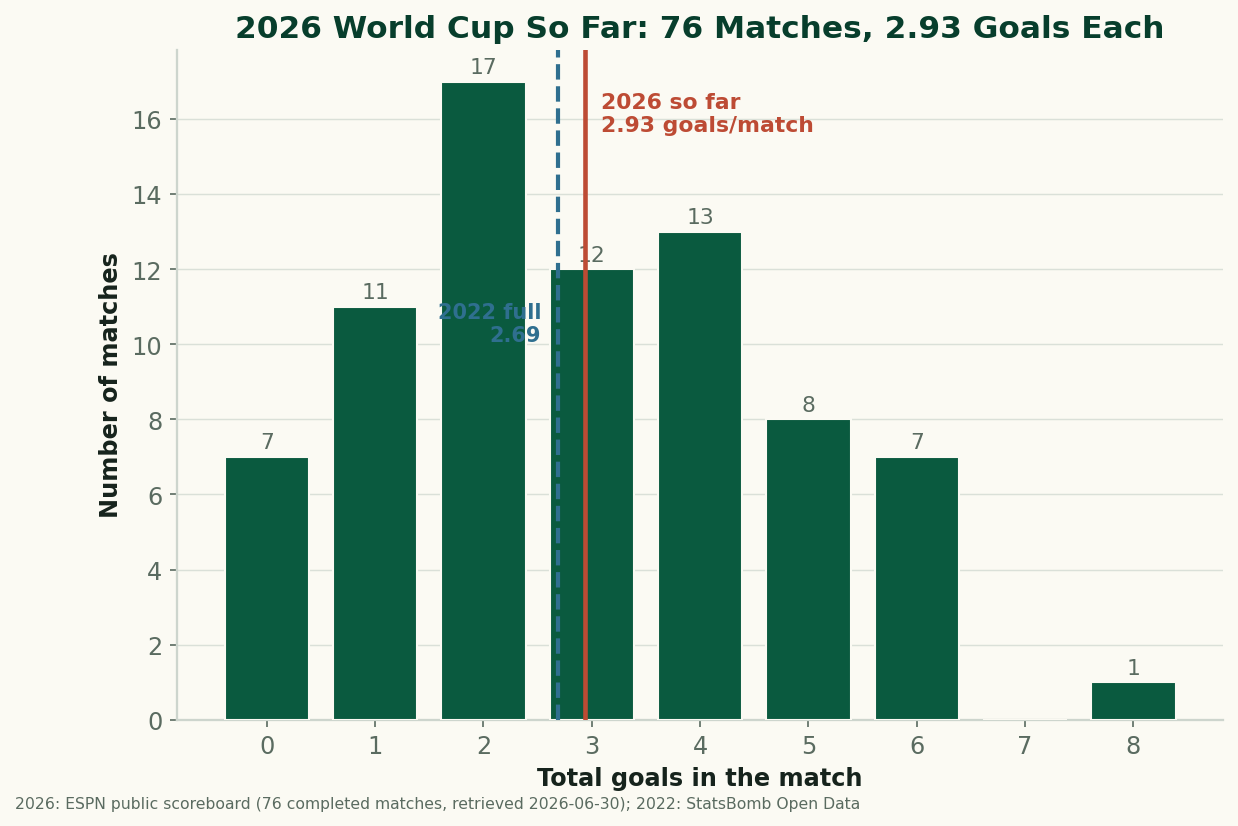
Through 76 completed matches, the 2026 World Cup is still outscoring 2022 — 2.93 goals a game to 2.69. After an early spike the rate has settled just under 3 a game. The real, sourced numbers on goals, draws, and the blowouts behind them, with honest caveats about a group-stage-only sample. (A living snapshot, refreshed as games are played.)
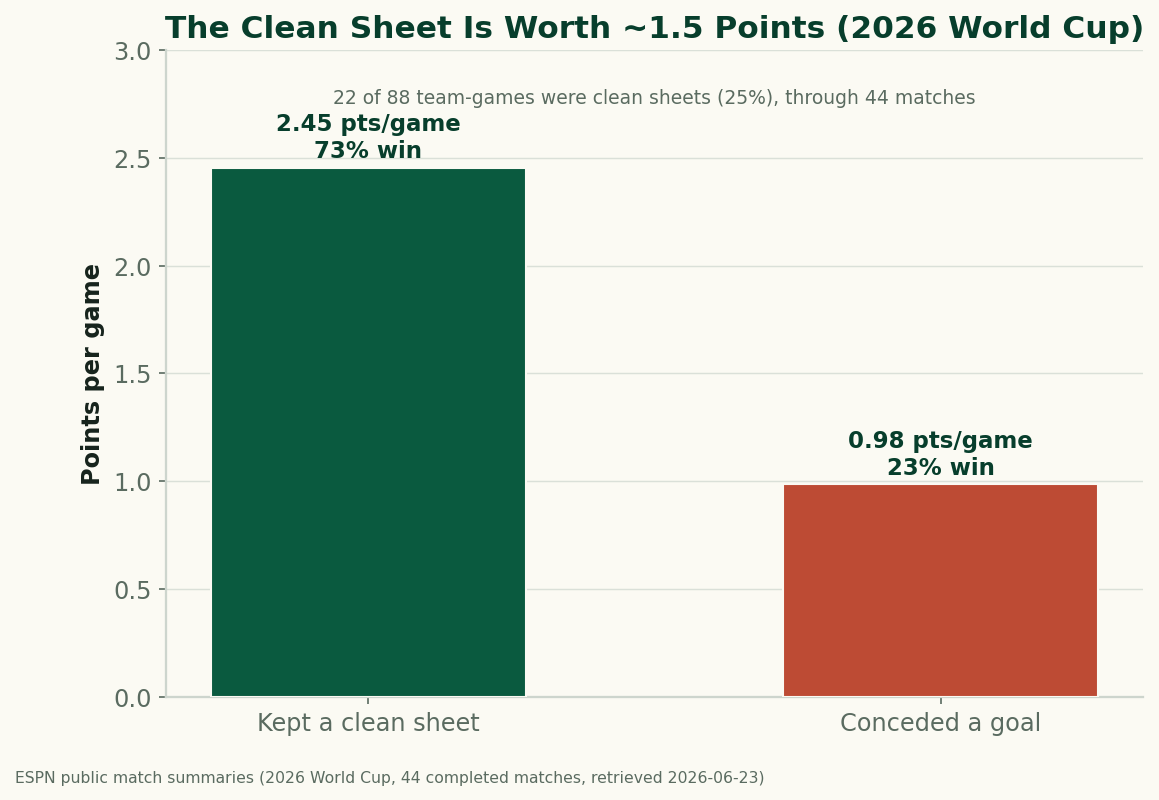
The Clean Sheet Is the Most Valuable Thing at the 2026 World Cup
Through 44 completed matches, a team that keeps a clean sheet at the 2026 World Cup averages 2.45 points and wins 73% of the time; a team that concedes averages under 1. Don't concede and you almost can't lose — the data on what a clean sheet is worth.
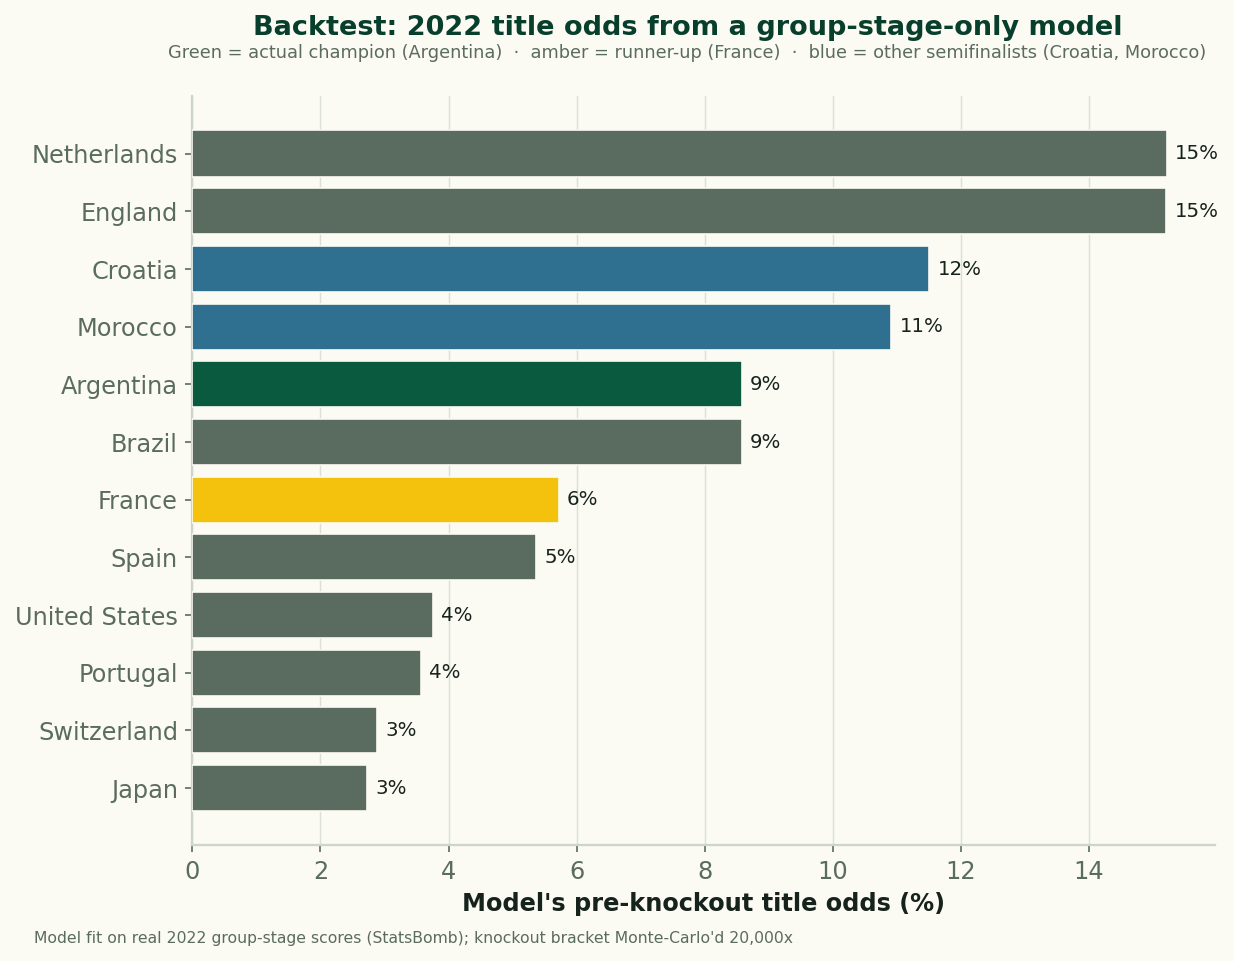
We Built a World Cup Prediction Model — Then Backtested It on 2022
A transparent Poisson prediction model, fit only on 2022 group-stage scores and Monte-Carlo'd through the real knockout bracket 20,000 times. Its top tier held the eventual champion and two of the four semifinalists — and no team topped 15%, which is the real lesson. Then we apply the same model, with loud caveats, to the 44 completed 2026 matches.