Inside the 2022 World Cup: what all 64 match results actually say
The knockouts are supposed to be cagey. In 2022 they were the opposite — 3.25 goals a game to the group stage's 2.50 — and the reason that number lies is exactly what makes it worth a look.
Everyone "knows" the knockout rounds of a World Cup are where the goals dry up: tight, cagey, terrified affairs where two evenly matched sides cancel each other out and the whole thing limps to penalties. So here is a fact that should give that intuition pause. I took the real results of all 64 matches of the 2022 World Cup — every scoreline, every stage, straight from StatsBomb Open Data — and the knockout rounds averaged 3.25 goals per match against the group stage's 2.50. The "tight knockouts" averaged thirty percent more scoring than the group games. That number is real, and it is also a trap, and untangling why is a small clinic in reading a tournament from its box scores rather than its highlight reel.
The finding: 172 goals, and where they fell
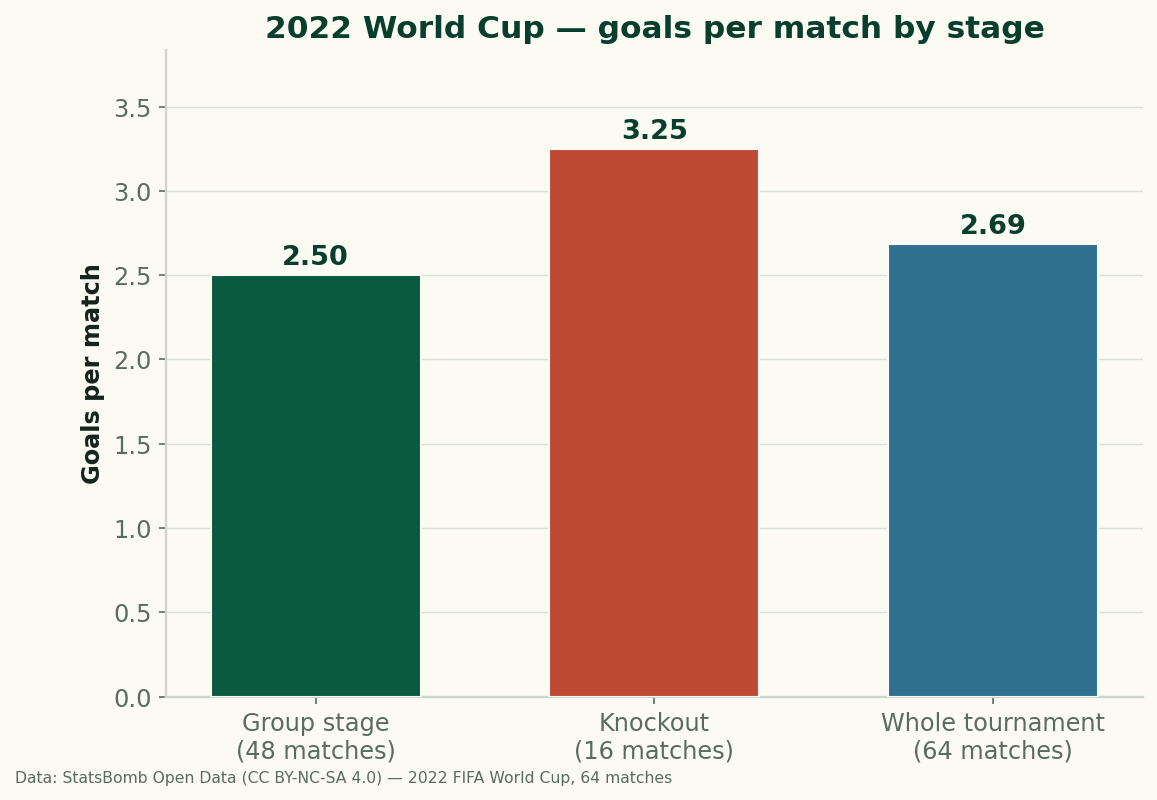
Start with the totals, because everything else hangs off them. Across the 64 matches the 2022 World Cup produced 172 goals — an average of 2.69 goals per match over the whole tournament. That is computed the only honest way: add every home_score and away_score in the results file, divide by 64. No estimation, no model. Now split it by stage:
| Stage | Matches | Goals | Goals / match |
|---|---|---|---|
| Group stage | 48 | 120 | 2.50 |
| Knockout rounds | 16 | 52 | 3.25 |
| Whole tournament | 64 | 172 | 2.69 |
Real values from StatsBomb Open Data, 2022 FIFA World Cup, all 64 matches. "Knockout" = Round of 16, quarter-finals, semi-finals, third-place play-off, and the final.
The gap is the headline, and it runs the opposite way to the folk wisdom. The forty-eight group games — three per group, the part of the tournament with the most to play for and the least to lose — were the cagey ones, at exactly 2.5 goals each. The sixteen win-or-go-home games averaged a goal and a half more between them, three-and-a-quarter apiece. Before I explain why that comparison is rigged (it is, and the rigging is the interesting part), look at the shape of the whole thing.
Exhibit: goals per match, by stage
And here is how those 172 goals distributed across the 64 individual matches — how many were goalless, how many were three-goal games, how many were blowouts:
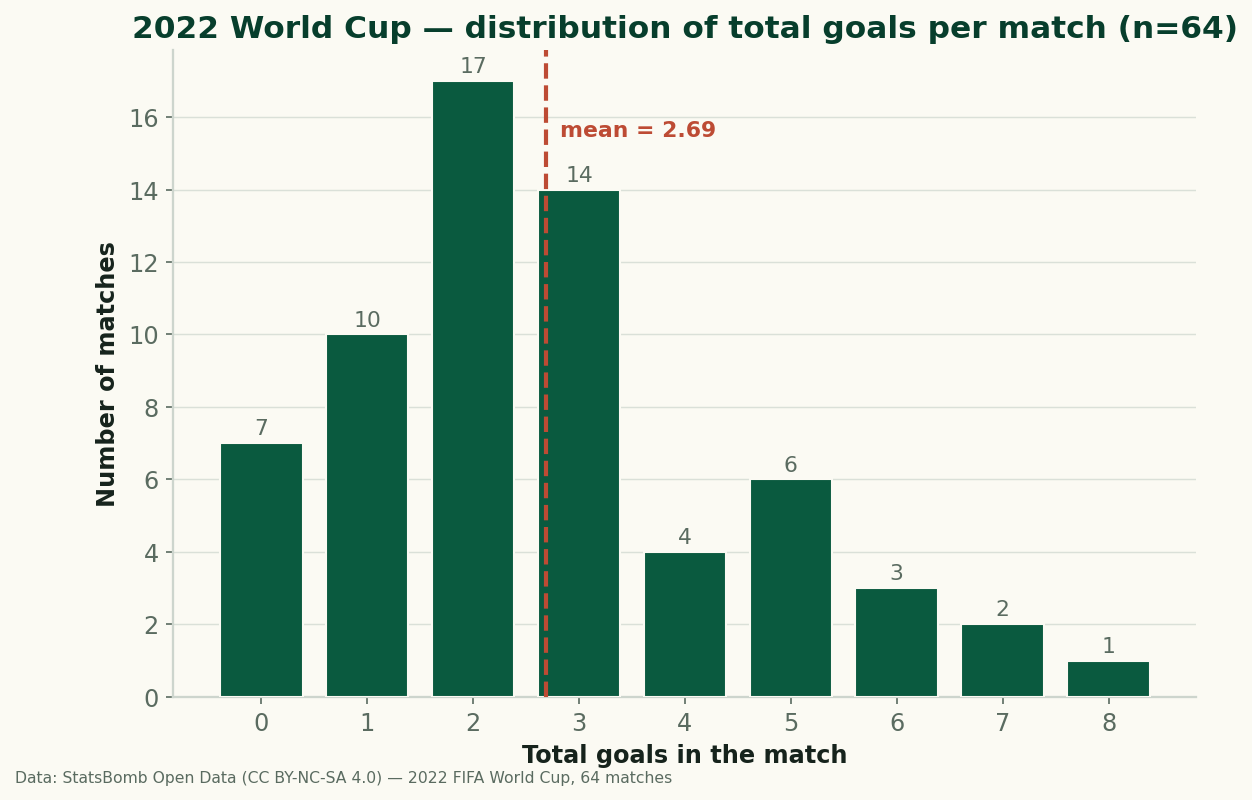
The distribution is the classic lumpy-Poisson shape you get from low-scoring sport: a fat cluster at one, two and three goals (41 of the 64 matches), a thin but real right tail of goal-fests, and a stubborn pile of seven goalless draws on the left. The single most common outcome was a two-goal match — seventeen of them, better than one game in four. The mean of 2.69 sits, as it usually does for goals data, to the right of the mode, dragged there by the high-scoring tail rather than describing any typical match. That is the first lesson of tournament data: the average is a real number that no single match looks like.
The scorelines: 2–0 was the World Cup's favourite result
Collapse every match onto its scoreline (treating 2–1 and 1–2 as the same result, since which team is "home" is meaningless at a neutral-venue World Cup) and a clear hierarchy appears:
| Scoreline | Matches |
|---|---|
| 2–0 | 12 |
| 2–1 | 11 |
| 1–0 | 10 |
| 0–0 | 7 |
| 1–1 | 5 |
| 3–0 / 3–1 / 3–2 / 4–1 | 3 each |
Top of the scoreline distribution; the long tail includes 3–3 (twice), 4–2, 6–1, 6–2 and a 7–0, one apiece.
2–0, 2–1 and 1–0 together — the three tightest "one team edges it" scorelines — account for 33 of the 64 matches, more than half the tournament. This is what a World Cup actually looks like underneath the drama: a slim margin, decided late, far more often than not. Which leads to the two numbers I find most telling of all:
- 24 of the 64 matches (37.5%) were decided by a single goal. Add the 15 draws and you have 39 matches — nearly two in three — that finished within one goal either way.
- Five matches finished level after extra time and went to a penalty shootout. All five sit in the knockout rounds, where a draw is not allowed to stand: Japan 1–1 Croatia and Morocco 0–0 Spain in the Round of 16; Netherlands 2–2 Argentina and Croatia 1–1 Brazil in the quarters; and the final itself, Argentina 3–3 France. (The results file records the score at which each went to spot-kicks; the shootout result is a separate fact of record, not a scoreline in the data.)
At the extremes: the highest-scoring match of the tournament was England 6–2 Iran, the opening-day eight-goal avalanche; the most lopsided was Spain's 7–0 dismantling of Costa Rica. At the other end, seven matches finished 0–0 — six of them in the group stage, plus Morocco's goalless Round-of-16 win over Spain that they took on penalties. One match in nine produced no goals at all.
A worked example: where the 2.50 comes from
"Goals per match" sounds like it might hide some weighting or adjustment. It does not — it is the most literal statistic in this whole piece, and it is worth doing two rows of it by hand so you can see there is nothing up my sleeve. Take two real group-stage results from the file:
- England 6–2 Iran — that match contributed 6 + 2 = 8 goals.
- Argentina 1–2 Saudi Arabia — the great upset — contributed 1 + 2 = 3 goals.
Those two group matches alone hold 11 goals across 2 games. Do that for all 48 group matches and the goals sum to 120; divide by 48 and you get 120 ÷ 48 = 2.50 goals per group match, exactly. Repeat over the 16 knockout games (52 goals) and you get 52 ÷ 16 = 3.25. Stack the two together — 172 goals over 64 matches — and 172 ÷ 64 = 2.6875, which rounds to the 2.69 on the chart. Every figure in this article is that same one-line arithmetic on the raw scores. There is no model here, and that is deliberate: results are one of the very few things in football you can count without estimating anything.
Honest limitations: why the knockout number lies
Now the part I would be cheating you out of if I stopped at "knockouts scored more." The 3.25 figure is true but unfair, for reasons that all push the same way:
- Extra time inflates the knockout total. Five of the sixteen knockout matches played an extra thirty minutes — the four that went to shootouts plus any that were level at 90 and won in extra time. A group game is 90 minutes; a third of these knockouts were 120. More minutes means more goals almost mechanically. On a strict per-90 basis the knockout scoring rate is meaningfully lower than 3.25, and the gap with the group stage narrows or closes. The results file gives me final scores, not the minute each goal was struck, so I cannot compute the per-90 rate from this dataset alone — and I will not invent it. That ceiling is the honest boundary of a results-only analysis.
- Survivorship skews who is left. By the knockouts the worst sides have gone home. A 7–0 mismatch is a group-stage phenomenon; a Portugal 6–1 against a tiring Switzerland is the rare knockout blowout. The teams are stronger and closer, which should suppress scoring — and yet the raw average rose, which only sharpens how much of the rise is the extra-time artefact.
- Caution genuinely does suppress open-play goals in knockouts — the folk wisdom is not wrong about behaviour, only about the final tally. A tied knockout doesn't end; it goes to extra time and then a lottery, so sides protect a point that protects nothing. The cageyness is real in the run of play; it is simply outweighed in the box score by the extra half-hour those cagey games then play.
- It is one tournament. Sixty-four matches is a single draw from a noisy process. Qatar 2022 had its own host conditions, its own draw, its own once-a-cycle storylines. None of these rates is a law of World Cups; they are the measured facts of this one. A neutral-venue tournament also strips out the home advantage that shapes club-season data, so don't port these averages onto a league.
Reproducibility: the code behind every number
Everything above comes from one file, data_layer/wc2022_matches.json, and a dozen lines of Python. The full chart script is in the repo at charts/chart_wc2022_tournament.py; the core that produces the by-stage rates is this:
import json, collections

ms = json.load(open("data_layer/wc2022_matches.json", encoding="utf-8"))
KNOCKOUT = {"Round of 16", "Quarter-finals", "Semi-finals",
            "3rd Place Final", "Final"}

def rate(rows):
    g = sum(m["home_score"] + m["away_score"] for m in rows)
    return g, len(rows), g / len(rows)

grp = [m for m in ms if m["competition_stage"]["name"] not in KNOCKOUT]
ko  = [m for m in ms if m["competition_stage"]["name"]     in KNOCKOUT]

print("group   ", rate(grp))   # (120, 48, 2.5)
print("knockout", rate(ko))    # (52, 16, 3.25)
print("all     ", rate(ms))    # (172, 64, 2.6875)

dist = collections.Counter(m["home_score"] + m["away_score"] for m in ms)
print(dict(sorted(dist.items())))  # {0:7, 1:10, 2:17, 3:14, ...}
The two figures above are drawn by that same script, so the chart and the table cannot drift apart. Re-run python charts/build_charts.py and you get identical PNGs and identical numbers, because they all read the one results file.
Synthesis: what a box-score tells you, and what it cannot
This is the coarsest possible view of a World Cup — nothing but the scores — and it still pays. It tells you the tournament was tight (a third of all matches decided by one goal), that the group stage was the careful part and the knockouts the chaotic-looking one, and that the average match no one actually saw — 2.69 goals — is the mean of a lumpy spread that ran from seven goalless draws to a single eight-goal opener. What a results file cannot tell you is which team deserved any of it. For that you have to go down a level, from scores to shots. The 2022 final is the cleanest case: it finished 3–3 and went to penalties, yet the shot-level xG breakdown of that final shows Argentina out-created France almost three to one in open play. The scoreline said "even"; the shot map said "rout." If you want the grammar of that next layer down, the guide to reading a World Cup shot map walks through dots sized by danger and goals ringed — the picture a box score can never draw.
And if a results table makes you want to run the counterfactual — what should these scorelines have been, or what happens if you replay the bracket — that is exactly what the tools here are for. Feed two teams' goal expectations into the xG outcome calculator and it turns them into win/draw/loss probabilities; or push a whole field through the World Cup simulator and watch how often the favourite actually survives seven one-off matches like these. Sixty-four games taught us the World Cup is a coin-flip dressed as a coronation. The simulator is how you make it flip the coins.
Sources & data
- Free textbook: Chapter 5: Introduction to Soccer Metrics — the theory behind this, at DataField.dev.
- StatsBomb Open Data — the match-results file for the 2022 FIFA World Cup (all 64 matches), CC BY-NC-SA 4.0. Every count, rate and scoreline here is computed directly from
home_score,away_scoreandcompetition_stagein that file. - Result of record: Argentina won the 2022 World Cup, beating France in the final — 3–3 after extra time, 4–2 on penalties, 18 December 2022 at Lusail Stadium.
- Anatomy of the 2022 World Cup final — the shot-by-shot xG story behind that 3–3, the level below the scoreline.
More from Data Deep-Dives
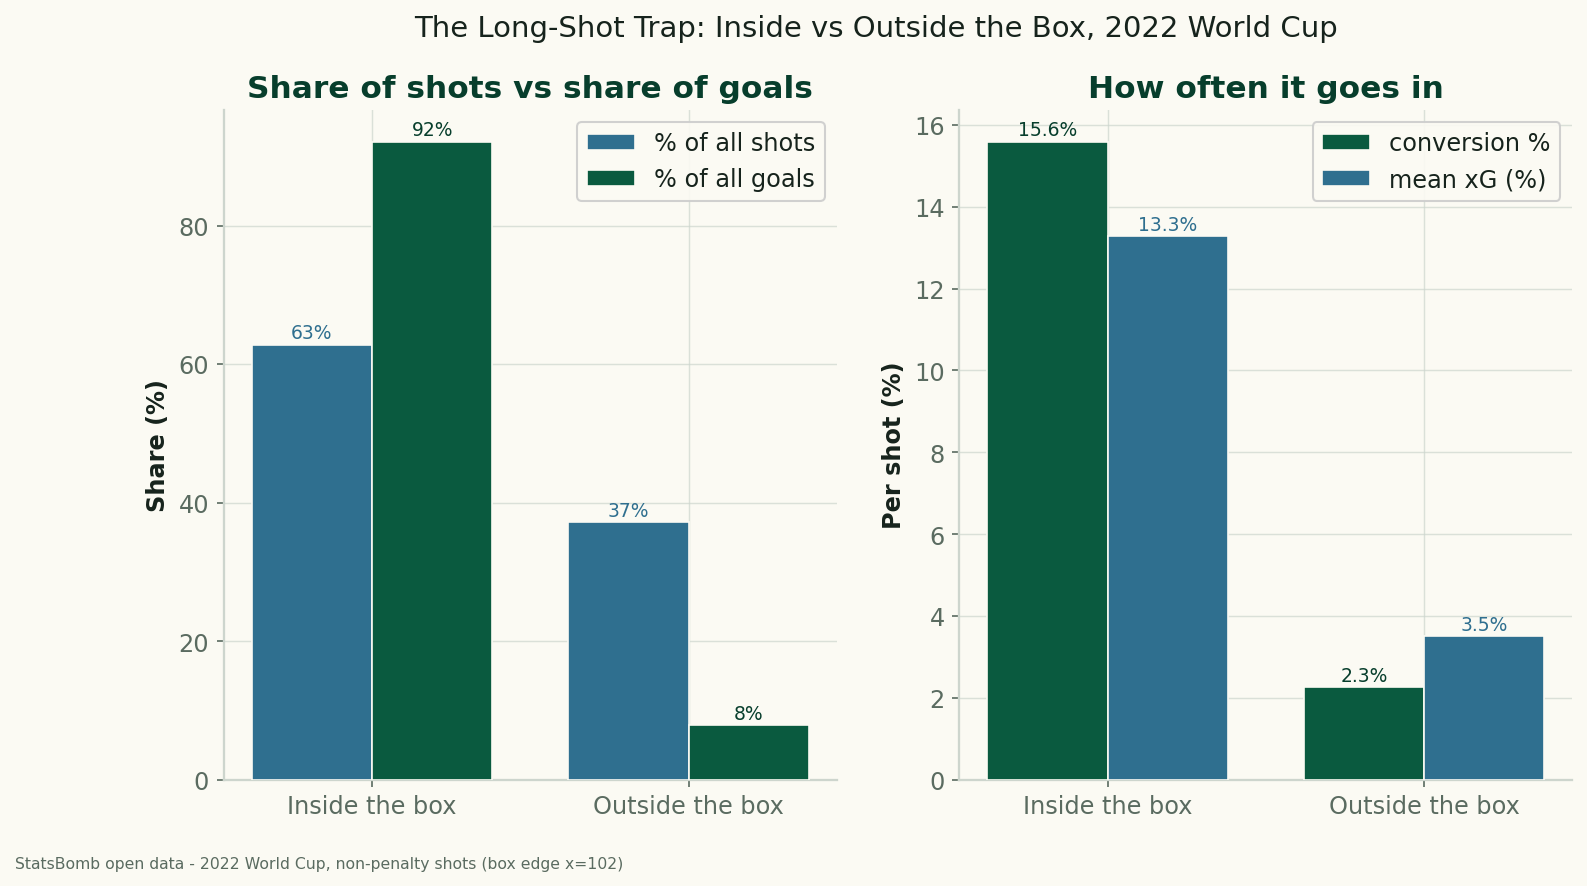
The Long-Shot Trap: Inside vs Outside the Box at the 2022 World Cup
Using StatsBomb data for all 64 matches of the 2022 World Cup, shots from outside the penalty box were 37% of all attempts but produced just 8% of the goals — a 2.3% conversion rate against 15.6% from inside. The data behind 'stop shooting from there.'
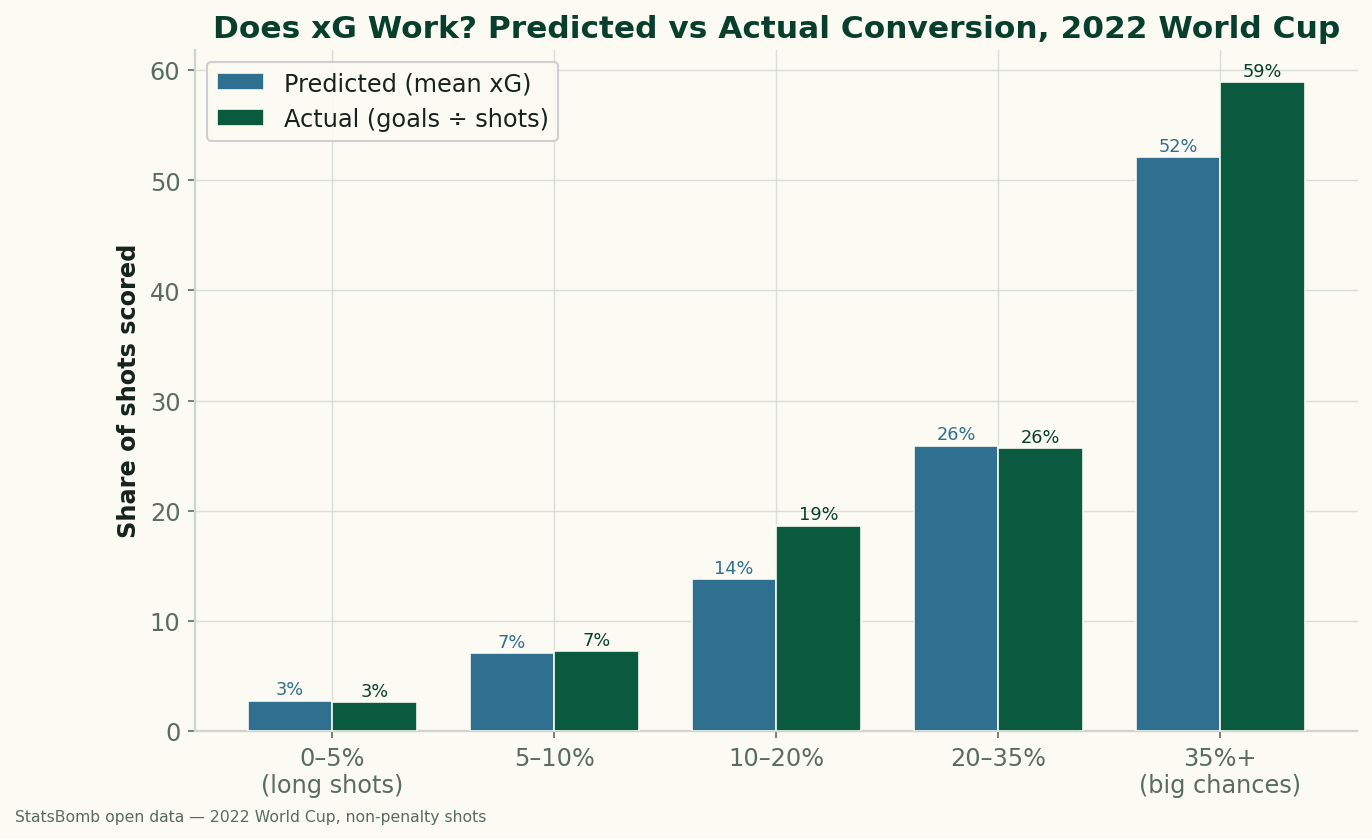
Does xG Actually Work? Big Chances vs Long Shots at the 2022 World Cup
We sorted every non-penalty shot from the 2022 World Cup by its expected-goals value and checked how often each band actually went in. xG holds up well: a 0–5% shot scored 2.6% of the time, a 'big chance' of 35%+ went in 58.9%. The calibration, and what a big chance is really worth.
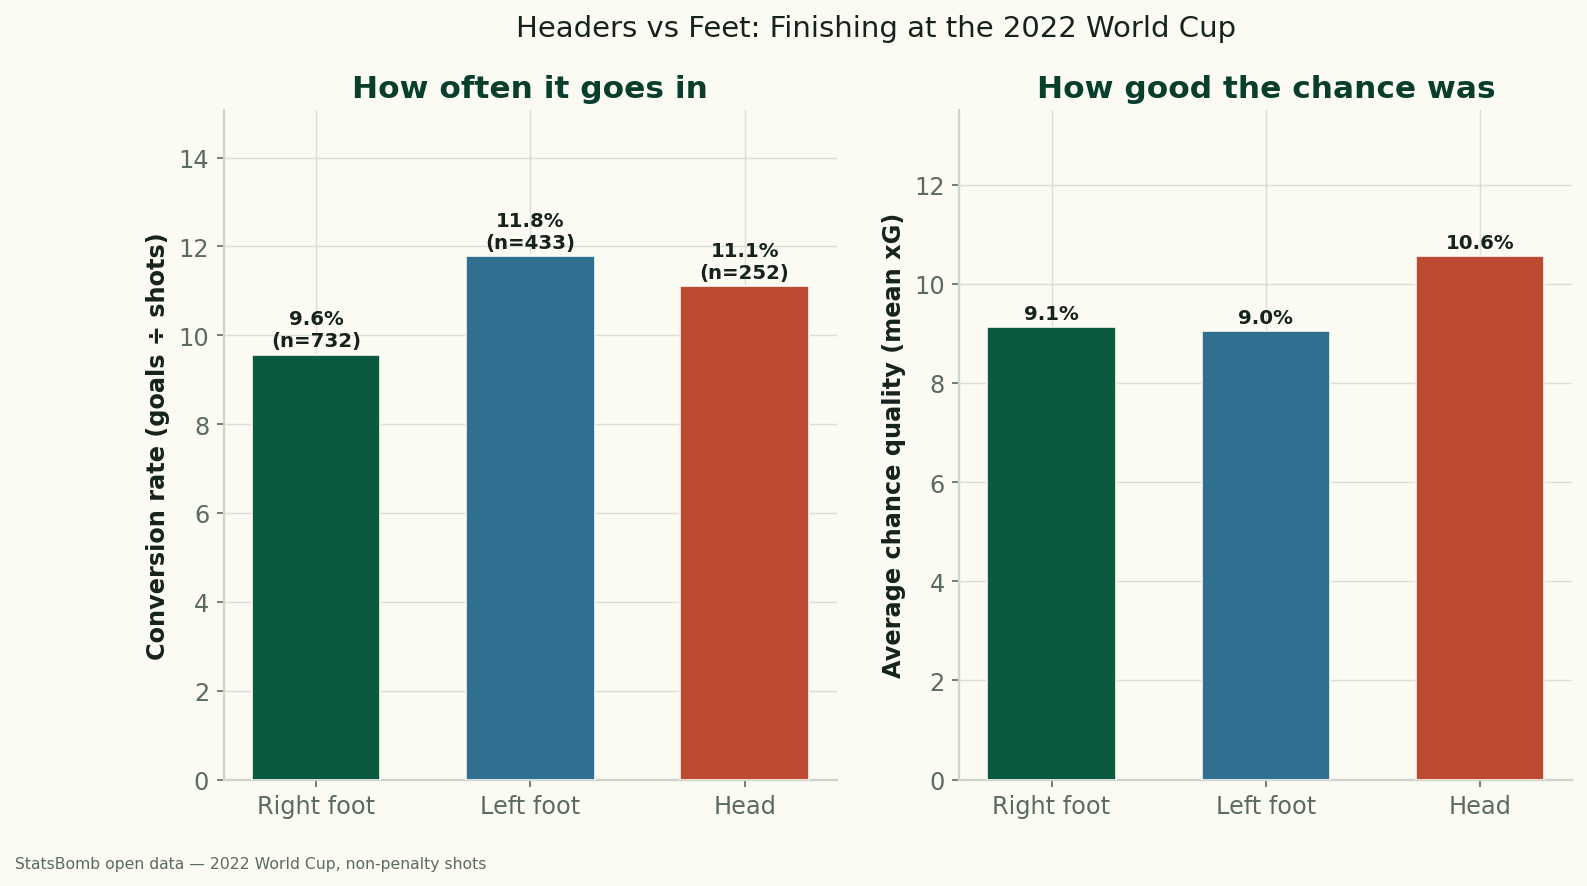
Headers vs. Feet: Which World Cup Shots Actually Go In?
Using StatsBomb data for all 64 matches of the 2022 World Cup, headers and feet convert at almost the same rate (11.1% vs 10.5%) — but only because headers come from higher-quality positions. Relative to chance quality, foot finishing beat the model, and the left foot was the most clinical of all.