Anatomy of the 2022 World Cup Final: the xG story of the greatest final ever
Three–three says it was even. The shot data says it was not — Argentina out-created France almost three to one in open play, and France's comeback ran on penalties.
The 2022 World Cup final gets called the greatest of all time, and for once the cliché survives contact with the data — but not for the reason the 3–3 scoreline implies. I pulled the real event file for the match (Argentina 3–3 France, won by Argentina in the shootout) and added up the expected goals on every one of the 30 in-match shots. The headline: in open play Argentina created 1.98 xG to France's 0.71 — nearly three times as much — and the only reason the match was level after 120 minutes is that France took two penalties worth 0.78 xG each. The final was a blowout that a referee's whistle, a Mbappé hot streak, and ninety seconds of madness turned into a coin-flip. This is the anatomy of how that happened, shot by shot, from the actual numbers.
The thesis: 3–3 hides a lopsided game
A scoreline is the noisiest one-number summary in sport. It records what went in, not what was created, and the 2022 final is the cleanest example I have ever charted of the gap between the two. Here are the real totals, computed directly from shot.statsbomb_xg on every Shot event in the match (the penalty shootout is excluded throughout — more on why below):
| Team | Shots | Total xG | Non-penalty xG | Penalty xG | Goals |
|---|---|---|---|---|---|
| Argentina | 20 | 2.76 | 1.98 | 0.78 | 3 |
| France | 10 | 2.27 | 0.71 | 1.57 | 3 |
Real values from StatsBomb Open Data, match 3869685; regulation + extra time, shootout excluded.
Total xG looks close — 2.76 to 2.27 — and that is exactly the trap. Strip out the penalties and the picture inverts into a rout: Argentina manufactured 1.98 expected goals of open-play chance to France's 0.71. France's two in-match penalties (both converted by Kylian Mbappé) carry 0.78 xG apiece, and StatsBomb's model rates every penalty identically at 0.78 because position and angle are fixed. Two of those is 1.57 xG — more than double everything else France generated all night from open play and set pieces combined. Argentina, by contrast, took one penalty and built the rest of their 2.76 from twenty shots spread across the whole final third. That is the whole story in two rows: one team played a final, the other was awarded one.
Exhibit A — the shot map
Plot every in-match shot on its half of the pitch, size each dot by its xG, ring the goals, and the asymmetry becomes physical. (If the grammar of this graphic is new to you, I wrote a primer on reading a World Cup shot map — dots sized by danger, goals ringed.)
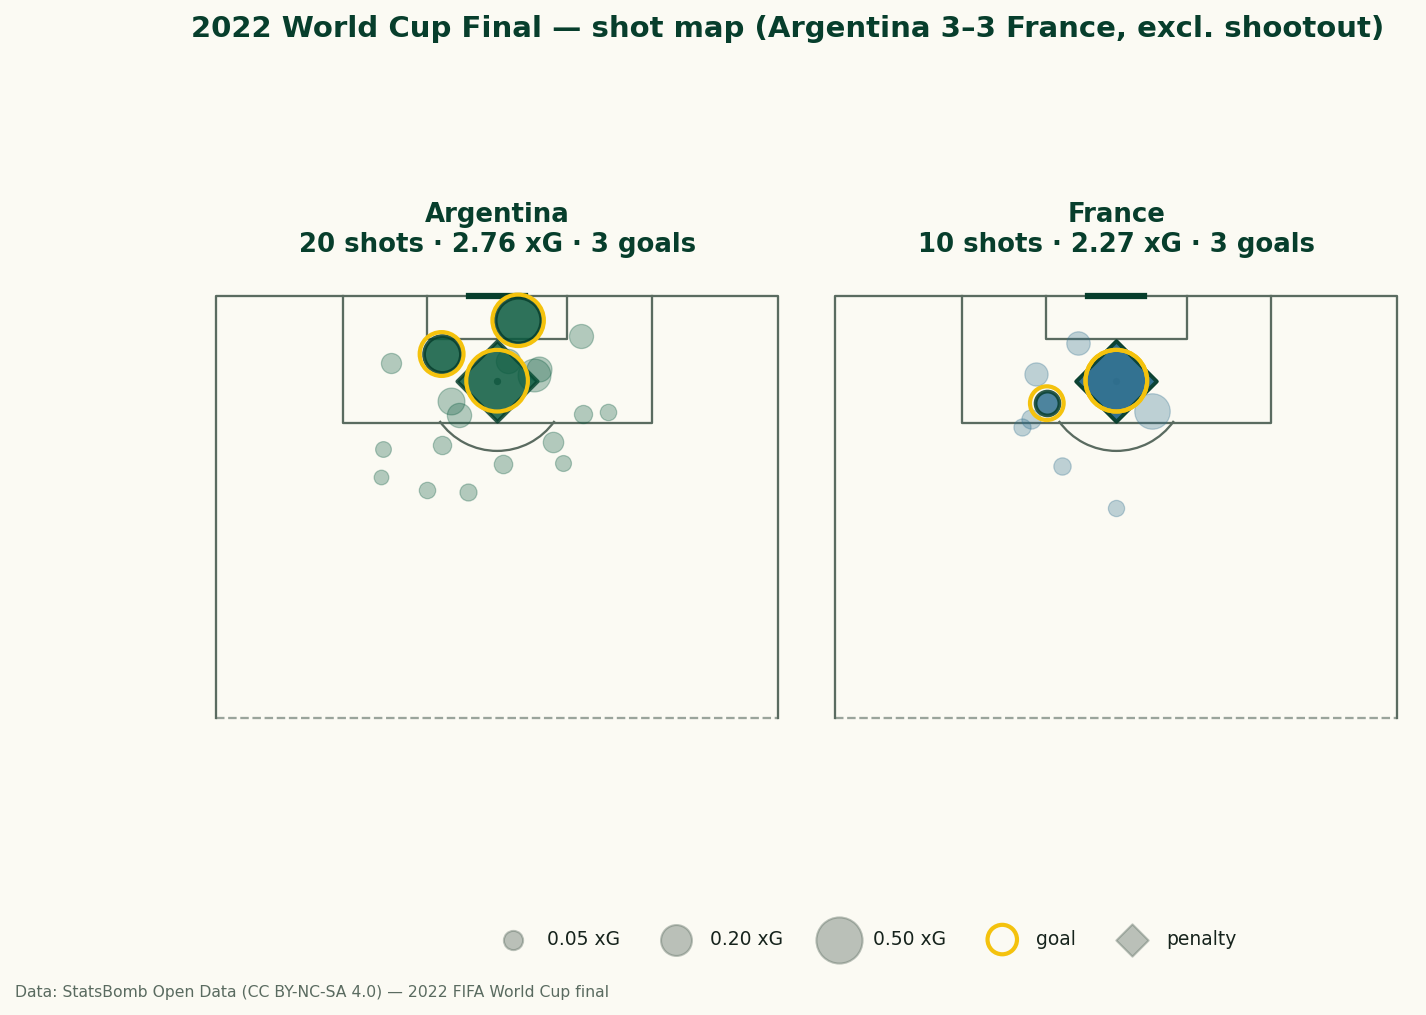
Argentina's half is busy: a cluster of central, high-value chances inside the six- and eighteen-yard boxes, plus a scatter of lower-xG efforts from the edge of the area — the signature of a team that kept getting into dangerous positions. France's half is almost empty by comparison. Two of their three biggest markers are the penalty diamonds, sitting on the spot. Remove those and France's open-play map is a single ringed goal (Mbappé's 0.10 xG volley) and a thin handful of low-value attempts. The one genuinely big France open-play chance — Randal Kolo Muani's 0.28 xG strike in the 122nd minute, saved by Emiliano Martínez — is the lone large open-play dot on their side, and it did not go in. The map is the argument: this was a one-sided creation contest with a balanced scoreboard bolted on top.
Exhibit B — the xG race
The shot map shows how much and where; it loses when. For that I built the cumulative xG "race" — each team's running xG total stepping up at the minute of every shot, so the steepness shows when chances arrived and the gap shows who deserved more at any moment.
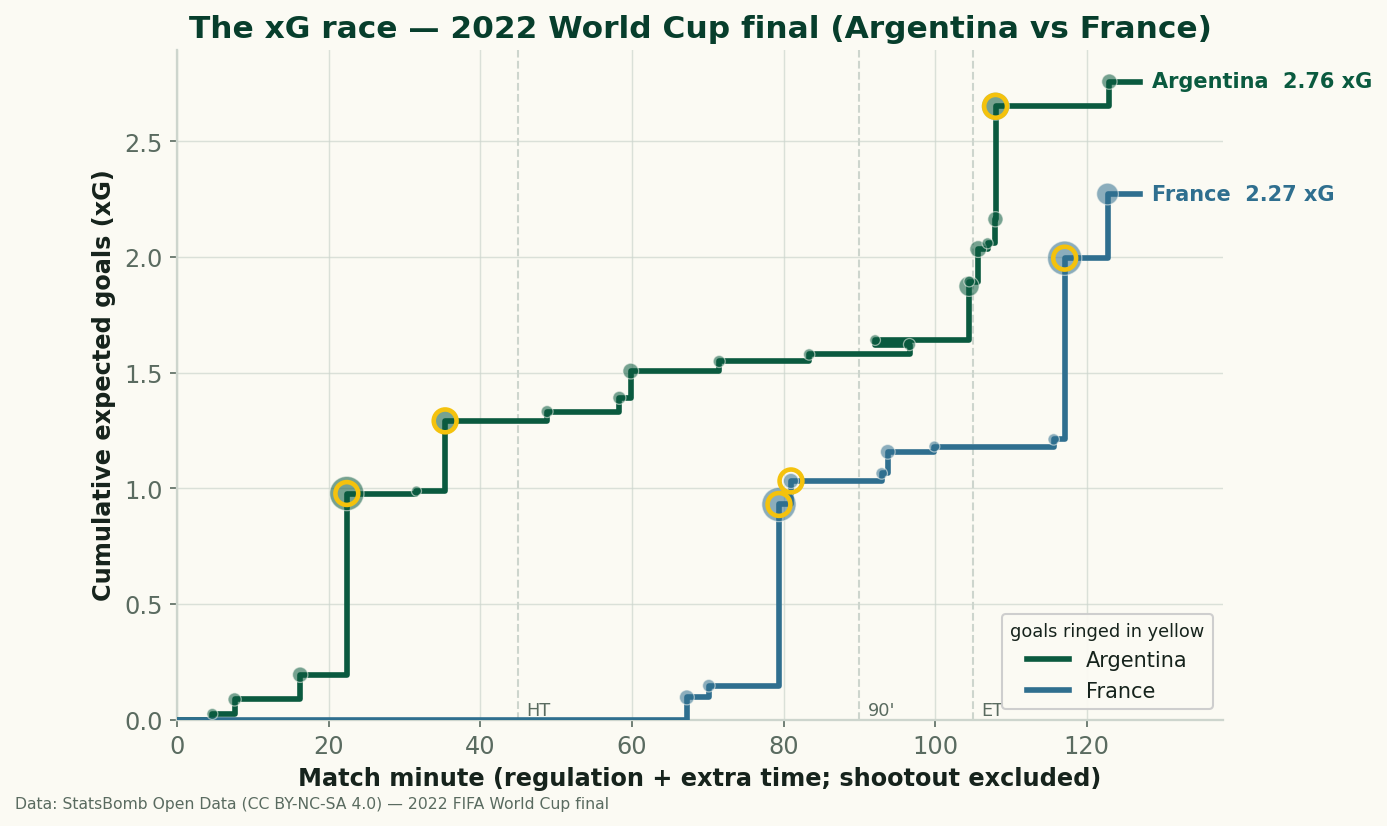
Read it left to right and the drama is right there in the geometry. Argentina's green line pulls ahead inside the first half — Messi's penalty (min 22) and Ángel Di María's 0.30 xG goal (min 35) — and it never relinquishes the lead, not once across 120 minutes. France's blue line is the tell: it is essentially flat from the 5th minute to the 79th. For seventy-four minutes France generated almost nothing. Then comes the vertical cliff — the 79th-minute penalty, Mbappé's 80th-minute volley, the equaliser sequence that turned 2–0 into 2–2 in ninety-seven seconds. The race chart renders that famous collapse as what it statistically was: not a tide turning, but two near-instant spikes against a backdrop of an hour of inactivity. Even after the late surge and the extra-time exchange, France's line never catches Argentina's. The team that was on top the entire match was, by the only continuous measure we have, on top the entire match.
A worked example: how the xG actually adds up
It is worth seeing the arithmetic, because "xG" can feel like a black box and it is not. Every Shot event in the file carries a statsbomb_xg field — the model's estimate of the probability that an average player scores that shot. A team's total is just the sum. Take three of Argentina's real shots:
- Messi penalty, 22' — 0.783 xG (every penalty scores ~78% of the time). Goal.
- Di María, 35' — 0.303 xG, a clean finish from the left of the box. Goal.
- Messi, 107' — 0.488 xG, the close-range tap-in that made it 3–2. Goal.
Those three alone sum to 0.783 + 0.303 + 0.488 = 1.574 xG. Argentina's full twenty shots add to 2.758. So just three chances account for well over half their total — this was a team taking a mix of one or two gilt-edged chances and a long tail of half-chances, exactly the profile the shot map shows. Now compare France: their entire open-play output across the match was 0.706 xG, less than half of Argentina's three biggest shots. France scored three times from a non-penalty xG of 0.71, which is finishing of a kind that does not repeat — Mbappé's 0.10 xG volley alone is the sort of strike that goes in maybe one time in ten. The model is not saying France were bad; it is saying France were finishing at a rate no team sustains, and that the underlying chances belonged overwhelmingly to Argentina.
Try it: turn these xG totals into a result
If both teams' chances had paid out at an average rate, what should the scoreline have been? Drop the real open-play-plus-penalty totals into the calculator below — try Argentina 2.76 against France 2.27 — and it models each side's goals as a Poisson count with that mean, builds the full scoreline grid, and returns win, draw and loss probabilities plus expected points. With these inputs Argentina come out clear favourites to have won in normal time, which is the point: the chances pointed one way, the night went another.
This calculator needs JavaScript. The method: model each team's goals as Poisson with mean equal to its total xG, build the scoreline grid, sum it into win / draw / loss, then xPoints = 3·P(win) + 1·P(draw).
Open this calculator on the tools page → · or run a whole bracket in the tournament simulator.
Honest limitations: what this analysis cannot tell you
I would be breaking my own rules if I let the xG do more work than it can. Several caveats, and they matter:
- xG ignores game state. Argentina led 2–0 for an hour and, like any side defending a lead, will have shaded toward control over risk. Some of France's flat line is a team being kept at arm's length; some of Argentina's volume came against a side chasing the game late. Game state warps shot data, and a full-match total cannot separate the two.
- xG says nothing about the goalkeeper or the finish. The model rates the chance, not the strike. Mbappé's 0.10 xG volley was an extraordinary contact; Emiliano Martínez's extra-time save on Kolo Muani's 0.28 xG chance was an extraordinary stop. xG is blind to both, which is precisely why it is a measure of chance quality and not of performance.
- Penalties are not run-of-play. I report non-penalty xG separately for a reason: a fixed 0.78-xG penalty tells you nothing about how a team built an attack. France's 1.57 penalty xG is real, but it is a different kind of number from open-play creation, and lumping them together is how 3–3 came to look "even" in the first place.
- It is one match. Everything here describes a single 120-minute sample. xG is an honest instrument over a season and a soft suggestion over one game. This piece is an autopsy of this final, not a claim about either team's quality in general.
- And the shootout is excluded entirely. Argentina won the match on penalties, 4–2 in the shootout after 3–3 — a public, primary-source fact — but a shootout is not run-of-play football and its kicks carry no meaningful open-play xG, so none of it appears in any total above.
Reproducibility: the code behind the totals
Every number in this piece comes from one file, data_layer/wc2022_final_3869685_events.json, and a few lines of Python. The full chart script lives in the repo at charts/chart_wc2022_final.py; the core that computes the totals is this:
import json, collections

events = json.load(open("data_layer/wc2022_final_3869685_events.json", encoding="utf-8"))
# Shots only, and drop the penalty shootout (StatsBomb period 5).
shots = [e for e in events
         if e["type"]["name"] == "Shot" and e["period"] != 5]

agg = collections.defaultdict(lambda: {"xg": 0.0, "pen": 0.0, "n": 0, "g": 0})
for s in shots:
    t, sh = s["team"]["name"], s["shot"]
    xg = sh["statsbomb_xg"]
    agg[t]["xg"] += xg
    agg[t]["n"]  += 1
    if sh.get("type", {}).get("name") == "Penalty":
        agg[t]["pen"] += xg
    if sh.get("outcome", {}).get("name") == "Goal":
        agg[t]["g"] += 1

for team, d in agg.items():
    print(f"{team}: {d['n']} shots, {d['xg']:.3f} xG "
          f"({d['xg']-d['pen']:.3f} non-pen), {d['g']} goals")
# Argentina: 20 shots, 2.758 xG (1.975 non-pen), 3 goals
# France:    10 shots, 2.273 xG (0.706 non-pen), 3 goals
The two figures above are generated by the same script that prints those totals, so the chart and the table cannot drift apart. Re-run it with python charts/build_charts.py and you get the identical PNGs and numbers, because they all read the one event file.
Synthesis: what the greatest final teaches about reading a match
The 2022 final is the case study I reach for whenever someone tells me xG "doesn't capture the drama." It captures it perfectly — it just refuses to lie about it. The drama was real: a 2–0 lead, a 97-second collapse, a Mbappé hat-trick, a shootout for the trophy. But the match was lopsided, and the data is the only honest witness to that, because the scoreboard and the highlight reel both conspire to remember the goals and forget the hour of Argentine control that surrounded them. Lay the two exhibits side by side — the shot map for the shape of it, the xG race for the timing — and you get a reading no box score offers: who deserved it, and exactly when the deserving and the happening came apart.
That gap between deserved and happened is the whole reason this site exists. If you want the machinery for turning these totals into a fairer result, the expected points piece walks through modelling a match's xG into win/draw/loss probabilities; the shot-map primer covers the graphic; and the tournament simulator lets you push those probabilities all the way through a bracket. The 2022 final is what all of it is for: a tool to see the game the scoreline is hiding from you.
Sources & data
- Free textbook: Chapter 5: Introduction to Soccer Metrics — the theory behind this, at DataField.dev.
- StatsBomb Open Data — the event file for the 2022 World Cup final (match 3869685), CC BY-NC-SA 4.0. Every xG value here is StatsBomb's
shot.statsbomb_xg; the totals and both charts are computed from it. - Result of record: Argentina 3–3 France after extra time; Argentina won 4–2 on penalties, 18 December 2022, Lusail Stadium — the 2022 FIFA World Cup final.
- Expected goals explained — what an xG value actually means before you start summing them.
More from Data Deep-Dives
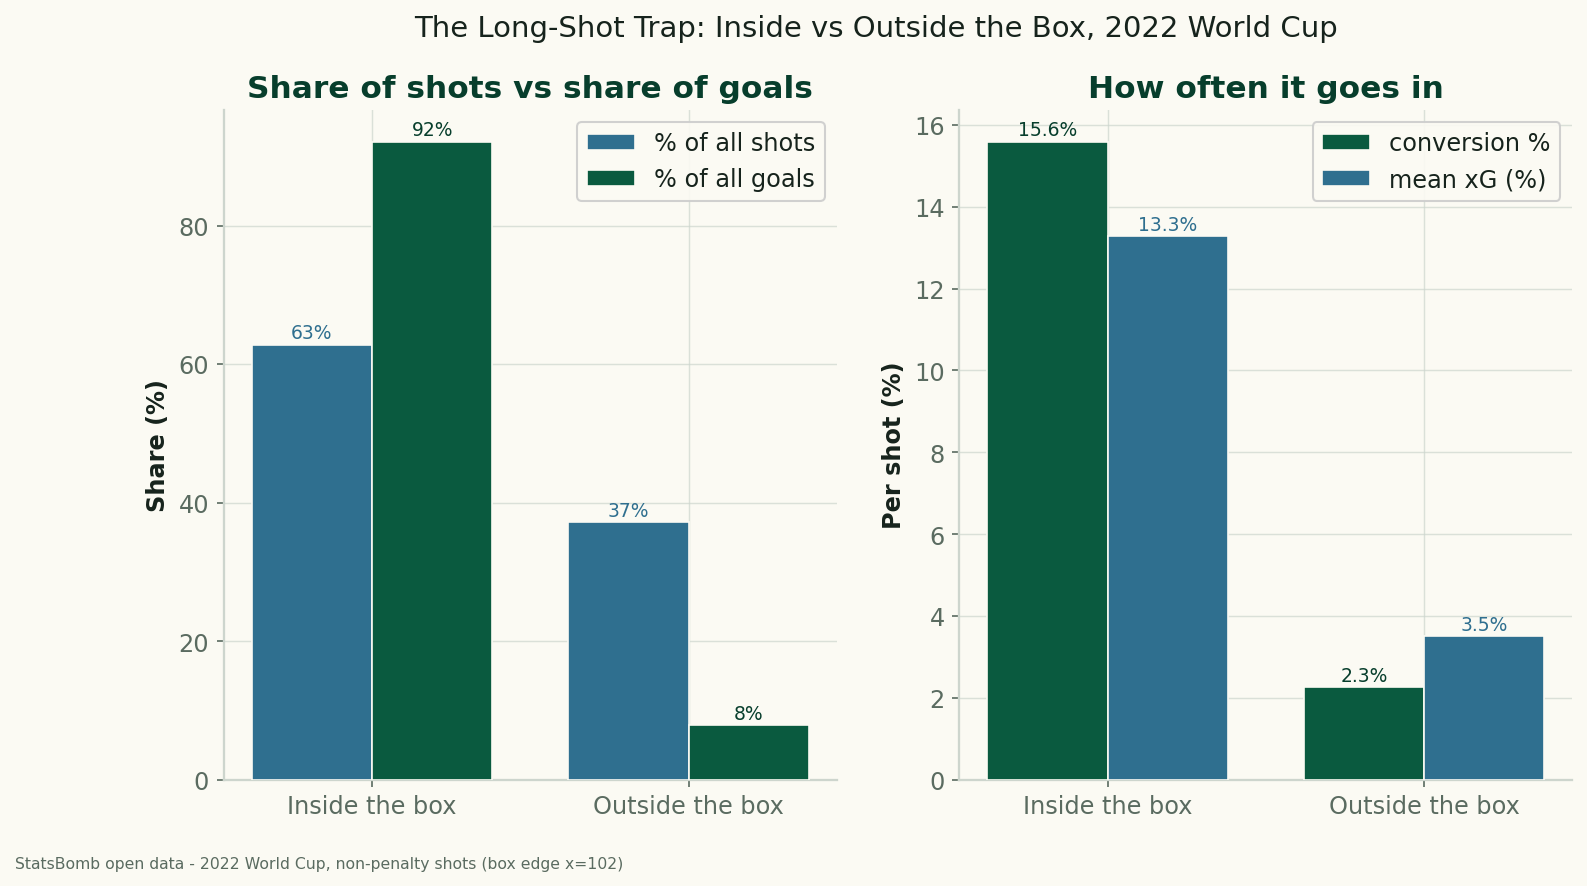
The Long-Shot Trap: Inside vs Outside the Box at the 2022 World Cup
Using StatsBomb data for all 64 matches of the 2022 World Cup, shots from outside the penalty box were 37% of all attempts but produced just 8% of the goals — a 2.3% conversion rate against 15.6% from inside. The data behind 'stop shooting from there.'
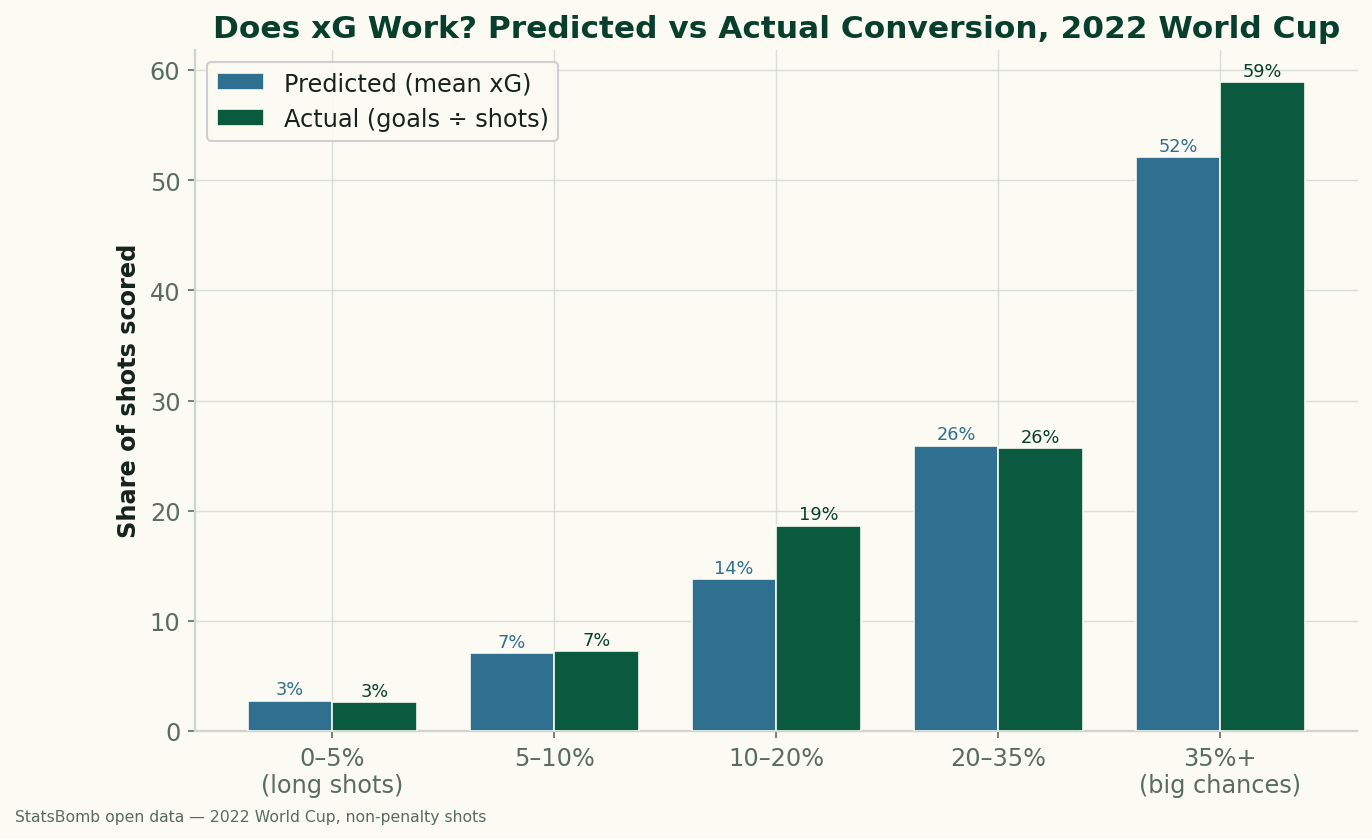
Does xG Actually Work? Big Chances vs Long Shots at the 2022 World Cup
We sorted every non-penalty shot from the 2022 World Cup by its expected-goals value and checked how often each band actually went in. xG holds up well: a 0–5% shot scored 2.6% of the time, a 'big chance' of 35%+ went in 58.9%. The calibration, and what a big chance is really worth.
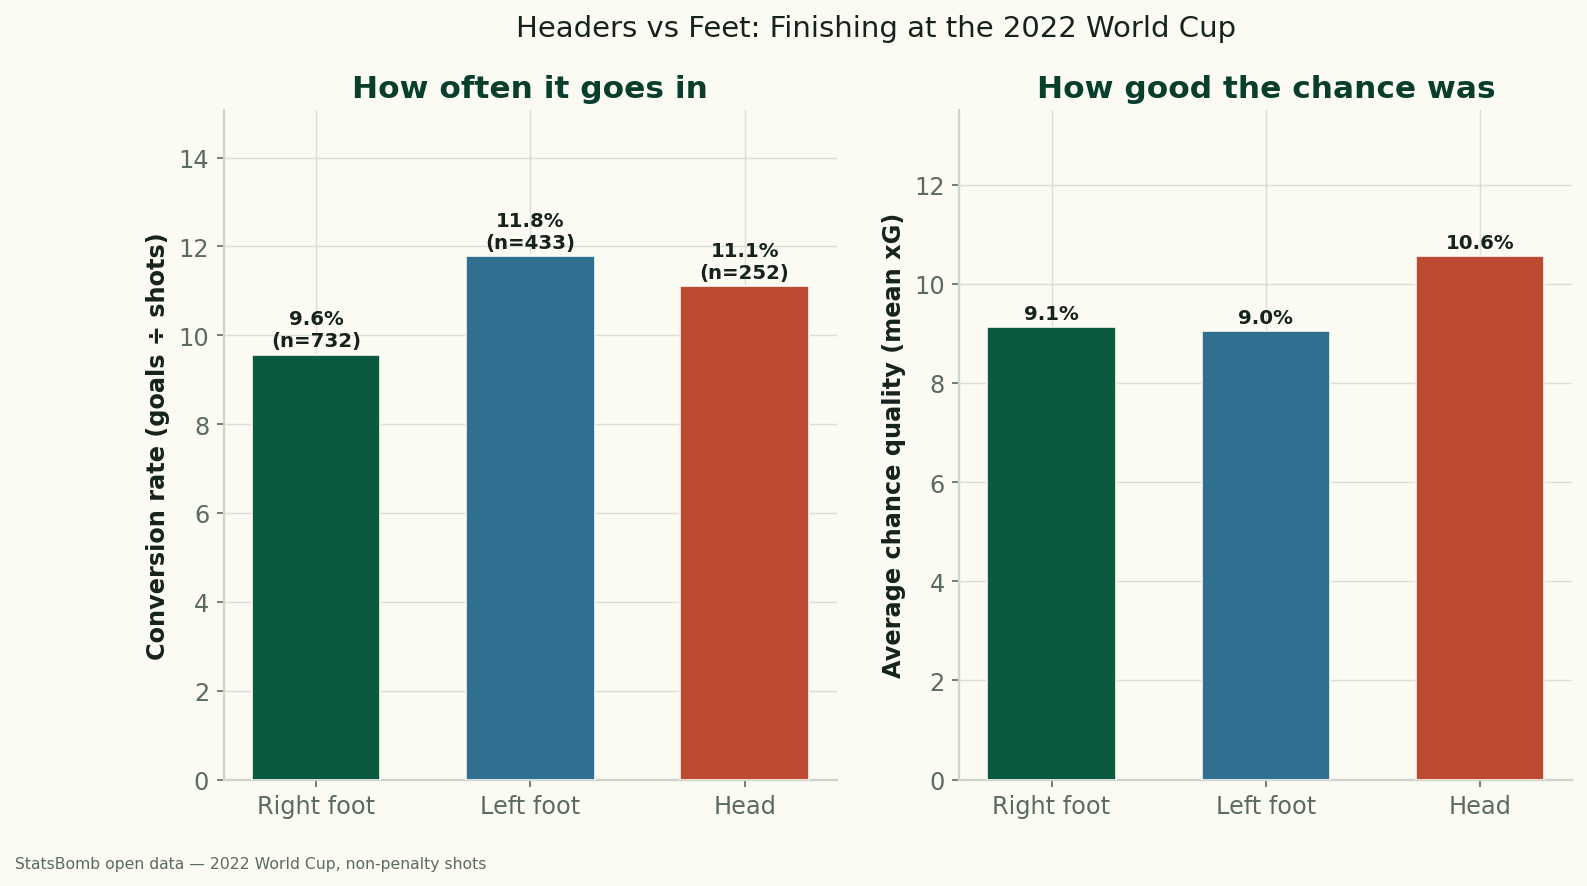
Headers vs. Feet: Which World Cup Shots Actually Go In?
Using StatsBomb data for all 64 matches of the 2022 World Cup, headers and feet convert at almost the same rate (11.1% vs 10.5%) — but only because headers come from higher-quality positions. Relative to chance quality, foot finishing beat the model, and the left foot was the most clinical of all.