Possession Isn't Control: What the Passing Data Says About the 2022 World Cup Final
Argentina controlled the ball; France controlled the scoreboard for 97 mad seconds. What 'control' actually meant in the wildest final ever.
The 2022 World Cup final is remembered as chaos — Argentina cruising, then Mbappé's two goals in 97 seconds, then extra time, then more goals, then penalties. But strip the match down to its 4,407 on-ball events and a much calmer story sits underneath the madness: for most of the night, Argentina controlled the ball almost completely, and it still wasn't enough to win in regulation. The passing data is a clinic in why "control" and "winning" are two different things that we constantly mistake for one.
The control scorecard
I took the real StatsBomb event feed for the match and computed, for each side, the unglamorous metrics that measure who actually ran the game: share of on-ball events (a possession proxy), pass completion, passes into the final third, progressive passes, and carries. Every number below is counted directly from the events — nothing modelled, nothing invented.
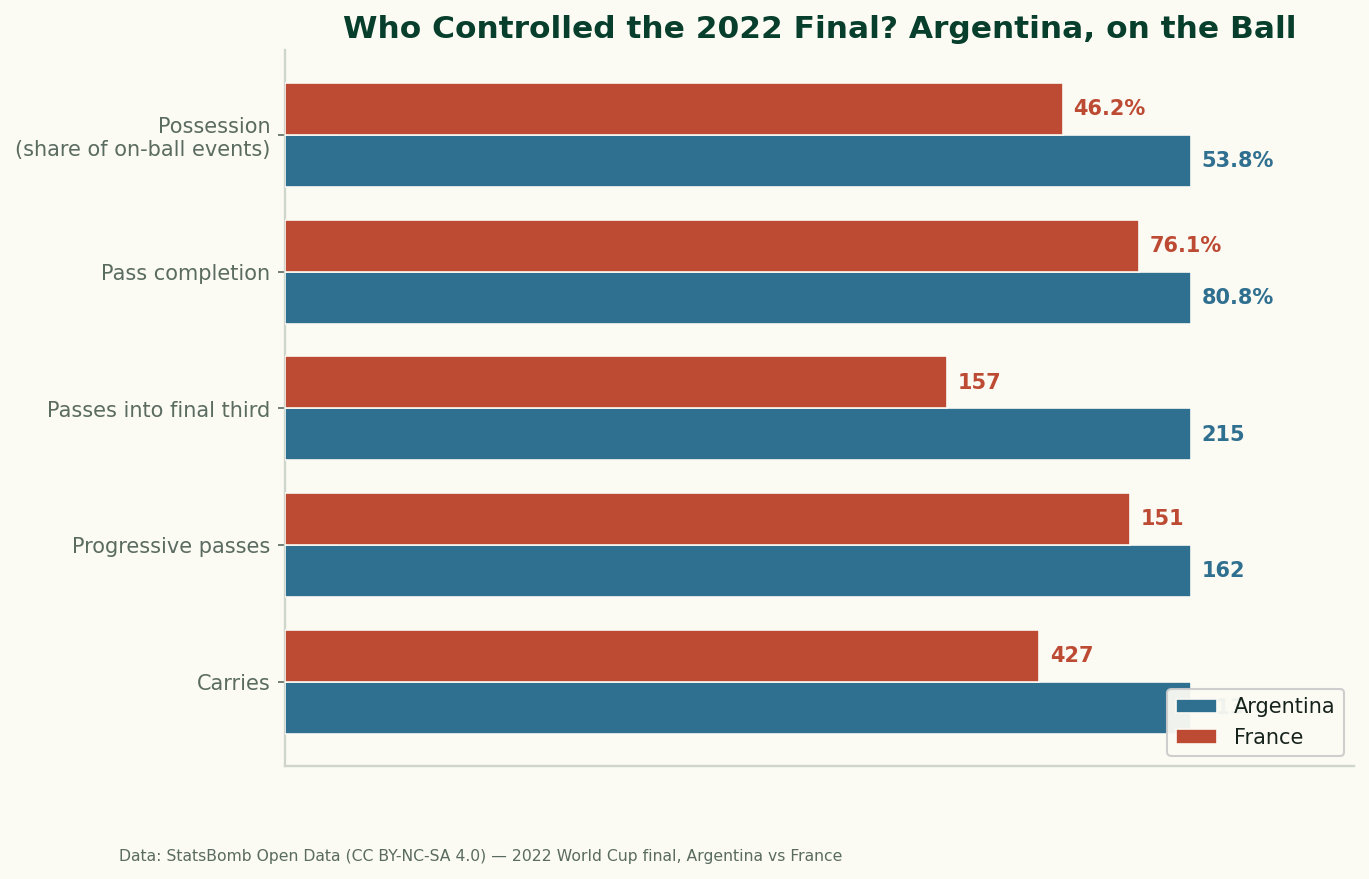
It's a clean sweep. Argentina had 53.8% of the on-ball events to France's 46.2%, completed 80.8% of its passes against France's 76.1%, and pushed the ball into the final third 215 times to France's 157 — nearly 40% more territorial entries. They carried the ball more often (513 to 427) and edged the progressive-pass count too. By every measure of having and moving the ball, this was Argentina's match, and comfortably so.
And yet: 3–3, then penalties
Here is the result all that control produced: a 3–3 draw after extra time, settled 4–2 on penalties in Argentina's favour. France — the team that lost the possession battle, the completion battle, and the territory battle — was about ninety seconds of Kylian Mbappé away from retaining the trophy without ever controlling the ball. That is the single most important thing the scorecard doesn't show, and it's the whole point.
Control of the ball buys you something real: more chances to create, fewer chances conceded, a game played mostly in the opponent's half. What it does not buy you is goals on demand. France spent the night without the ball and then converted a tiny window of chances — a penalty and a thunderbolt — into two goals in the time it takes to tie your boots. Possession is accumulated slowly; goals arrive in discontinuous bursts. The final is the most dramatic illustration imaginable of that mismatch.
Why we overrate possession
Possession statistics feel like they should predict results because controlling the ball is, intuitively, "winning the game" in slow motion. The trouble is that the relationship between possession and goals is weak and noisy, for three reasons the final puts on full display.
First, not all possession is equally dangerous. Argentina's 215 final-third entries are worth something only if they end in good chances; sterile sideways passing in the attacking third runs up the count without troubling the goalkeeper. The link between territory and expected goals is real but loose, which is exactly why xG exists as a separate measurement from possession.
Second, game state distorts everything. Once a team leads, it often cedes the ball deliberately, defends deep, and counterattacks — so possession flows to the team that's behind. Some of Argentina's possession dominance is a consequence of the score, not a cause of it, the same game-state effect that inflates the passing numbers of every chasing team. France sitting off and striking on the break is a feature of how they played, not evidence they were dominated in the way the raw numbers suggest.
Third, finals are tiny samples. One match is ninety-plus minutes of high variance; the better-controlling side wins more often than not across a season, but in any single game a couple of moments swamp ninety minutes of patient build-up. The shootout that decided this one is variance in its purest, most brutal form.
A worked check: control vs. the scoreboard
Put the two stories side by side. On control, Argentina won every category, often decisively — this was, by possession and territory, a one-sided final. On the scoreboard, it was a coin flip resolved by penalties. The gap between those two sentences is the entire argument for why analysts pair possession with shot-quality data instead of trusting either alone. If you'd watched only the passing numbers tick over, you'd have called this a routine Argentine win by the 80th minute. The people who watched the shots and their quality — and the scoreboard — knew it was anything but.
The limits of this exhibit
- Possession here is an event proxy. "Share of on-ball events" approximates possession but isn't the same as time-on-ball; a team that makes many short passes racks up events without necessarily holding the ball longer. The direction (Argentina ahead) is robust, but don't read 53.8% as a stopwatch figure.
- "Progressive" is a defined heuristic. I counted a pass as progressive if it advanced the ball at least 10 metres upfield and ended beyond the halfway line. That's a reasonable, transparent definition, but other models draw the threshold differently and would get slightly different counts.
- One match, and a famously weird one. This is a single game decided in extra time and penalties — about the least representative match you could pick. It's a vivid illustration of "control isn't winning," not proof of a general law. For that you'd pool hundreds of matches and watch the weak possession-to-points correlation emerge.
- Shots and xG are left out on purpose. The match's shot and penalty events (including the shootout) muddy a clean open-play xG figure, so this piece sticks to ball-control metrics. The scoring story lives in the final's xG breakdown.
The takeaway
Argentina controlled the 2022 World Cup final by every measure of having and moving the ball, and that control was real and earned. It just wasn't the same thing as winning, because winning is about goals, and goals don't accumulate the way possession does. The scorecard and the scoreboard told opposite stories that night, and the honest analyst holds both: Argentina ran the game, France nearly stole it, and a shootout — pure variance — had the final word. Control tilts the odds. It never settles them.
Reproduce it
Every number comes from one event file. Filter the events to each team, count passes (complete = no outcome tag), flag those ending in the final third (end_location x ≥ 80 on a 120-long pitch) and those advancing ≥ 10m past midfield, and count carries and total on-ball events. The scorecard is regenerated by charts/chart_wc2022_final_passing.py against the bundled data_layer/wc2022_final_3869685_events.json — no network, nothing hand-entered.
Sources & further reading
- Free textbook: Chapter 11: Possession and Territorial Control — the theory behind this, at DataField.dev.
- Match events: bundled
data_layer/wc2022_final_3869685_events.json— StatsBomb Open Data (CC BY-NC-SA 4.0), 2022 World Cup final. Charted bycharts/chart_wc2022_final_passing.py. - Companion: Anatomy of the 2022 World Cup final (xG) — the scoring story this one deliberately leaves out.
- Background: Game state effects on stats — why the leading team's possession often drops.
- Background: Field tilt and territory explained — measuring where the game is played.
More from Data Deep-Dives
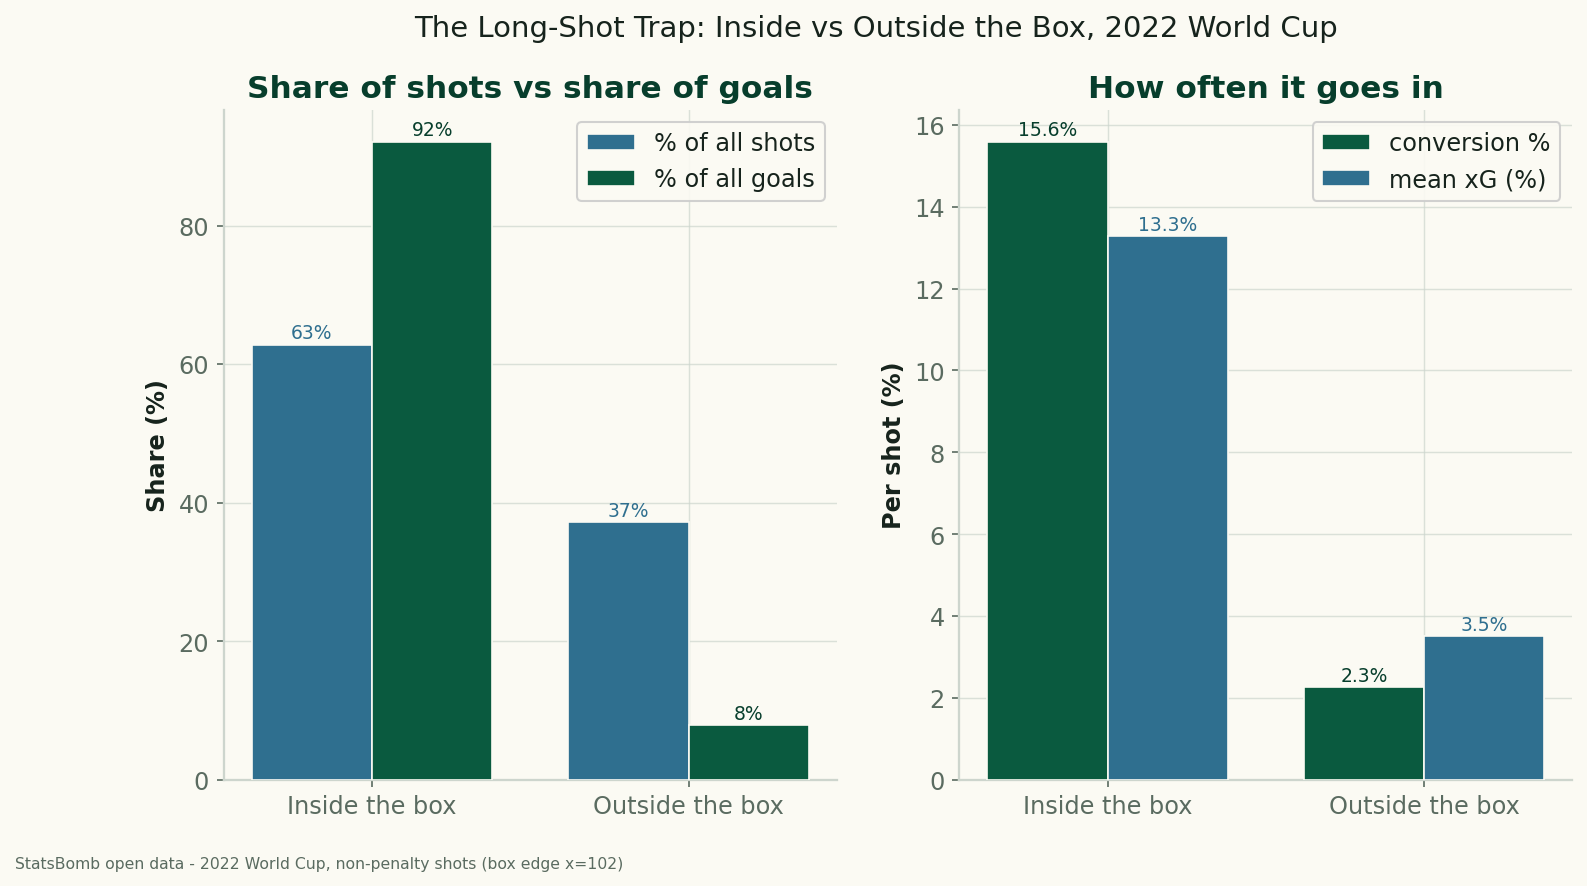
The Long-Shot Trap: Inside vs Outside the Box at the 2022 World Cup
Using StatsBomb data for all 64 matches of the 2022 World Cup, shots from outside the penalty box were 37% of all attempts but produced just 8% of the goals — a 2.3% conversion rate against 15.6% from inside. The data behind 'stop shooting from there.'
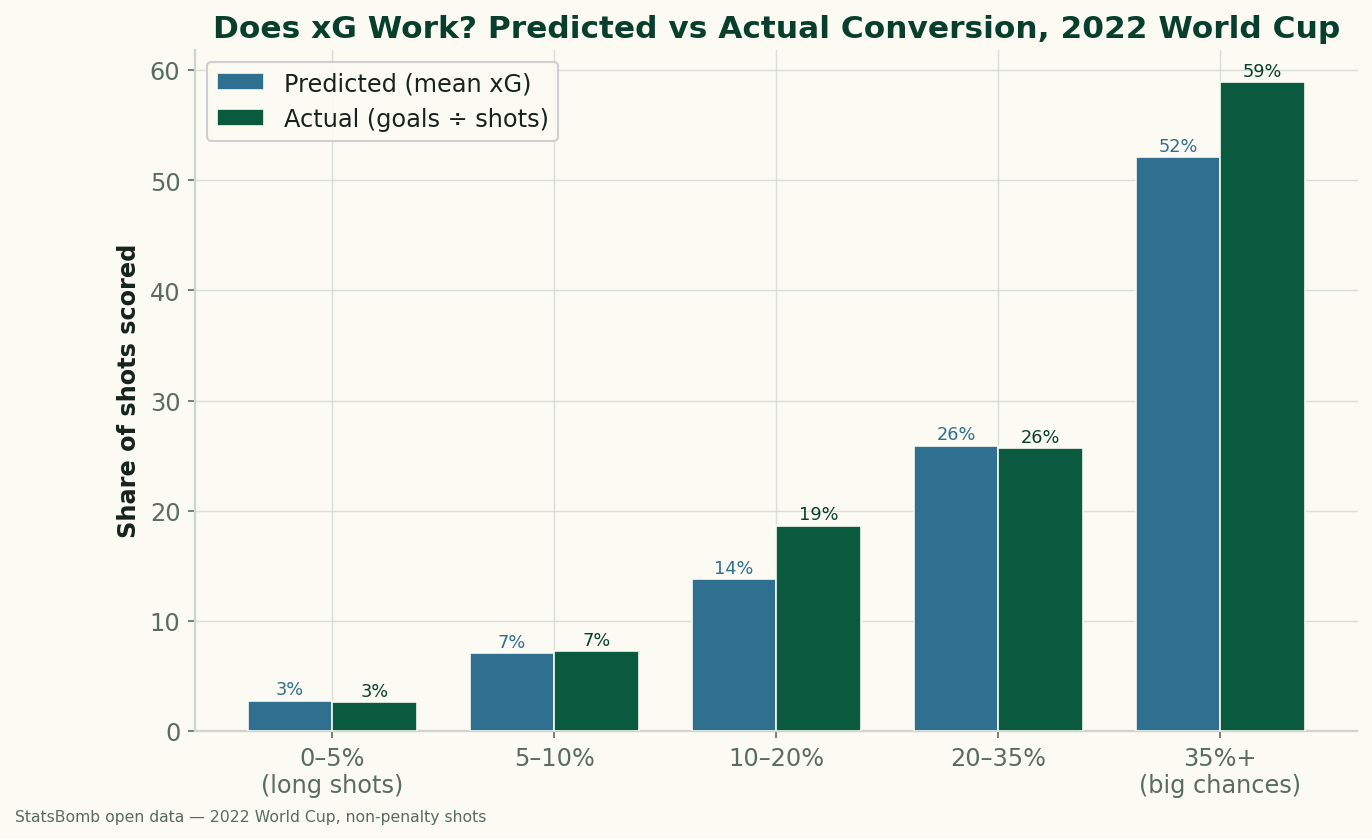
Does xG Actually Work? Big Chances vs Long Shots at the 2022 World Cup
We sorted every non-penalty shot from the 2022 World Cup by its expected-goals value and checked how often each band actually went in. xG holds up well: a 0–5% shot scored 2.6% of the time, a 'big chance' of 35%+ went in 58.9%. The calibration, and what a big chance is really worth.
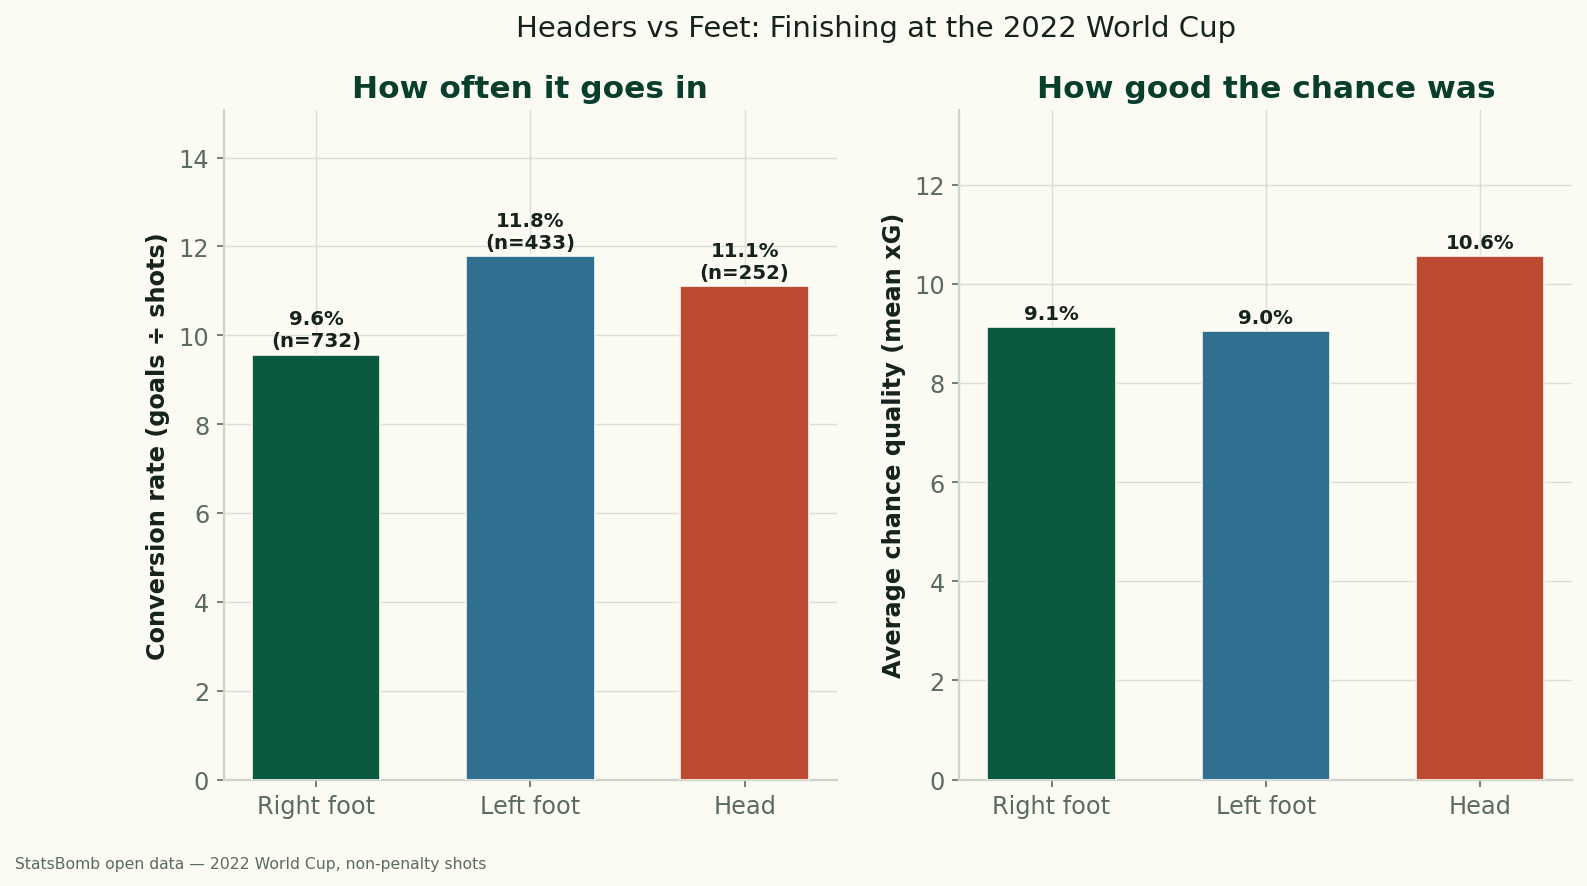
Headers vs. Feet: Which World Cup Shots Actually Go In?
Using StatsBomb data for all 64 matches of the 2022 World Cup, headers and feet convert at almost the same rate (11.1% vs 10.5%) — but only because headers come from higher-quality positions. Relative to chance quality, foot finishing beat the model, and the left foot was the most clinical of all.