PPDA and Pressing Intensity: Reading the Number That Measures How Hard a Team Presses
How one ratio captures the difference between hunting the ball and standing off.
Pressing is the loudest tactical idea in modern football, and for most of the sport's history it was also one of the least measurable. You could see a team swarming the ball, but you could not put a number on how hard they pressed or compare one side's intensity to another's. PPDA — passes per defensive action — is the metric that fixed that. It is a single ratio, easy to compute and easy to misread, and learning to read it well is the fastest route to thinking clearly about the press.
What PPDA is trying to capture
The thing PPDA wants to measure is pressing intensity: how quickly a team disrupts the opponent when the opponent has the ball in their own build-up. A team that presses hard does not let the opposition settle. The goalkeeper rolls it out, the centre-backs try to knock it between themselves, and almost immediately there is a forward in their faces, a midfielder stepping up, a passing lane cut off. A team that presses softly does the opposite: it stands off, holds its shape, and lets the opponent stroke the ball around in front of it until they try to play through.
The challenge is turning that visible difference into a number that travels across matches and competitions. You cannot simply count "pressing actions" because a great deal of pressing is movement that never touches the ball — closing a passing lane, shadowing a man, forcing a player to turn back. What you can count cleanly is two things: how many passes the opponent completed before something interrupted them, and how many interruptions there were. PPDA is the ratio of those two quantities, and its genius is that it sidesteps the un-countable parts of pressing by measuring the footprint they leave on the opponent's passing.
How to compute it
The recipe is deliberately simple. You take the number of passes the opponent completed in their own build-up zone — conventionally the defending team's own 60% of the pitch, roughly from their goal up to a little beyond the halfway line — and you divide it by the number of defensive actions the pressing team made in that same zone.
where defensive actions = tackles + interceptions + challenges + fouls committed
The spatial restriction is the part people forget, and it is what keeps the metric meaningful. You only count events in the opponent's build-up zone — the area where they are trying to play out — and you deliberately ignore the final third nearest their own goal-line, where a defensive action means something completely different. A tackle made forty yards from your own goal as you hunt the ball high is pressing. A last-ditch block in your own six-yard box is not; it is deep defending, and lumping the two together would turn the number to noise. By restricting both the numerator and the denominator to that build-up zone, PPDA isolates the behaviour you actually want to describe.
Worked through on a single sequence: the opponent's keeper passes to a centre-back, who passes to the full-back, who is then closed down and tackled in his own half. That is two opponent passes and one defensive action, contributing 2 to the numerator and 1 to the denominator. Repeat across ninety minutes — sum every qualifying opponent pass, sum every qualifying defensive action — and the ratio of the two totals is the team's PPDA for the match. Aggregate over a season or a tournament and the value stabilises into a fingerprint of how that side likes to defend. For a full event-level walkthrough with code, see our deeper PPDA explainer; this piece is about reading the number once you have it.
What high and low values mean
The direction of the scale is the one thing everyone gets backwards at first, so it is worth stating plainly: lower PPDA means a more intense press. The number is "passes the opponent gets to make before you stop them," so fewer passes — a smaller number — means you intervened sooner, which means you pressed harder.
A PPDA around 6 to 8 signals an aggressive, high-pressing side: they let the opponent string together only six to eight passes in their own territory before forcing a tackle, an interception, or a foul. A PPDA up around 11 to 15 describes a team that sits off, content to let the opposition build slowly and to defend in a mid- or low-block instead of hunting the ball. The values in between shade gradually from one approach to the other; there is no hard threshold, only a spectrum from active pressing at the low end to passive containment at the high end.
Because it is a ratio rather than a raw count, PPDA does not simply reward whichever team had less of the ball. A side can have plenty of possession and still post a low PPDA in the windows when it does not, because the metric only looks at the opponent's build-up phases. That is what lets you compare a possession-dominant pressing side with a counter-attacking one on the same scale.
The limitations
PPDA is useful precisely because it is simple, and it is misleading for exactly the same reason. Four blind spots matter most.
It measures intensity, not effectiveness. A low PPDA tells you a team intervenes early; it says nothing about whether those interventions win the ball in dangerous areas or just concede fouls in harmless ones. Two teams with identical PPDA can be a slick ball-winning machine and a frantic, disorganised one. To judge whether the press works, you have to add something PPDA does not contain — where turnovers happen, how many shots they generate, how much xG follows a recovery.
A disciplined low block looks identical to passivity. A side that deliberately invites the opponent forward, stays compact, and defends superbly in its own half will record a high PPDA, because it is not trying to win the ball in the build-up zone. The high number reflects a tactical choice, not a defensive failing. PPDA cannot tell the difference between a team that cannot press and a team that has decided not to.
It is blind to pressing traps. A team can stand off on purpose, let the opponent play into a pre-set trap, and then spring. During the invitation, PPDA registers a passive value, even though the whole sequence is a sophisticated pressing scheme. The metric sees the passes allowed, not the intent behind allowing them.
Game state contaminates the average. A team chasing a goal late presses desperately; a team protecting a lead drops off. A full-match PPDA blends those very different phases into one figure, which is why a score-split version is far more informative than the single number that circulates on most dashboards. This is the same problem that distorts possession and shot counts — see how game state distorts the stats for the general version.
How to use it well
The honest way to use PPDA is as one layer in a defensive picture rather than a verdict on its own. Read it alongside the PPDA a team allows — how much the opponent gets to press them — and you immediately learn about the balance of pressure in a match. Add the location of turnovers, or field-tilt and territory numbers, and you can tell whether the intensity is also territorial. Add the xG conceded from the counters a high press invites, and you can weigh the reward against the risk.
PPDA is also a good monitoring tool across a season. It is stable enough in aggregate that a sudden move — a side drifting from 7 up to 11 over a handful of games — is a real signal: fatigue, a formation change, a manager's departure, a key presser injured. Treated that way, as a characterisation and a tripwire rather than a scoreboard, the number earns its keep. Where a live, current-tournament PPDA table would sit, we will add one once matches have actually been played.
Sources & further reading
- Free textbook: Chapter 12: Defensive Metrics and Analysis — the theory behind this, at DataField.dev.
- StatsBomb — documentation of event definitions and pressing metrics, including PPDA construction.
- StatsBomb open data — event-level match data you can use to compute PPDA yourself.
- FBref — pressing and defensive-action statistics across major competitions.
- Understat — season-level data for the major European leagues.
More from Stat Explainers
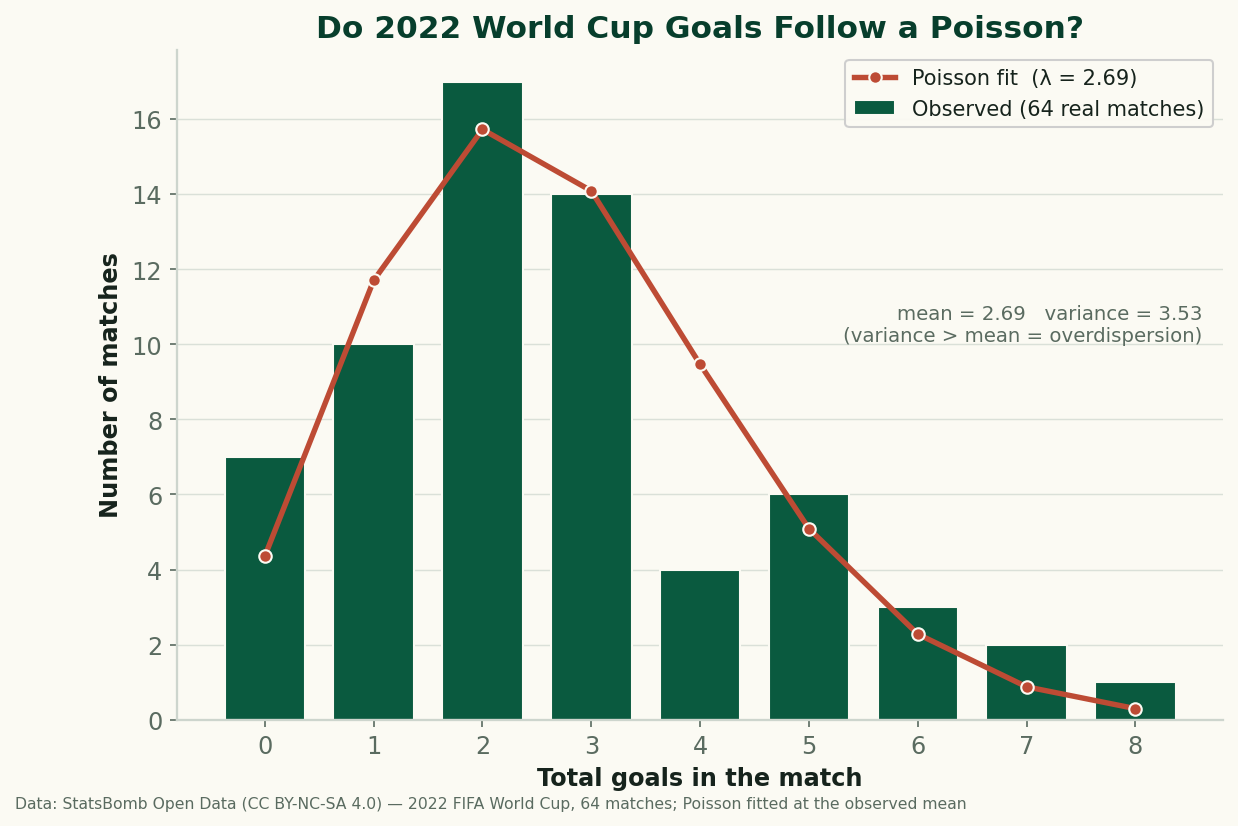
Do Football Goals Follow a Poisson? Testing the Standard Model on All 64 Games of 2022
Every scoreline prediction in football rests on the Poisson distribution. So I fit it to all 64 real matches of the 2022 World Cup and checked the residuals — it gets the shape right and fails in one specific, informative way: real goals are overdispersed. Here's why, with the formula and the code.
Aerial Duels and Heading Data: Reading Win Rate Without Getting Fooled by Volume
Aerial-duel win percentage, why raw counts mislead, where aerial dominance actually matters — set pieces, target men, defending crosses — and how to read heading data without confusing volume for quality.
Expected Points (xPts): Turning Shot-Level xG Into a Fairer Table
Expected points (xPts) simulates a match from its shot-level xG to get win, draw and loss probabilities, then a points total that rewards the chances a team created rather than the goals that happened to go in. How it is computed and what it reveals against the real table.