Field Tilt as Territorial Dominance: Measuring Who Owns the Final Third
Possession asks who has the ball; field tilt asks whose final third the game lives in.
Possession is the most quoted number in football and, fairly often, the most misleading. A side can finish with 65% of the ball and have been pinned in its own half for most of the afternoon; another can see barely a third of it and spend the whole game living on the edge of the opponent's box. The possession figure crowns the first team and shrugs at the second, and on those nights it is simply wrong about who controlled anything that mattered. Field tilt is the metric I reach for to settle that argument — it ignores where the ball mostly sits and measures only the share of the game each team plays in the final third, the part of the pitch where matches are actually decided. (For the foundational walkthrough of what field tilt is, start with field tilt and territory explained; this piece focuses on how it is measured, how it diverges from possession, and what it predicts.)
How field tilt is measured
Field tilt turns territorial dominance into a single percentage by counting only the action that happens where it counts: the final third. The standard recipe restricts attention to attacking-third touches or passes and asks what share of them belonged to each team.
Most implementations use final-third passes or touches; some use a slightly tighter zone. The principle is identical: a share of the action in the dangerous third.
The key move is the spatial filter. Ordinary possession counts every touch anywhere on the pitch — a centre-back rolling the ball sideways in his own half weighs exactly as much as a winger working it on the edge of the box. Field tilt throws away everything outside the final third and keeps only the touches in the zone where chances are created. A side that knocks the ball around its own back four runs up its possession number but contributes nothing to its field tilt, because none of those touches happen in the third that the metric cares about. The result is a 0–100% figure (the two teams' shares sum to 100) that answers a sharper question than possession: of all the meaningful, final-third action in this match, what fraction did each team own?
Some analysts compute it from passes rather than touches, some weight by danger, and there are refinements that approach the same idea from the angle of expected threat — valuing where the ball is rather than merely counting touches there. But the simple touch-share version captures most of the signal, and honestly its plainness is the point: it is easy to compute from public event data and hard to fudge. I'd rather have a blunt number I can trust than a clever one I have to take on faith.
Why it differs from possession percentage
Possession and field tilt agree often enough that people assume they are interchangeable, and then diverge in exactly the matches where the difference is most revealing. The divergence has a few characteristic shapes.
Sterile possession. A team passes patiently in front of a deep block, accumulating 65% possession, but can never get the ball into the final third in a meaningful way. Possession says dominance; field tilt says something much closer to even, because the defending side is conceding the ball but not the territory. This is the single most common case where possession lies, and field tilt is the corrective — the same gap we flag when we warn that a possession figure read without context can tell you the opposite of who controlled the game.
Effective low possession. The mirror image: a counter-attacking or direct side has less of the ball overall but, when it does have it, plays it straight into the final third — long balls, quick transitions, sustained spells of pressure near the opponent's box. Its possession number is modest, but its field tilt can be high, because it spends its time on the ball in the zone that matters. Possession undersells these teams; field tilt rescues them.
Where the ball is held. The deepest reason the two differ is that possession is location-blind and field tilt is location-obsessed. Possession answers "who has the ball"; field tilt answers "whose final third the ball is in." A team can win the first comfortably and lose the second, or vice versa, and the cases where they split are precisely the matches where the bare possession number misleads a casual reader.
What it predicts
A metric earns its place by predicting something the simpler number does not, and field tilt's claim is that territory tracks chance creation more faithfully than possession does. The intuition is direct: chances come from the final third, so a measure built only from final-third action should correlate more tightly with shots and expected goals than a measure that counts every harmless touch anywhere on the pitch. Empirically, that is broadly what analysts find — field tilt lines up with shot and xG dominance more reliably than raw possession, because it has already discarded the back-four passing that inflates possession without producing threat.
That makes field tilt useful for the same kind of question as expected goals but at the territorial level: not "who finished their chances" but "who spent the match in position to create them." A side that consistently out-tilts opponents is repeatedly establishing itself in the dangerous third, which is the precondition for chances even when the finishing, on a given day, does not follow. As a descriptor of control it is sturdier than possession and more legible than a full possession-value model, which is why it has become a staple of match dashboards.
Two cautions keep it honest. First, like possession and shot volume, field tilt is bent by the scoreline: a team protecting a lead concedes territory deliberately, so a side that goes ahead early can post a low full-match tilt and still have been the better team — the same game-state distortion that contaminates almost every aggregate, and the same reason a while-level split is more honest than the full-time figure. Second, territory is not the same as quality: a team can dominate the final third with low-value, around-the-edges possession that never threatens the goal, which is exactly where danger-weighted measures like expected threat pick up what plain field tilt misses. Field tilt tells you whose game it was territorially; it does not, on its own, tell you whether that territory was turned into real chances.
How to use it well
Read field tilt next to possession, not instead of it, and the gap between the two becomes the insight. When they agree, the story is simple and you can trust the possession headline. When they diverge, field tilt is almost always the more honest read of who controlled the dangerous areas — sterile possession exposed as territory-neutral, or an underdog's modest possession revealed as genuinely threatening. Pair it with shots and xG to confirm that territory turned into chances, split it by game state so a defended lead does not masquerade as passivity, and treat a sustained tilt edge across many matches as a real signal of a side that habitually pushes the game into the opponent's half. Used that way, field tilt is the antidote to the oldest false friend on the box score: the possession percentage that looks like control and sometimes means its opposite.
Sources & further reading
- Free textbook: Chapter 11: Possession and Territorial Control — the theory behind this, at DataField.dev.
- StatsBomb — documentation of event definitions and territorial / possession-value metrics.
- StatsBomb open data — event-level data you can use to compute field tilt yourself from final-third touches.
- FBref — possession, touch-location, and final-third statistics across competitions.
- Understat — season-level xG data for checking how territory lines up with chance creation.
More from Stat Explainers
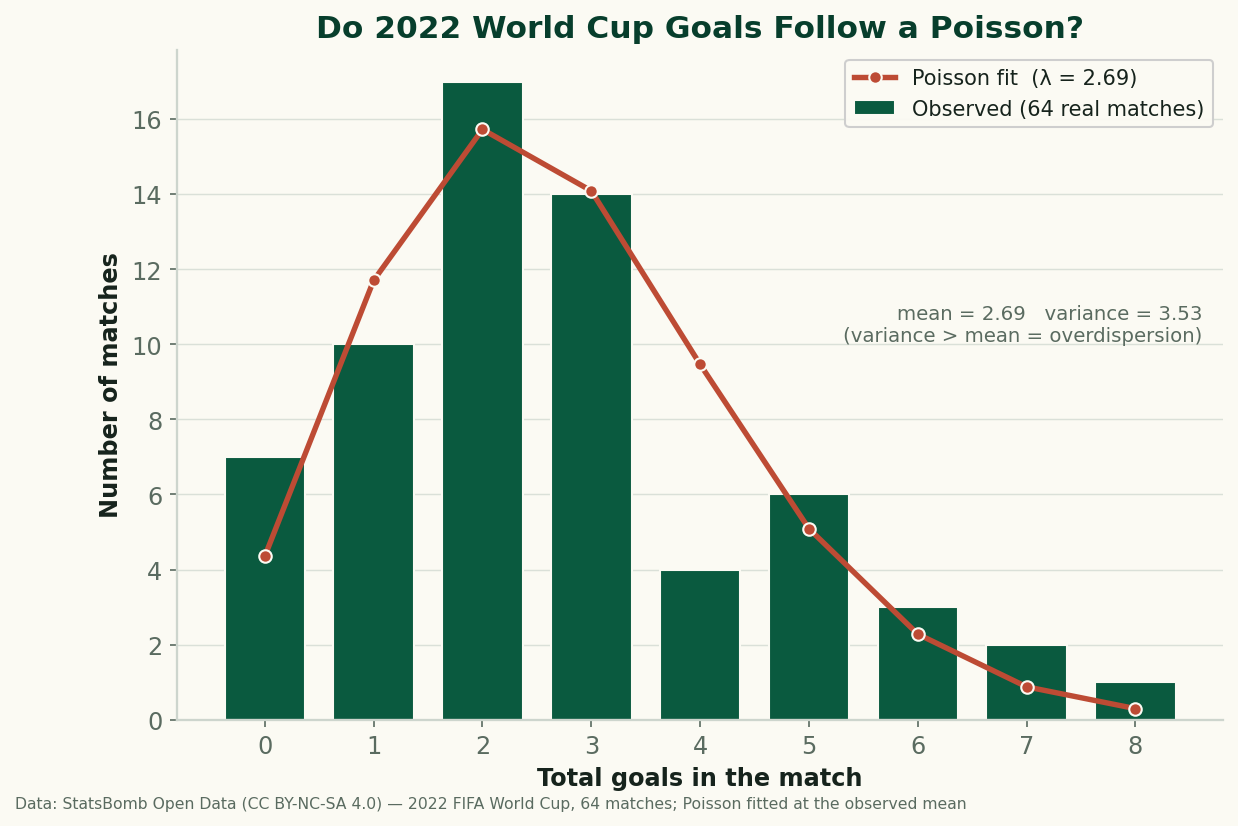
Do Football Goals Follow a Poisson? Testing the Standard Model on All 64 Games of 2022
Every scoreline prediction in football rests on the Poisson distribution. So I fit it to all 64 real matches of the 2022 World Cup and checked the residuals — it gets the shape right and fails in one specific, informative way: real goals are overdispersed. Here's why, with the formula and the code.
Aerial Duels and Heading Data: Reading Win Rate Without Getting Fooled by Volume
Aerial-duel win percentage, why raw counts mislead, where aerial dominance actually matters — set pieces, target men, defending crosses — and how to read heading data without confusing volume for quality.
Expected Points (xPts): Turning Shot-Level xG Into a Fairer Table
Expected points (xPts) simulates a match from its shot-level xG to get win, draw and loss probabilities, then a points total that rewards the chances a team created rather than the goals that happened to go in. How it is computed and what it reveals against the real table.