The Overrated Cross: Why the Data Is Suspicious of Getting It Wide
Most crosses go nowhere. Here is when the ball wide is worth it.
Few instructions in football feel as natural as “get it wide and put it in the box.” It looks like attacking: bodies in the area, a ball whipped in, a striker rising to meet it. Yet when the analytics movement first started counting what actually happens to crosses, it found one of the sport’s most durable inefficiencies. The average cross is a low-percentage play, and a lot of the territory teams work so hard to reach is worth less than it looks.
What the data found
The headline result is by now well established and has been replicated across leagues and seasons: most crosses do not find a teammate at all. The completion rate for open-play crosses is low — commonly cited in the rough region of one in five reaching an attacker, though the exact figure drifts with how strictly you define a “completed” cross and which deliveries you include. The point survives the imprecision: the great majority of crosses are cleared, cut out, or sail through to the goalkeeper.
Worse for the case, the crosses that are met tend to produce poor shots. A header met on the move, from a ball arriving across the body at pace, from an angle, with a defender and goalkeeper contesting it, is one of the lower-value finishes in the game. Plug that situation into an expected-goals model — which weighs distance, angle, body part and the crowd around the shooter — and the resulting chance usually carries modest xG. So crossing loses on both counts: a low chance of connecting, and a low-value shot when you do.
Treat those as well-known ranges, not constants — the figures move by league, by data provider, and by how you count. But the shape of the answer is not seriously disputed: averaged over all of them, the high cross from open play is an inefficient way to manufacture a goal.
An illustrative comparison
A made-up but representative contrast shows why analysts flinch at high crossing volume. The numbers below are round and illustrative, chosen to show the logic rather than describe any real team.
| Attacking route | Chance of a shot | xG if a shot results |
|---|---|---|
| High cross into a crowded box | low | ~0.05 |
| Cut-back from the byline | higher | ~0.15 |
The high cross asks a teammate to win an aerial duel and then beat a set goalkeeper with a header — two hard things in sequence. The cut-back asks a teammate to side-foot a ball rolling across the six-yard area, often into a goal the keeper has been dragged away from. Even granting generous round numbers, the second route is plainly the better bet. That gap, repeated thousands of times a season, is the whole argument.
So why does “get it wide and cross it” persist?
If crossing is so inefficient, its stubborn popularity needs explaining, and there are honest reasons for it. The first is that the wide areas are simply easier to reach. Defences protect the centre of the pitch most fiercely; the touchline is where space is conceded, so possession naturally drifts wide, and once the ball is there a cross is the most available next action. Working a clean central chance is more valuable but also much harder to engineer against a compact block.
The second is salience. A cross that does produce a thumping header is vivid and memorable; the four that were cleared without incident are forgotten. Coaches, crowds and commentators remember the goal, not the denominator. The third is that a cross is a low-risk turnover: a ball lofted into the box rarely leads to a dangerous counter the way a lost ball in central midfield can, so a cautious side may cross precisely because it is a tidy way to end a possession. None of this makes the average cross efficient — it makes it convenient, safe, and easy to remember, which is not the same thing.
When crossing actually makes sense
The analytics case is against the indiscriminate high cross, not against putting the ball into the box full stop. Several situations turn crossing from a poor option into a good one, and they are worth naming precisely because the blanket stat hides them.
- Cut-backs and low balls from the byline. This is the big one. A pass pulled back from the goal line to a runner arriving at the penalty spot is one of the most valuable patterns in the game — the shooter is square to goal, the keeper is often out of position, and the chance is taken with the feet. A cut-back is technically a cross, but it has almost nothing in common with a hopeful ball from deep.
- Low, driven crosses over floated ones. A hard ball across the face of goal is harder to defend and can be turned in first-time, whereas a high, hanging cross gives defenders and the keeper time to set and attack it. The trajectory matters as much as the delivery point.
- A genuinely packed box, or a mismatch. If you have numbers and aerial dominance in the area — multiple tall arrivals against a stretched defence — the odds on a high cross improve, because you are no longer asking one striker to beat the whole back line alone.
- Set-piece deliveries. A dead ball is a different proposition. The delivery is unopposed, attackers can be choreographed onto it, and the value of a good set-piece ball is well understood — see set-piece xG for why a corner or wide free-kick is not the same bet as an open-play cross at all.
How to read crossing numbers
The practical lesson is to never read crossing volume on its own. A high crosses-attempted figure tells you a team’s style, not its effectiveness — it can mean a side is creating overloads and cut-backs, or it can mean a side is reaching the byline and then giving up on the move with a low-percentage ball. The three numbers only mean something together: volume (how often they cross), completion (how often it finds a teammate), and the xG that results (whether the chances are any good). A team can cross a lot, complete a respectable share, and still generate almost nothing if every connection is a difficult header from a poor angle.
The better diagnostic is to separate cut-backs and low deliveries from floated high crosses, and to look at the xG per cross rather than the raw count. A side whose crosses come from the byline and arrive low can run a perfectly efficient attack; a side that floats the ball in from deep, again and again, is usually leaving xG on the table no matter how busy the volume column looks. The cross is not banned by the data — it is just asked to justify itself.
Sources & further reading
- Free textbook: Chapter 9: Expected Threat (xT) and Ball Progression — the theory behind this, at DataField.dev.
- StatsBomb — research on crossing, cut-backs, and the value of different delivery types.
- The Analyst — explainers on shot quality and chance creation from wide areas.
- FBref — crossing volume, completion and shot-creation data across competitions.
- Understat — shot-level xG you can use to weigh the quality of chances from crosses.
More from Data Deep-Dives
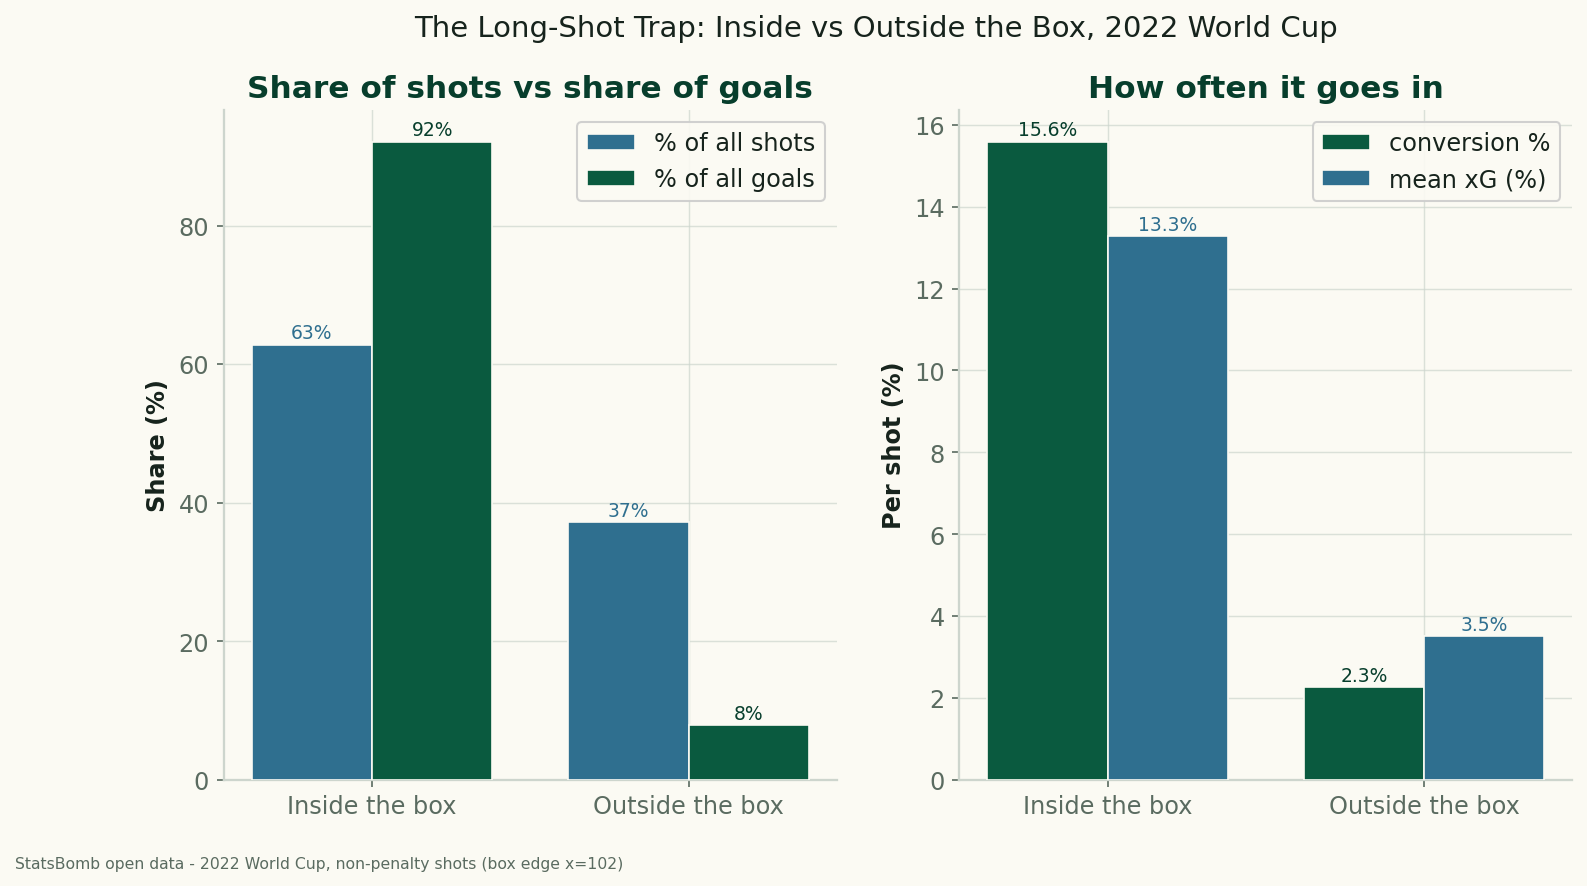
The Long-Shot Trap: Inside vs Outside the Box at the 2022 World Cup
Using StatsBomb data for all 64 matches of the 2022 World Cup, shots from outside the penalty box were 37% of all attempts but produced just 8% of the goals — a 2.3% conversion rate against 15.6% from inside. The data behind 'stop shooting from there.'
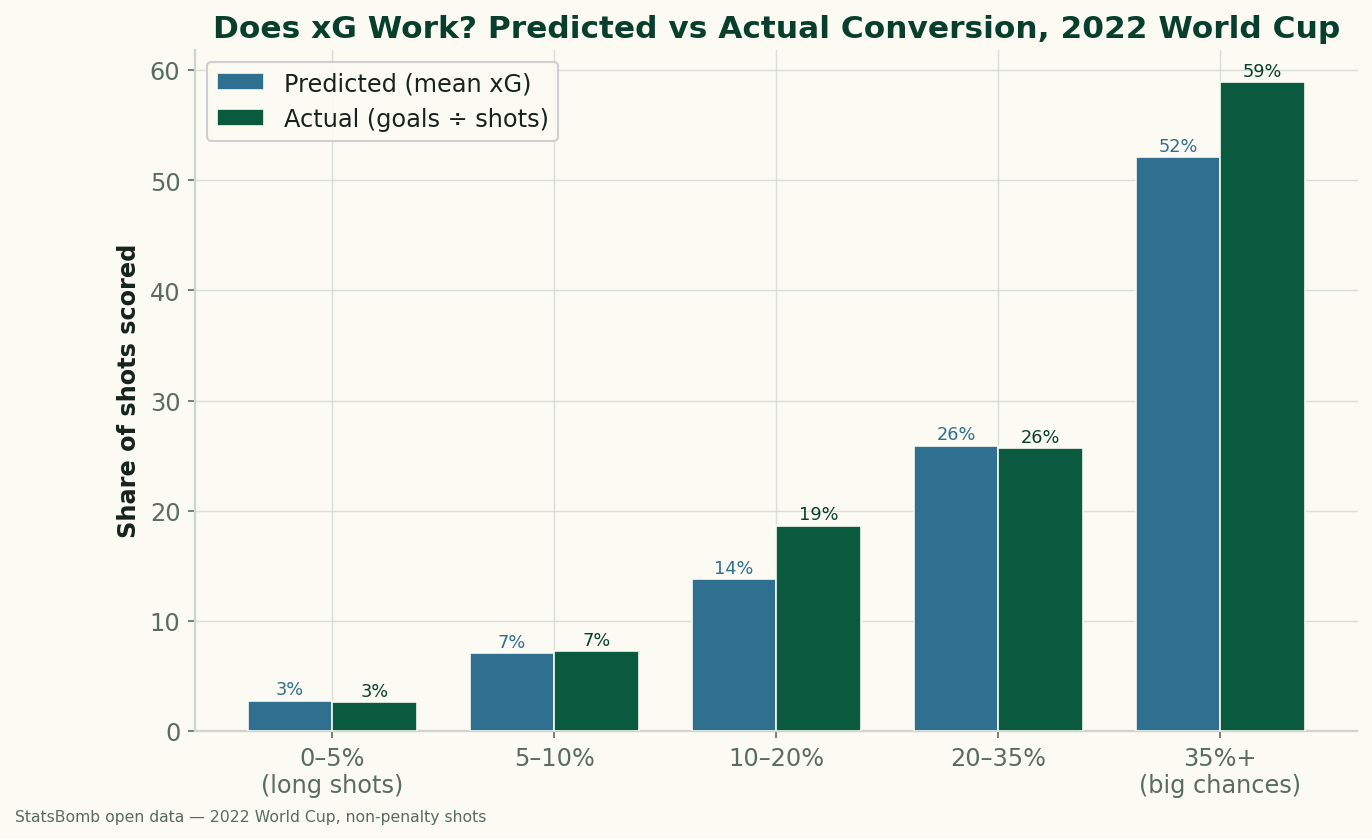
Does xG Actually Work? Big Chances vs Long Shots at the 2022 World Cup
We sorted every non-penalty shot from the 2022 World Cup by its expected-goals value and checked how often each band actually went in. xG holds up well: a 0–5% shot scored 2.6% of the time, a 'big chance' of 35%+ went in 58.9%. The calibration, and what a big chance is really worth.
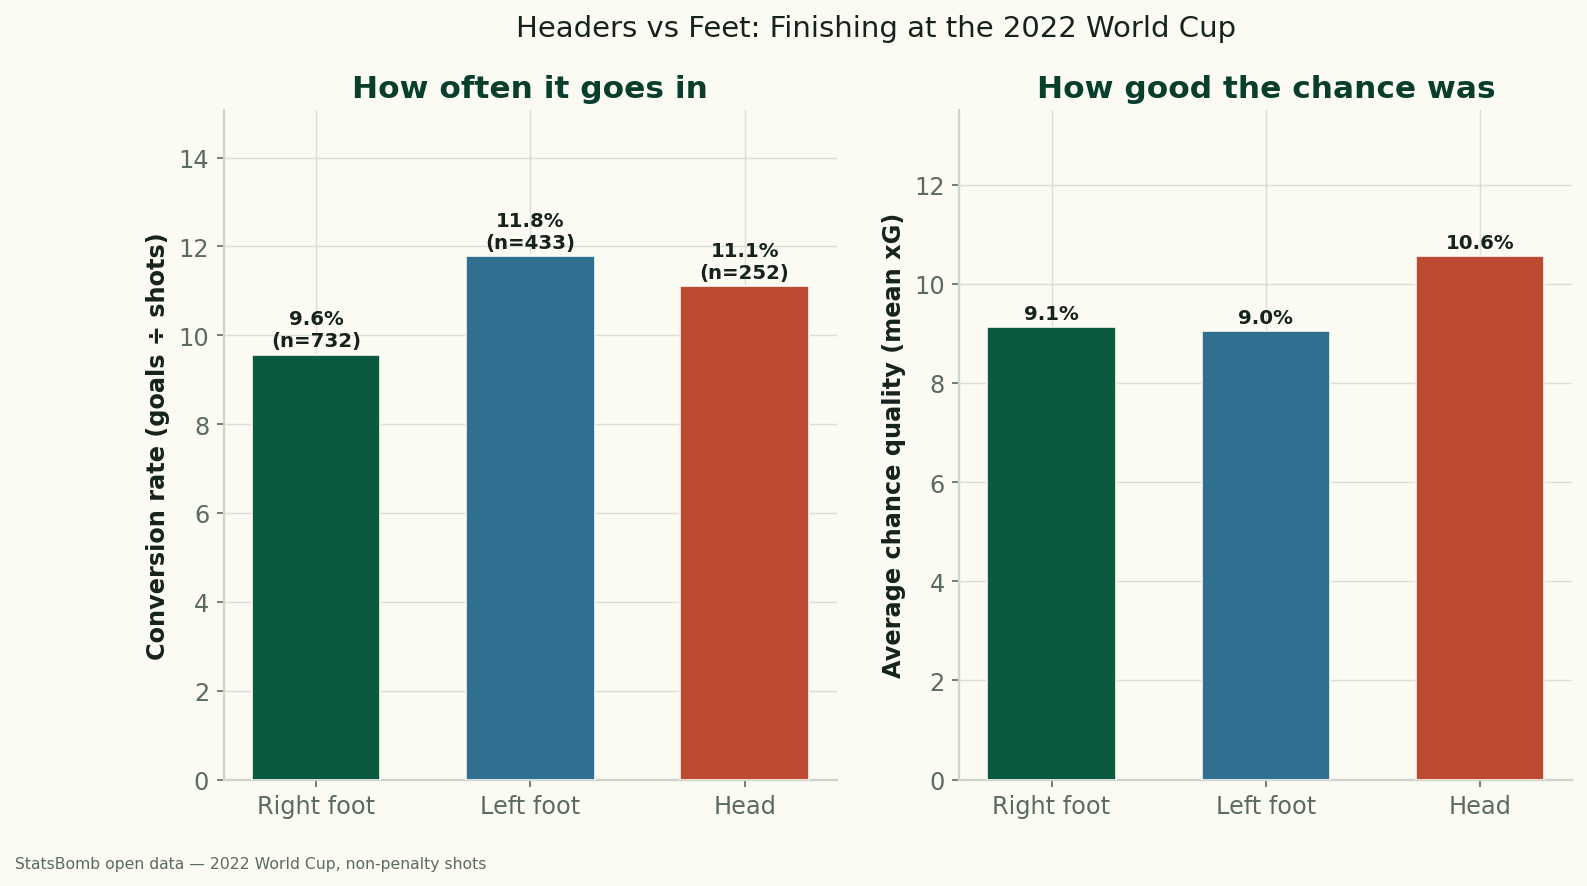
Headers vs. Feet: Which World Cup Shots Actually Go In?
Using StatsBomb data for all 64 matches of the 2022 World Cup, headers and feet convert at almost the same rate (11.1% vs 10.5%) — but only because headers come from higher-quality positions. Relative to chance quality, foot finishing beat the model, and the left foot was the most clinical of all.