The Round After an International Break Has Fewer Upsets, Not More
The Premier League returns from the first of FIFA's 16-day autumn windows. Twenty-three seasons of restart rounds say a break does not scramble results. It hands the favourite a little more, for one match.
The Premier League comes back on Saturday, 20 days after its last round of matches: the longest of the 80 international breaks since August 2002. The round after a break has a reputation: tired internationals, interrupted runs, results nobody saw coming. The results say the opposite. In 767 first matches after an international break from 2003-04 to 2025-26, the favourite won 56.2% of the time, against the 52.2% that the same rating gaps produced in every other match. Draws came as often as expected. The difference came out of the upsets: underdogs won 145 times where the expectation was 174.5, so about one upset in six never happened. Per match, the favourite took 1.935 points against 1.817 expected, an edge of +0.118. It lasts one match. In the last match before a break and in the second match after it, favourites did what their ratings said they would.
Sourcing. Every completed Premier League match on ESPN's public scoreboard from 2002-03 to 20 September 2026: 9,170 matches, 24 full seasons of 380 and the 50 played so far this season, plus the ten fixtures of 10 to 12 October. A separate pull of the same feed on 5 October agrees with this one on all 9,527 rows ESPN returns, including the 357 duplicate rows it lists for 2009-10, which we drop by the same rule as our one-goal-lead study. To tell an international break from any other pause, ESPN's national-team scoreboards (friendlies, UEFA's World Cup and European Championship qualifiers, and the Nations League) supply 6,710 matches from the months around each pause, and its FA Cup scoreboard the 1,472 cup ties of the same months. The pull is data_layer/build_epl_breaks.py, which wrote the dated file data_layer/epl_breaks_2002_2027_2026-10-09.json, served here at that path, and every figure below is recomputed by charts/chart_epl_international_break.py, which exits non-zero if any of them stops reproducing.
Which pauses count
A pause, here, is any gap of 11 days or more between two Premier League match days in the same season. Since 2002-03 there have been 92, and the national-team scoreboards sort them cleanly. Every one of the 79 international breaks has at least 21 matches from those scoreboards inside it. None of the 11 domestic pauses has more than seven. Ten of those are FA Cup weekends, with cup ties for between 6 and all 20 of the league's clubs, and the eleventh is the September 2022 weekend the league postponed as a mark of respect after the death of Queen Elizabeth II, which had neither. The last two are stoppages of another kind, the 100-day suspension of 2020 and the 43 days of the 2022 World Cup, and they stay out of every comparison below. Sixty-five of the 79 breaks lasted 13 days from one league match day to the next and eleven lasted 12. The longest before this one, 19 days, ran from 22 March to 10 April this year.
The first match after a break is a league match played within six days of the restart, between two clubs whose previous league match came before the pause. The 77 breaks from 2003-04 to 2025-26 produced 767 of them.
How a result is judged
Every club carries an Elo rating built from results alone: a win counts 1, a draw a half. All 20 clubs of 2002-03 start at 1,500, and that season only warms the ratings up; nothing from it is analysed. The home side gets 60 points of advantage. Each result moves both ratings by 20 times the difference between what happened and what the ratings expected. Each summer the promoted clubs take the average rating of the clubs they replace, and then every rating moves a fifth of the way back to 1,500. Our guide to Elo and other power ratings explains why a system like this works and where it does not.
The yardstick is what the same rating gap produced in every match that was not the first after a pause: 7,907 matches from 2003-04 on. The gap is the home rating plus 60 minus the away rating, grouped in 50-point bands, and each band's shares of home wins, draws and away wins become the expectation. The favourite is the home side when the gap is zero or more and the away side when it is negative. The full table is at the end. By construction, those 7,907 matches come out at zero.
One match shows the arithmetic. On 11 April 2026, in the first round after the March break, Liverpool, rated 1,572.1, were at home to Fulham, rated 1,491.5. The gap was 1,572.1 + 60 − 1,491.5 = 140.6, in the 100-to-150 band. In the 1,047 other matches with a gap in that band, the home side won 540, drew 291 and lost 216, so Liverpool's expectation was (3 × 540 + 291) ÷ 1,047 = 1.825 points. They won 2-0: three points, 1.175 more than expected. Across that whole round the ten favourites took 20 points against 18.118 expected, even with Arsenal losing 2-1 at home to Bournemouth and Manchester United losing 2-1 at home to Leeds.
Fewer upsets, not more
The chart's left panel is the finding. Against what the same rating gaps produced everywhere else, the first match after an international break moved about 30 results from the underdog's column to the favourite's and left the draws alone.
| Result | Expected | Happened |
|---|---|---|
| Favourite won | 400.7 (52.2%) | 431 (56.2%) |
| Draw | 191.8 (25.0%) | 191 (24.9%) |
| Underdog won | 174.5 (22.8%) | 145 (18.9%) |
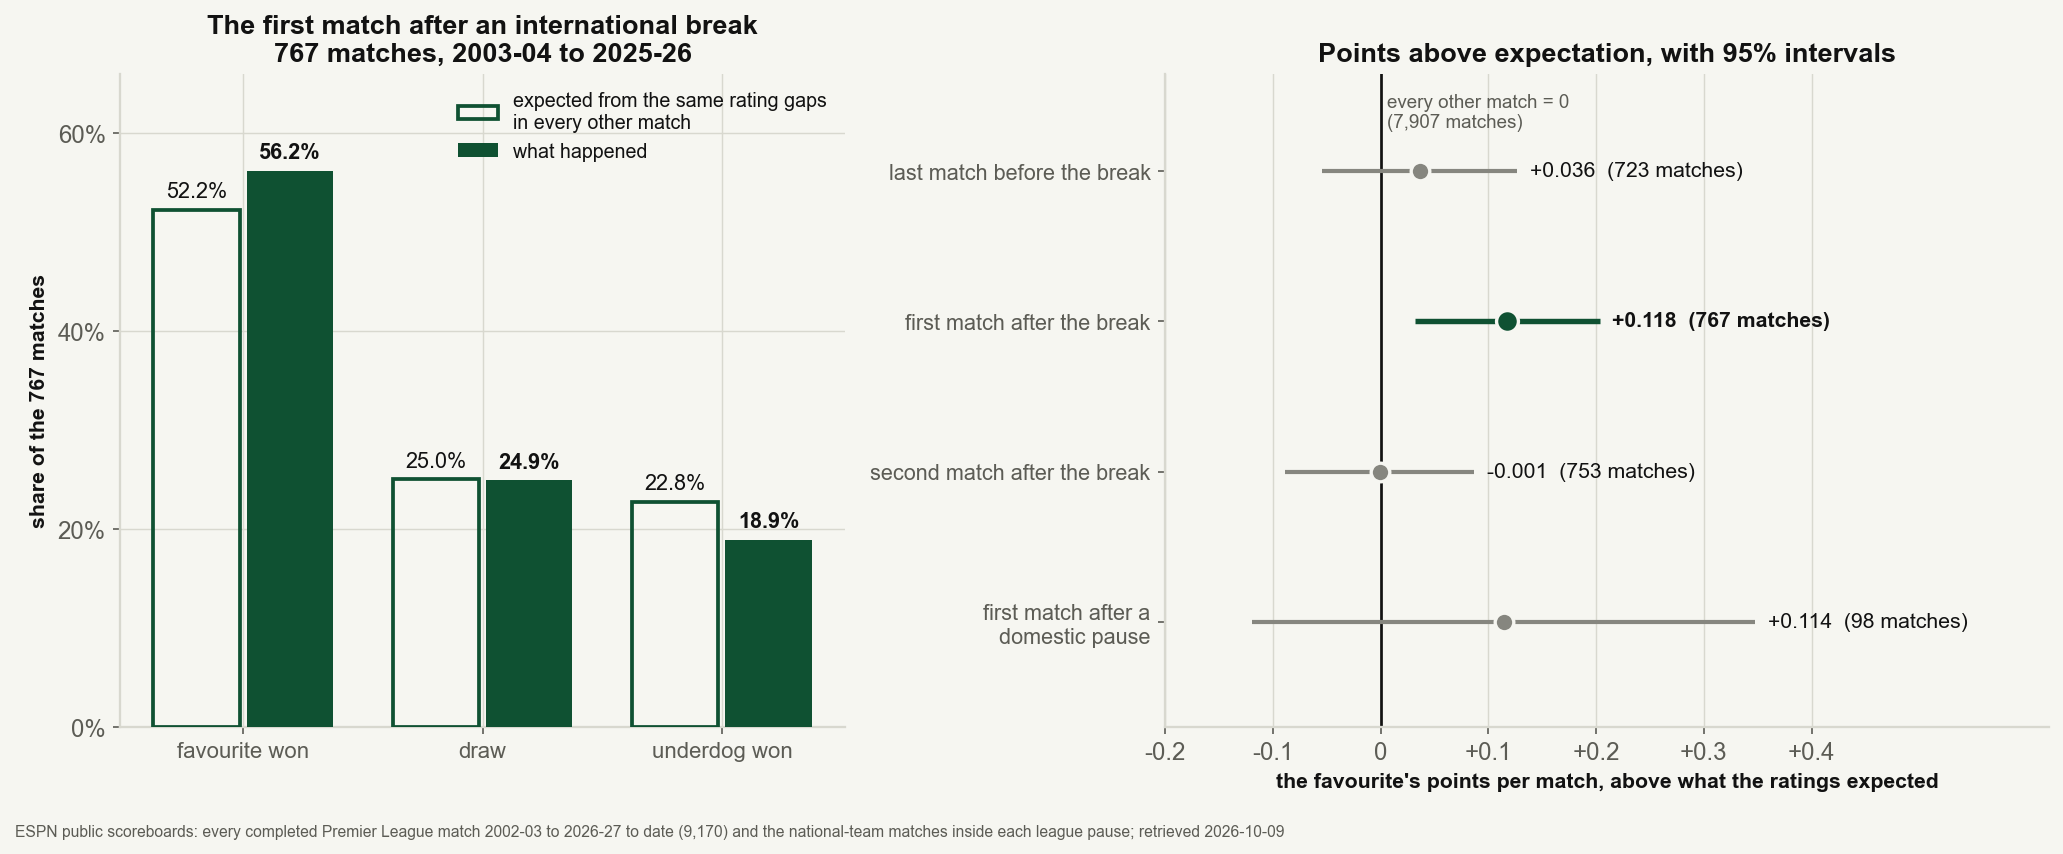
An edge of 0.118 points a match is small next to the noise in any single result, so it needs checking more than one way. The ordinary 95% interval runs from +0.032 to +0.203. Resampling whole breaks rather than single matches, so that a weekend's results move together, gives +0.043 to +0.191, and 10 of 10,000 resamples land at zero or below. Drawing 77 ordinary weekend rounds at random, from the 641 with eight or more matches, produces an average this high 26 times in 10,000. Fifteen of the 23 seasons and 53 of the 77 breaks come out above zero.
It lasts one match
The right panel puts the first match after the break beside its neighbours. In the last match before a break, favourites came out at +0.036, inside the noise. In the second match after it, −0.001. Whatever a break does, it does in the first match back, and a week later it is gone.
The usual worry runs through the players: internationals coming home tired or hurt. If that cost the favourites more than their opponents, the number would point the other way. The domestic pauses hint that national-team duty is not what drives it, without settling anything. They held at most seven national-team matches each, yet the 98 first matches after them came out at +0.114, the same size as after an international break. But 98 matches leave an interval of ±0.23 around it, too wide to confirm anything, and an FA Cup weekend is no rest for the clubs still in the cup. The two long stoppages restarted with 18 matches in which favourites took 2.111 points a match against 1.808 expected. Eighteen matches prove nothing either, but nothing in them suggests that time away hurts the stronger side.
Not one era, not one kind of favourite
Split the 767 matches by month, by era, by venue or by the size of the gap, and in all 13 rows the first match after a break comes out ahead of every other match of the same kind. Each row on its own is small, with standard errors of 0.05 to 0.10, so no single row proves much. Together they say the edge does not belong to one decade or one kind of match.
| Group | First matches after a break | Points vs expected | Every other match |
|---|---|---|---|
| August and September | 210 | +0.051 | -0.012 |
| October | 220 | +0.200 | +0.061 |
| November | 169 | +0.050 | -0.071 |
| March and April | 160 | +0.189 | +0.027 |
| 2003-04 to 2008-09 | 169 | +0.190 | +0.018 |
| 2009-10 to 2014-15 | 190 | +0.102 | +0.004 |
| 2015-16 to 2020-21 | 220 | +0.067 | -0.011 |
| 2021-22 to 2025-26 | 188 | +0.128 | -0.013 |
| Favourite at home | 525 | +0.093 | 0.000 |
| Favourite away | 242 | +0.171 | 0.000 |
| Gap under 100 points | 406 | +0.089 | 0.000 |
| Gap 100 to 200 | 254 | +0.196 | 0.000 |
| Gap 200 or more | 107 | +0.041 | 0.000 |
Changing the rating system does not change the answer. With K at 15 or 25, home advantage at 40 or 80, a third of each rating pulled back each summer, bigger wins moving the ratings more, or bands of 25 or 100 points, the edge stays between +0.098 and +0.136. Measured against Elo's own expected score instead of the band table, favourites beat it by 0.042 of a result after a break and by 0.005 everywhere else.
There is no run to break
The other half of the reputation is momentum: a side on a good run, the saying goes, would rather keep playing. Take every club whose last three league results beat its ratings by two points or more. In an ordinary week its next match came out at −0.004 points against expectation (2,591 cases). Straight after a break it came out at +0.001 (282). Clubs two or more points below expectation over three games came out at +0.019 in an ordinary week and +0.068 after a break, both inside their noise. A three-match run carries nothing into the next match either way, so a break has nothing to interrupt. The same lack of memory runs through finishing and saving rates.
This weekend
This break is the first of the longer autumn windows in FIFA's 2025-2030 calendar, which replaces separate September and October windows with “a 16-day, four-match window” from 2026. England used all four matches: Nations League games on 26 and 29 September and on 3 and 6 October. On the four ESPN national-team scoreboards used here, 181 matches fall between the league's last round on 20 September and its return on 10 October: 104 in the Nations League and 77 friendlies. It also means one autumn restart round instead of two.
| Date | Match | Gap | Favourite | Expected points |
|---|---|---|---|---|
| 10 Oct | Arsenal v Leeds United | +234.4 | Arsenal | 2.332 |
| 10 Oct | Aston Villa v Brentford | +65.7 | Aston Villa | 1.693 |
| 10 Oct | Chelsea v AFC Bournemouth | +47.7 | Chelsea | 1.467 |
| 10 Oct | Ipswich Town v Fulham | -1.0 | Fulham | 1.473 |
| 10 Oct | Sunderland v Brighton & Hove Albion | -14.6 | Brighton & Hove Albion | 1.473 |
| 10 Oct | Manchester United v Tottenham Hotspur | +188.7 | Manchester United | 2.110 |
| 11 Oct | Crystal Palace v Nottingham Forest | +48.2 | Crystal Palace | 1.467 |
| 11 Oct | Hull City v Everton | -18.5 | Everton | 1.473 |
| 11 Oct | Liverpool v Manchester City | -26.3 | Manchester City | 1.473 |
| 12 Oct | Coventry City v Newcastle United | -54.3 | Newcastle United | 1.654 |
By the ratings, the ten favourites are expected to take 16.6 points between them. An edge of 0.118 a match adds about 1.2 points across the ten, less than one draw turned into a win, so this round cannot confirm or refute anything. Four of the ten are within 30 points, as near to even as the ratings get. Ratings built from results alone are slow to notice a club that has changed, and the three promoted clubs start from the average of the clubs they replaced, so read the gaps as the record so far, not as a verdict. The results will land in our running ledger of the season.
What this does and does not say
It measures results, not fatigue. Nothing here records which players went away, how far they travelled or who came back hurt. So it cannot say national-team duty is free. It can say that, whatever the duty costs, favourites came out of the break better off on average, and it cannot separate a cost from a benefit that outweighs it.
The ratings are simple. Elo from results misses injuries, transfers and changes of manager. Those blind spots are there in every round, and the test compares rounds, so they mostly cancel. Anything that happens during breaks in particular, such as a change of manager, is part of what this measures.
The size is uncertain. The edge is unlikely to be chance, but its interval runs from about +0.03 to +0.20 points a match, and one league over 23 seasons is the whole sample. Our look at what a European week costs at the weekend saw the same direction in passing: clubs in Europe did well after gaps of seven days or more, which include these breaks.
How the numbers are made
Everything rests on two steps: rating each club before kickoff, and turning a rating gap into expected points. In Python, with every league match in kickoff order, the steps look like this. Run on the same data, the first reproduces every gap above, including Liverpool's 140.6 against Fulham.
import math

def gaps(matches, k=20, home=60, keep=0.8):
    """matches: every league match in kickoff order (season, home_id, away_id, hs, as).
    Returns the gap before each one: home rating + home advantage - away rating."""
    rating, out, season, clubs = {}, [], None, set()
    for m in matches:
        if m["season"] != season:
            now = {c for x in matches if x["season"] == m["season"] for c in (x["home_id"], x["away_id"])}
            if clubs:
                start = sum(rating[c] for c in clubs - now) / len(clubs - now)
                for c in now - clubs:
                    rating[c] = start          # promoted clubs inherit the relegated average
            for c in now:
                rating[c] = keep * rating.get(c, 1500) + (1 - keep) * 1500
            season, clubs = m["season"], now
        gap = rating[m["home_id"]] + home - rating[m["away_id"]]
        out.append(gap)
        expected = 1 / (1 + 10 ** (-gap / 400))
        result = 1 if m["hs"] > m["as"] else 0.5 if m["hs"] == m["as"] else 0
        rating[m["home_id"]] += k * (result - expected)
        rating[m["away_id"]] -= k * (result - expected)
    return out

def expected_points(gap, table):
    """table[band] = (home wins, draws, away wins) in the other matches; band -5 is below -200, 6 is 300 and above."""
    home_wins, draws, away_wins = table[max(-5, min(6, math.floor(gap / 50)))]
    favourite_wins = home_wins if gap >= 0 else away_wins
    return (3 * favourite_wins + draws) / (home_wins + draws + away_wins)
The table that second step reads is below. The rest is bookkeeping: tagging each match by its place around a pause and averaging the favourite's points minus its expectation.
| Gap | Matches | Home wins | Draws | Away wins |
|---|---|---|---|---|
| below -200 | 152 | 16 (10.5%) | 21 (13.8%) | 115 (75.7%) |
| -200 to -150 | 259 | 39 (15.1%) | 62 (23.9%) | 158 (61.0%) |
| -150 to -100 | 466 | 84 (18.0%) | 106 (22.7%) | 276 (59.2%) |
| -100 to -50 | 633 | 178 (28.1%) | 159 (25.1%) | 296 (46.8%) |
| -50 to 0 | 932 | 315 (33.8%) | 239 (25.6%) | 378 (40.6%) |
| 0 to 50 | 1,259 | 487 (38.7%) | 386 (30.7%) | 386 (30.7%) |
| 50 to 100 | 1,312 | 625 (47.6%) | 346 (26.4%) | 341 (26.0%) |
| 100 to 150 | 1,047 | 540 (51.6%) | 291 (27.8%) | 216 (20.6%) |
| 150 to 200 | 720 | 451 (62.6%) | 166 (23.1%) | 103 (14.3%) |
| 200 to 250 | 533 | 384 (72.0%) | 91 (17.1%) | 58 (10.9%) |
| 250 to 300 | 360 | 275 (76.4%) | 60 (16.7%) | 25 (6.9%) |
| 300 and above | 234 | 195 (83.3%) | 30 (12.8%) | 9 (3.8%) |
Sources & Further Reading
- ESPN public soccer feeds: the eng.1 scoreboard, walked one month at a time from July 2002, for every completed Premier League match and the October 2026 fixtures; and the fifa.friendly, fifa.worldq.uefa, uefa.euroq, uefa.nations and eng.fa scoreboards for every month that overlaps a league pause; retrieved 2026-10-09. Built by
data_layer/build_epl_breaks.pyintodata_layer/epl_breaks_2002_2027_2026-10-09.json; verified bycharts/chart_epl_international_break.py. - FIFA, “FIFA Council approves international match calendars”, 14 March 2023: the Men's International Match Calendar 2025-2030, with “a 16-day, four-match window” in late September and early October from 2026.
- Premier League, “Premier League statement - Clubs pay tribute to the Queen”, 9 September 2022: that weekend's match round postponed as a mark of respect.
- Soccer Power Ratings: Elo, SPI, and Why They Disagree: how rating systems like the one used here are built.
- Does Europe Cost English Clubs at the Weekend?: rest, short weeks and league results.
- Finishing and Saving Rates Have No Memory: the other numbers that do not carry from one match to the next.
- A One-Goal Lead at 90 Minutes Now Slips One Time in Seven: the same 24 seasons of ESPN results, read minute by minute.
- The 2026-27 Premier League, By the Numbers: the living snapshot of the season so far.
Published by SoccerAnalytics from public data and the sources named in this piece. How this site is made.