A One-Goal Lead at 90 Minutes Now Slips One Time in Seven
Twenty-four seasons of goal times show what the longer added time did. From 85:00 to 90:00 nothing changed. After 90:00 one-goal leads slip more than twice as often, and two-goal leads are as safe as ever.
For 21 seasons, a Premier League side leading by one goal when the clock reached 90:00 went on to win 93.3% of the time: 2,870 of 3,077 leads. From 2023-24, referees stopped adding a nominal allowance for stoppages and began adding the time actually lost. In the three seasons since, the same lead has been held 367 times in 430, 85.3%. About one in 15 used to slip away after 90:00; now one in 7 does, 2.2 times as often. Each of the last three seasons sits below all 21 before it. The change happens after 90:00. In the last five minutes before it, a one-goal lead is as safe as it ever was.
Sourcing. Every completed Premier League match on ESPN's public scoreboard from 2002-03 to the 50 played so far this season: 9,170 matches, each with the minute ESPN records for every goal. For 2016-17 onward, ESPN's match summaries add the minute each half ended. Two checks came first. ESPN's minutes reproduce the league's own published counts exactly: 102 added-time goals in 2016-17, the record before the change, and 138 in 2023-24 when the league counted them in April 2024, 12.8% of all goals at that point. And the feed lists 2009-10 twice: 357 extra rows, filed under another season's label, repeat fixtures that are already listed, and 337 of them carry a different score. We dropped them, which leaves 380 matches in each of the 24 complete seasons. Twelve matches, all before 2017-18, whose goal lists do not match the final score stay out of the timing counts, which therefore run on 9,158 matches. The data is pulled by data_layer/build_epl_goal_times.py and data_layer/build_epl_added_time.py, and every figure below is recomputed by charts/chart_epl_lead_added_time.py, which exits non-zero if any of them stops reproducing.
What changed, and when
Before 2023-24, the time added at the end of each half was an allowance: a nominal amount for each goal, substitution or injury. From the first weekend of 2023-24, Premier League referees added the exact time lost to goals and their celebrations, substitutions, injuries and other stoppages, as the league and Opta's analysts both described at the time. A year later the league trimmed the rule: the first 30 seconds after a goal are no longer added. Both announcements are listed in the sources below.
ESPN's match summaries show what that did to the clock. From 2016-17 to 2022-23 the second half ended, on average, at 90+5.3 on ESPN's clock, which shows the minute of the final whistle (90+5 is the fifth added minute). Since 2023-24 the average is 90+7.6: 90+8.1 in the first season, 90+7.1 after the 30-second trim and 90+7.5 last season. First halves went from 45+3.1 to 45+4.3. Before the change, 61.3% of second halves were over by 90+5 and 3.9% ran to 90+9 or later. Since, the figures are 17.8% and 28.8%. ESPN records the whistle in two places, the match's key events and its commentary, and the two agree on 3,825 of 3,847 matches. All 708 second-half added-time goals since 2016-17 fall by the recorded whistle.
Goals followed the minutes. Second-half added time produced 0.155 goals a match from 2016-17 to 2022-23 and 0.252 since. Last season it produced 104, the most of the 24 seasons and one more than the 103 of 2023-24, while the 90 minutes before it produced 2.36 goals a match, the fewest since 2008-09. Counting both halves, 147 of 1,045 goals in 2025-26 came in added time, 14.1%. No season before 2023-24 was above 9.6%.
| Season | Second half ended | First half ended | Goals in second-half added time | One-goal leads at 90:00 held |
|---|---|---|---|---|
| 2016-17 | 90+5.1 | 45+2.9 | 68 | 127 of 137 (92.7%) |
| 2017-18 | 90+5.0 | 45+2.8 | 49 | 126 of 137 (92.0%) |
| 2018-19 | 90+5.2 | 45+2.9 | 72 | 127 of 136 (93.4%) |
| 2019-20 | 90+5.6 | 45+3.4 | 51 | 134 of 142 (94.4%) |
| 2020-21 | 90+5.1 | 45+2.7 | 50 | 141 of 151 (93.4%) |
| 2021-22 | 90+5.4 | 45+3.3 | 72 | 125 of 136 (91.9%) |
| 2022-23 | 90+6.1 | 45+3.6 | 49 | 136 of 143 (95.1%) |
| 2023-24 | 90+8.1 | 45+4.7 | 103 | 116 of 137 (84.7%) |
| 2024-25 | 90+7.1 | 45+3.9 | 80 | 122 of 142 (85.9%) |
| 2025-26 | 90+7.5 | 45+4.2 | 104 | 129 of 151 (85.4%) |
| 2026-27 (50 matches) | 90+6.2 | 45+3.2 | 10 | 17 of 20 |
Where the leads go
The chart's left panel is the headline: 21 seasons between 90.5% (2003-04) and 96.8% (2005-06), then 84.7%, 85.9% and 85.4%. The right panel is the test. Take every side leading by one at 85:00 and ask what happened to the ones that did not win. Before the change, 6.3% had lost the lead by 90:00 and not won it back, and 5.8% were still ahead at 90:00 and then failed to win. Since, 6.6% lost it before 90:00, about the same, and 12.5% lost it after. In those last minutes, the extra losses arrive after 90:00 and nowhere else.
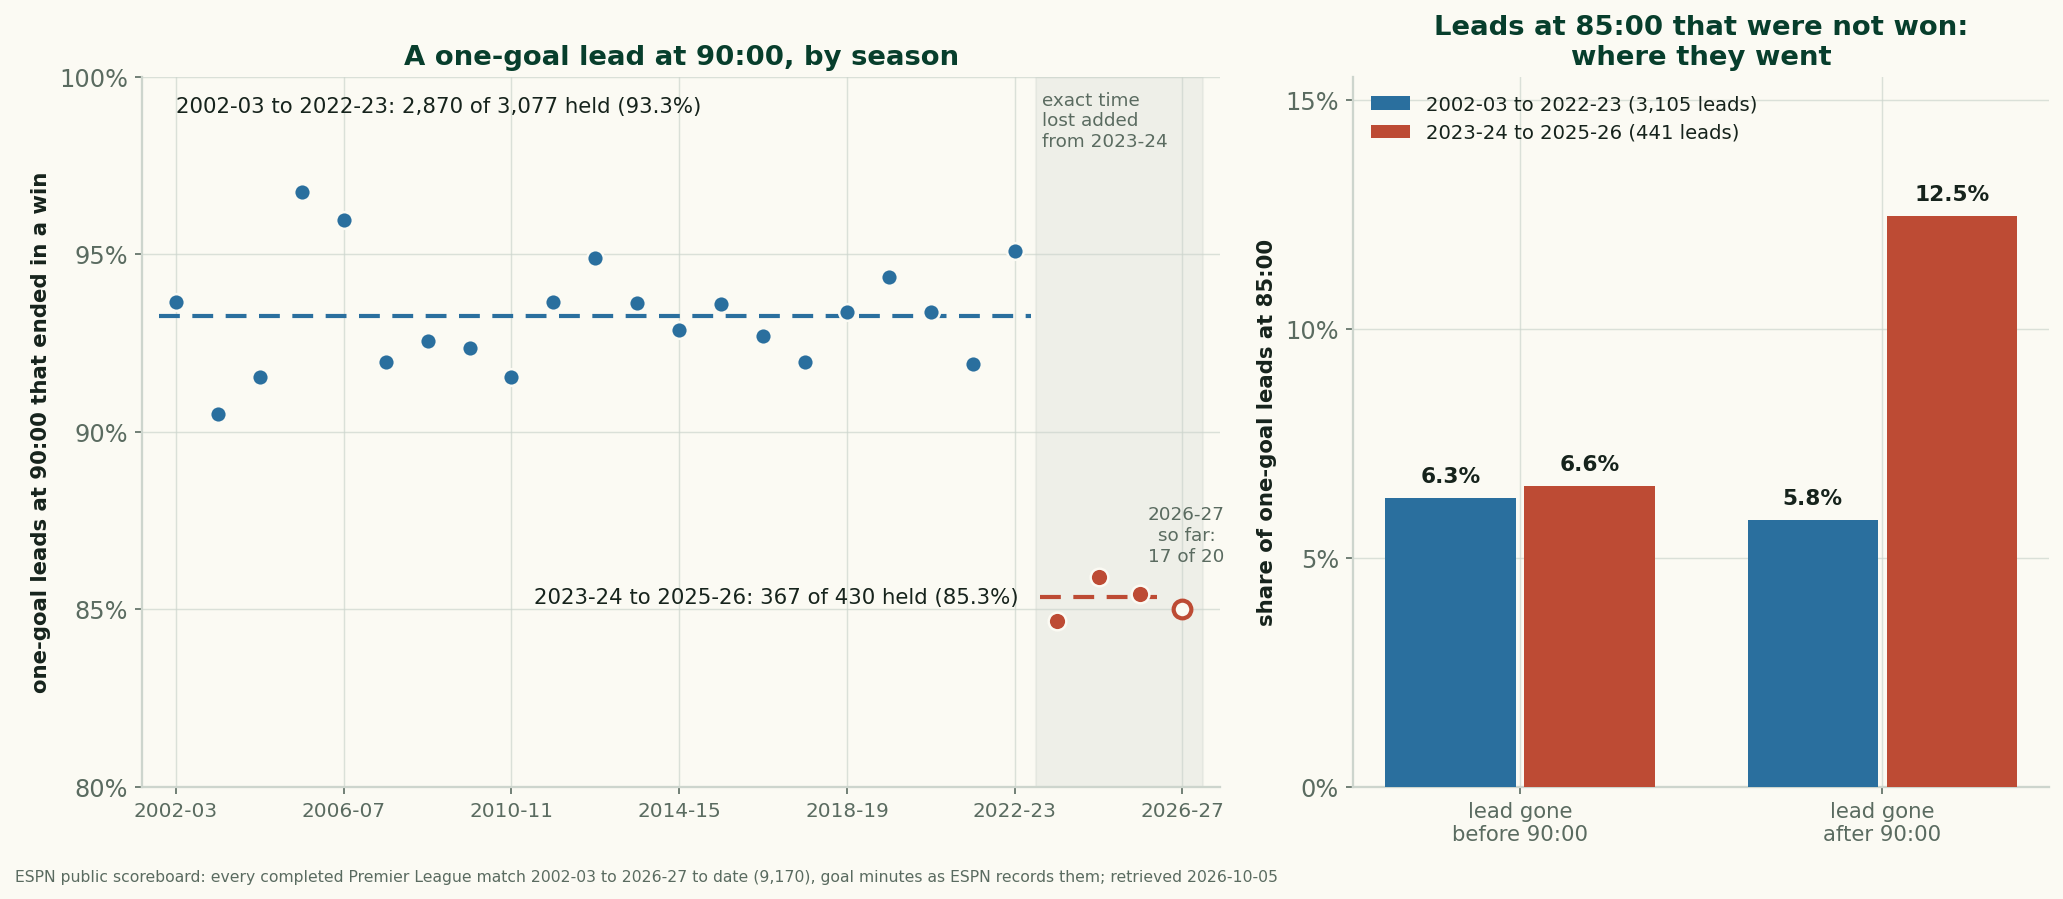
The same split from earlier checkpoints tells the same story. From every one of them, the share of leads lost after 90:00 is 1.9 to 2.3 times the old rate. From 75:00 the share lost before 90:00 also rose, from 15.3% to 18.3%, but most of that is one season. 2023-24 scored 2.89 goals a match in regulation time, the most of the 24, and lost 21.6% of its 75th-minute leads before 90:00. The next two seasons lost 16.3% and 17.5%, within about two points of the old 15.3%.
| Lead at | Seasons | Leads | Won | Lost before 90:00 | Lost after 90:00 |
|---|---|---|---|---|---|
| half-time | 2002-03 to 2022-23 | 3,360 | 69.9% | 27.5% | 2.5% |
| half-time | 2023-24 to 2025-26 | 500 | 62.2% | 33.0% | 4.8% |
| 75:00 | 2002-03 to 2022-23 | 3,253 | 80.1% | 15.3% | 4.5% |
| 75:00 | 2023-24 to 2025-26 | 459 | 71.5% | 18.3% | 10.2% |
| 85:00 | 2002-03 to 2022-23 | 3,105 | 87.9% | 6.3% | 5.8% |
| 85:00 | 2023-24 to 2025-26 | 441 | 81.0% | 6.6% | 12.5% |
| 90:00 | 2002-03 to 2022-23 | 3,077 | 93.3% | 0.0% | 6.7% |
| 90:00 | 2023-24 to 2025-26 | 430 | 85.3% | 0.0% | 14.7% |
It is not about who was leading
A lead held by a stronger side is safer, and home sides hold leads better than visitors, so a change in who tends to lead could move the rate on its own. It did not. Home sides held 56.6% of the one-goal leads at 90:00 before the change and 52.8% since. At the old mix, the new home and away rates would give 85.6%, nowhere near 93.3%. The side with the better points-per-game record that season was the leader 65.2% of the time before and 64.9% since. And the drop shows up inside every group: home leaders 94.8% before and 88.1% since, away leaders 91.2% and 82.3%, leaders with the better record 95.2% and 87.8%, the rest 89.6% and 80.8%.
Two goals are still enough
None of this touches a two-goal lead. Sides two up at 90:00 won 1,679 of 1,681 times before the change and 244 of 244 since. The longer added time has made a one-goal lead fail about one time in seven. In three seasons, no side two goals down at 90:00 has come back to take a point.
What a lead at 90:00 is worth now
Points make the change concrete. Since 2023-24 the 430 one-goal leaders at 90:00 won 367 matches, drew 56 and lost 7: 3 × 367 + 56 = 1,157 points, and 1,157 ÷ 430 = 2.6907 points a lead. Before the change, 2,870 wins and 204 draws from 3,077 leads made 3 × 2,870 + 204 = 8,814 points, and 8,814 ÷ 3,077 = 2.8645 a lead. The gap is 0.1738 points a lead. At the old rate the 430 leads would have earned 430 × 2.8645 = 1,231.7 points. They earned 1,157, so 74.7 points slipped away over three seasons, about 25 points a season.
Count every match, not only one-goal leads, and the result at 90:00 differed from the final result in 484 of 7,968 matches before the change (6.1%, 23 a season) and in 129 of 1,140 since (11.3%, 43 a season). Last season had 52, the most of the 24. A match level at 90:00 is now decided after it 22.8% of the time, against 13.5% before.
The first 50 matches of 2026-27
This season's sample is small, and it points the same way. Through 20 September, the last league round before the break, sides a goal up at 90:00 held on 17 of 20 times. Three did not. Newcastle, 2-1 up at home to Liverpool, conceded at 90'+9' and drew 2-2. Bournemouth, 1-0 up at home to Everton, conceded at 90'+1'. Manchester United, 2-1 up at Everton, conceded at 90'+6'. One level match went the other way, when Manchester City beat Bournemouth 2-1 with a goal at 90'+1'.
Second halves this season have ended at 90+6.2 on average, earlier than in any of the last three seasons. The league changed several laws for 2026-27: substituted players have ten seconds to leave the pitch, clearly delayed throw-ins and goal kicks face a five-second countdown, and a player treated for an injury must stay off for a minute. Fifty matches cannot say whether those changes, or chance, explain the shorter added time. The league resumes on 10 October.
What this does and does not say
It is a before-and-after comparison, not an experiment. The timekeeping change is the obvious cause. The drop starts the season the change did, it sits after 90:00 and not in the five minutes before, it survives a season of low scoring, and it shows up for home and away leaders, stronger and weaker. Other things changed in those seasons too, and a comparison like this cannot rule all of them out.
ESPN's minutes are whole minutes. A goal at 89:30 is shown as 90' and counts as before added time, and a whistle shown as 90+7 came somewhere in the seventh added minute. ESPN once printed 89'+2' for a goal its own clock puts at 88:22; we counted it in the 89th minute.
Added time cannot be read match by match. A late goal and its celebration lengthen the added time they happen in, so long added time and late goals feed each other inside a match. That is why this compares seasons rather than matches with long and short added time.
Three seasons is a small sample. The 95% interval around 85.3% runs from 82.0% to 88.7%. That still sits wholly below the worst of the 21 earlier seasons.
A win-probability model fitted to the seasons before 2023-24 would now put a one-goal lead at 90:00 about eight percentage points too high, which is why how those models handle the clock matters more than it did. The trailing side's all-out push in those minutes is the same game-state effect that bends every other number in a match, and the World Cup's own version of the late-goal pattern is in When World Cup Goals Are Scored.
How the numbers are made
Everything here rests on one step: reading the score at 90:00 from ESPN's goal minutes. Every goal counts except those shown as 90'+N'. In Python, with each match holding its goals, the home side's id and the final score, that step looks like this; run on the same data, it finds the 3,077 and 430 leads above.
import re

def minute(shown):
    """ESPN shows "67'" or "90'+3'": return (67, 0) or (90, 3)."""
    base, added = re.match(r"(\d+)'(?:\+(\d+)')?", shown).groups()
    return int(base), int(added or 0)

def score_at_90(match):
    """Count every goal except those shown as 90'+N' (second-half added time)."""
    home = away = 0
    for goal in match["goals"]:
        base, added = minute(goal["min"])
        if base == 90 and added > 0:
            continue
        if goal["team"] == match["home_id"]:
            home += 1
        else:
            away += 1
    return home, away

def held(match):
    """None unless a side led by exactly one at 90:00; then True if it won."""
    home, away = score_at_90(match)
    if abs(home - away) != 1:
        return None
    final = match["hs"] - match["as"]
    return final > 0 if home > away else final < 0
The rest is counting: for each lead, the final result, and for each earlier checkpoint, whether the lead was still there at 90:00. Seasons run from August to July, so the June and July 2020 matches count in 2019-20.
Sources & Further Reading
- ESPN public soccer feeds: the eng.1 scoreboard, walked one month at a time, for every completed Premier League match from 2002-03 with its goal minutes, and the match summaries, for the minute each half ended in every match from 2016-17; retrieved 2026-10-05. Built by
data_layer/build_epl_goal_times.pyanddata_layer/build_epl_added_time.py; verified bycharts/chart_epl_lead_added_time.py. - Premier League, “What's new in 2023/24: Applications of the Laws of the Game”, 9 August 2023: the exact time lost to goals and celebrations, substitutions, injuries, penalties and red cards is added.
- Oliver Hopkins, “Matches Are Longer, but How Much More Football Are We Getting?”, The Analyst (Opta), 14 August 2023.
- Premier League, “Why 2023/24 has already beaten RECORD goals total”, 25 April 2024: 138 added-time goals, 12.8% of all goals, against the 102 of 2016-17.
- Premier League, “What's new in 2024/25: Rule changes”, 8 August 2024: time is added after a goal only when the restart takes longer than 30 seconds.
- Goal, “Why Premier League games will have less stoppage time in 2024-25”, 15 August 2024.
- Premier League, “How the Laws of the Game are changing in 2026/27 Premier League”, 23 August 2026; and Ewan Ross-Murray, “Every New Rule Confirmed for 2026–27 Premier League Season”, Sports Illustrated, 14 August 2026.
- Game State and Score Effects: why the scoreline bends what each side does late on.
- How Football Win-Probability and Match-Forecast Models Work: the in-game models this changes.
- When World Cup Goals Are Scored: stoppage time at the 2022 World Cup.
- The 2026-27 Premier League, By the Numbers: the living snapshot of the season so far.
More from Data Deep-Dives
Does Europe Cost English Clubs at the Weekend? Three Seasons Can't Find It
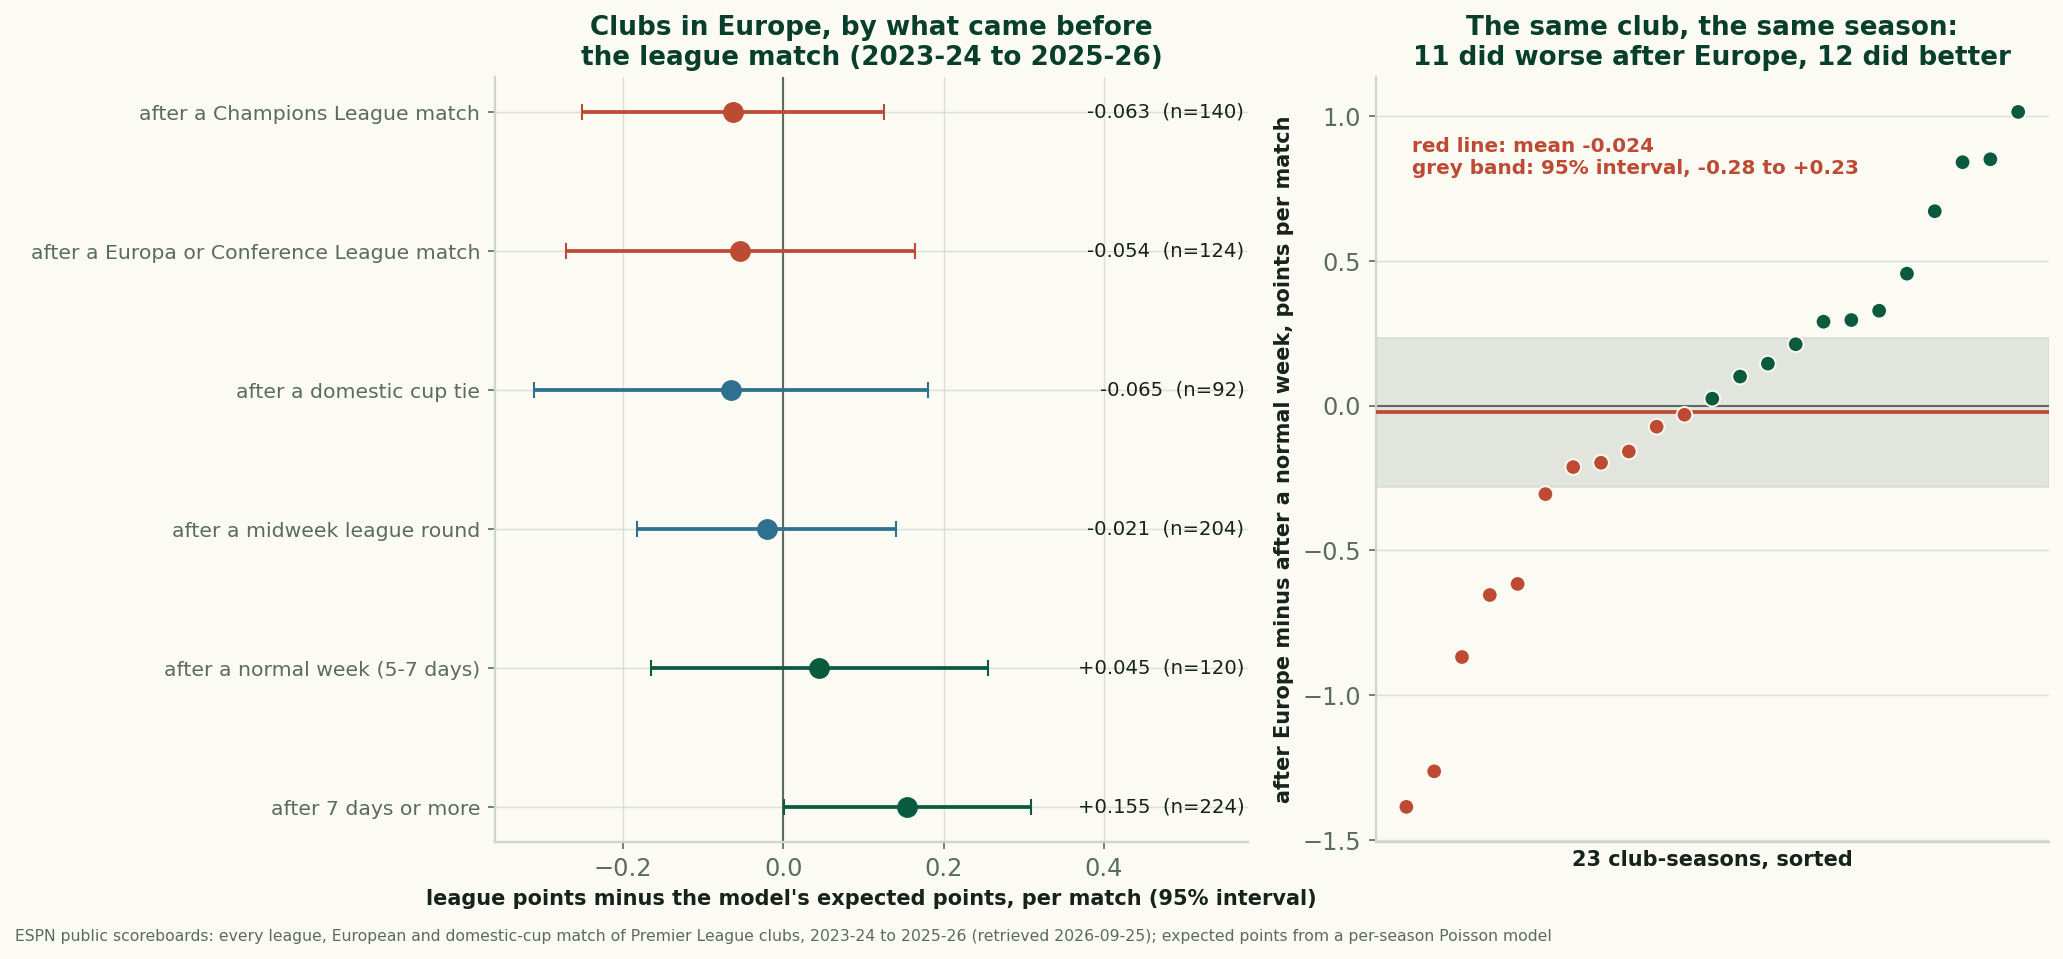
After a European night, English clubs took 1.56 league points a match against 1.62 expected. Within the same club and season the gap is -0.024: not measurable.
Manchester United Lead the League in Shots and Sit Twelfth
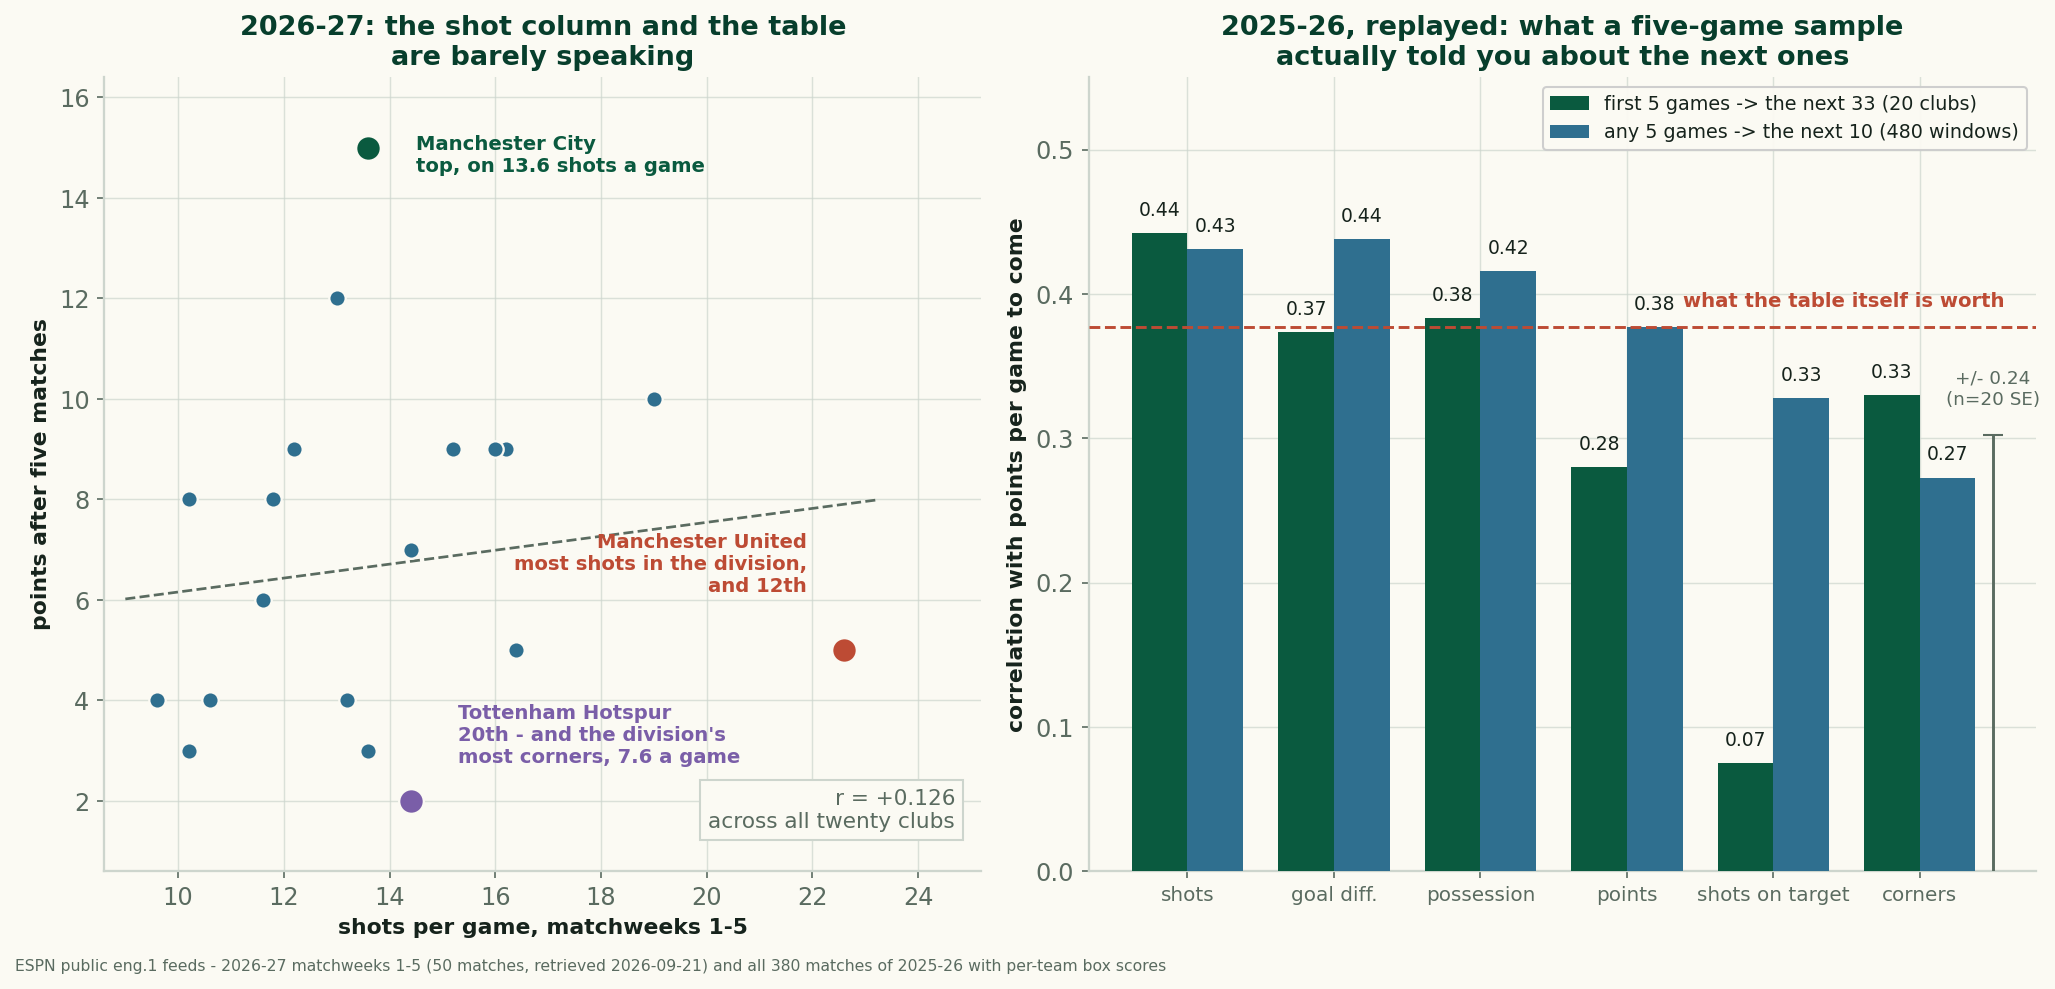
United take 22.6 shots a game and have 5 points. Across 2025-26, a club's five-game shot count predicted its next results better than its points did.
Home Advantage Didn't Die. The Results Column Can't See It
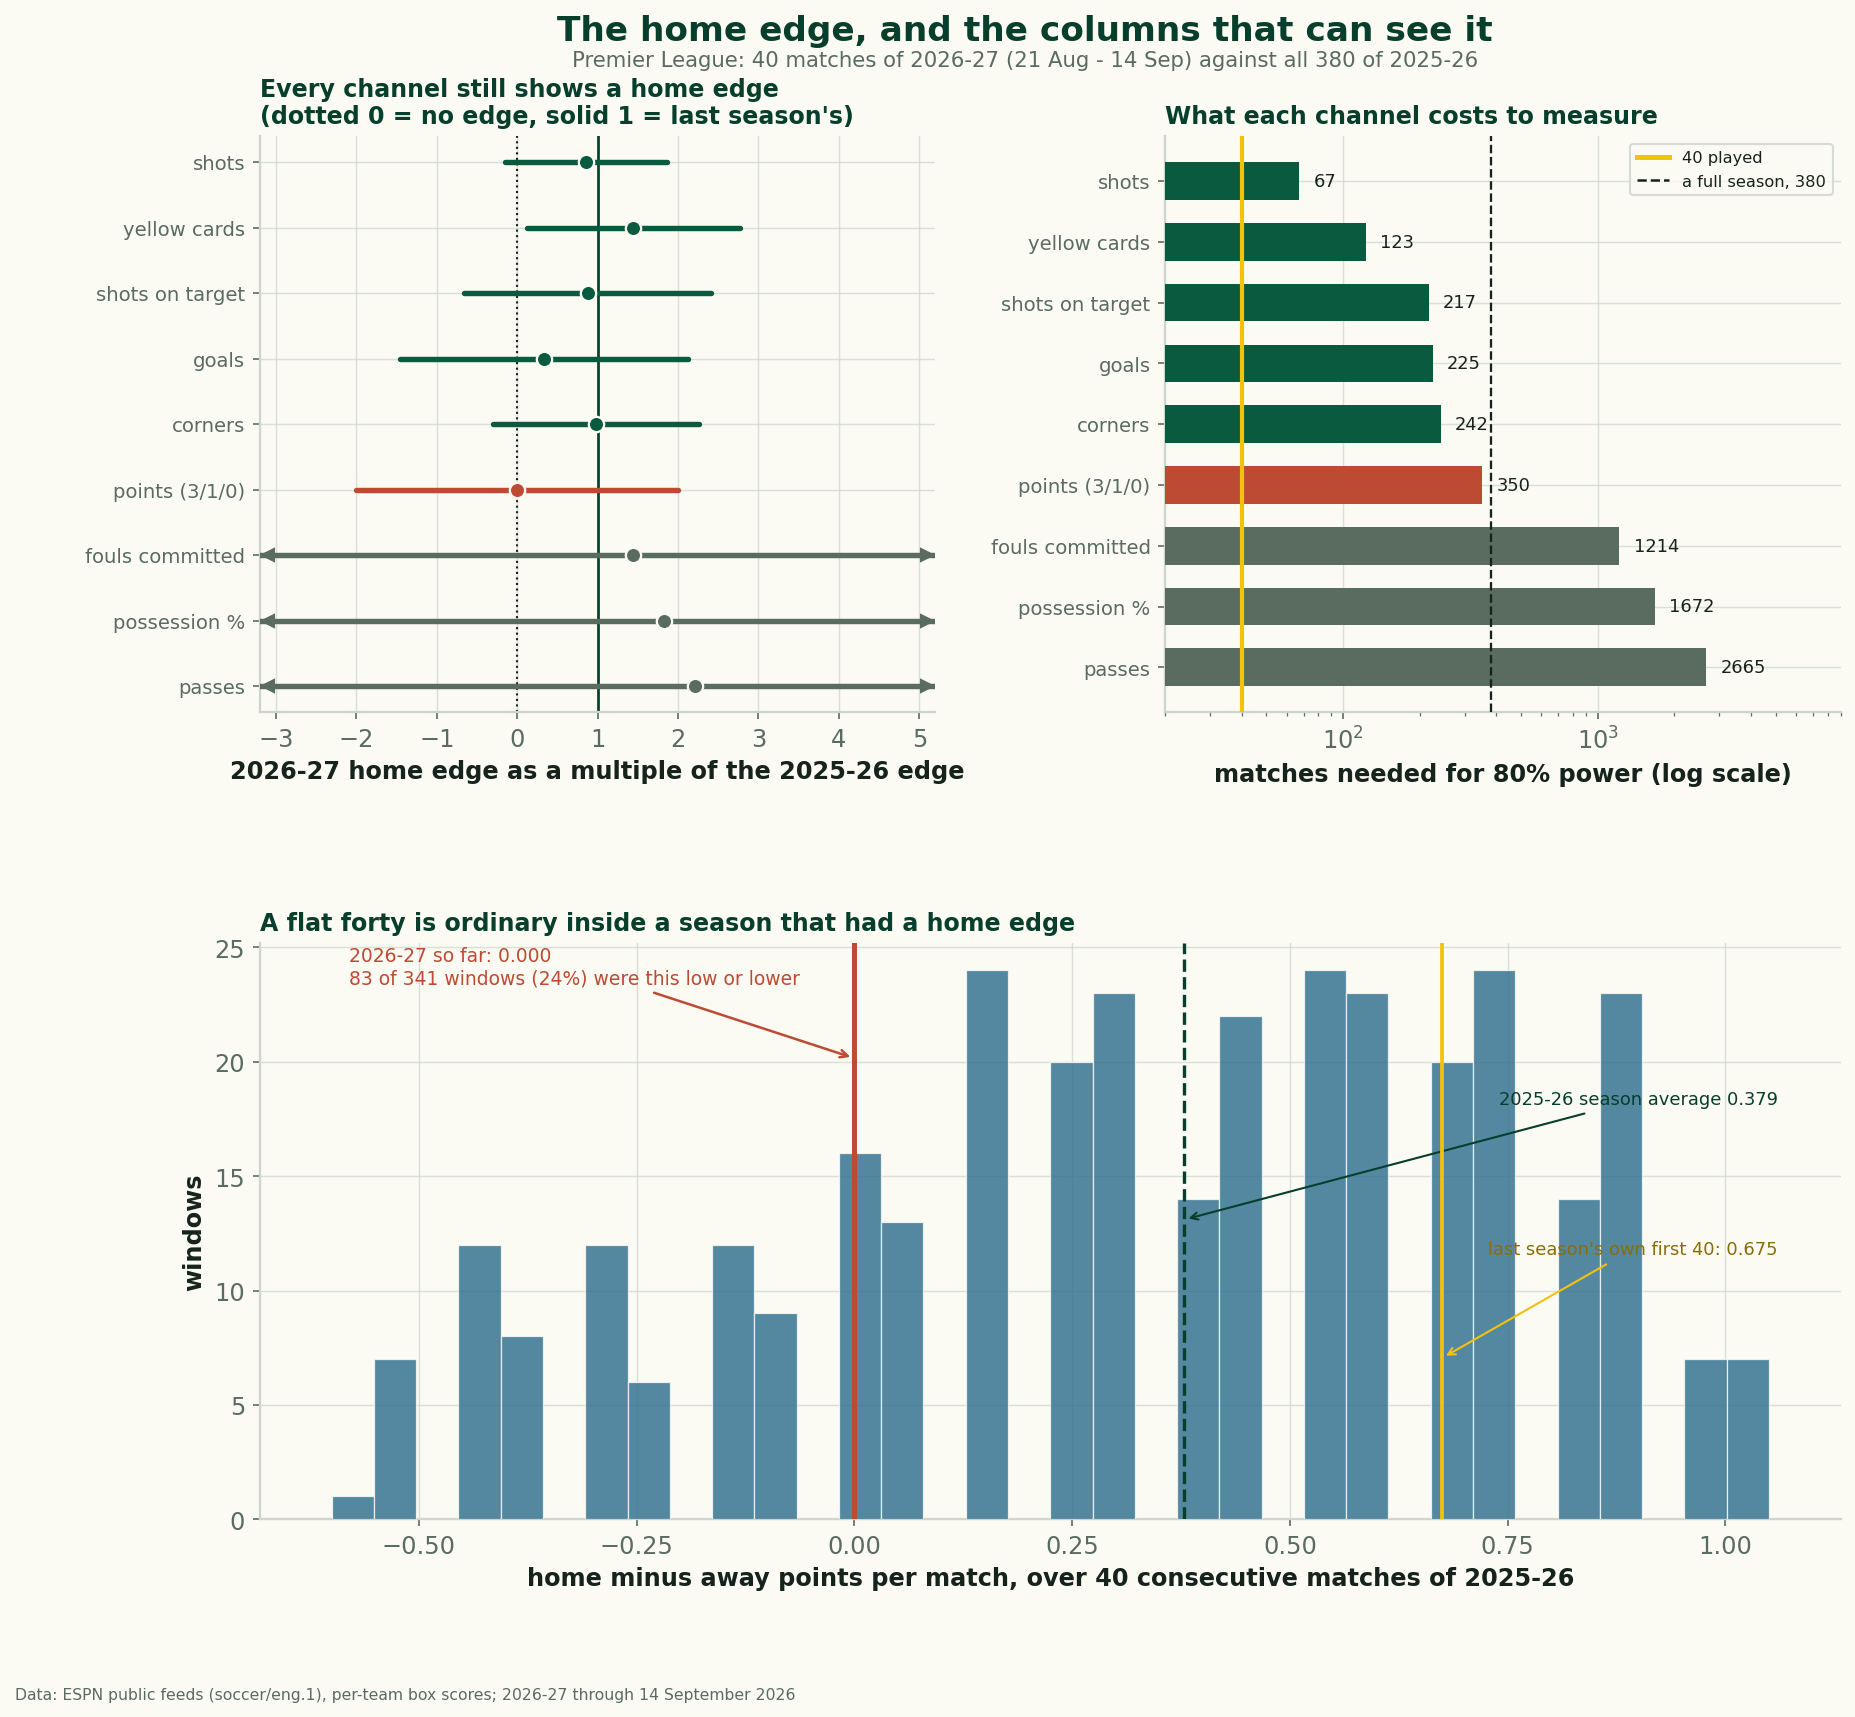
Home and away split the first 40 matches of 2026-27 evenly, yet the shot, corner and card columns keep the home edge. Plus a decade of home-advantage data.