Four Points From Six Games Usually Sinks a Promoted Club. Not the Rest
Six matches in, the bottom three of the Premier League table holds about half of the clubs that will go down. The same points total means very different things for a promoted club and an established one.
Six matches into a Premier League season, the table already knows something about relegation, but less than its bottom three suggests and more than its top half needs. Across 24 seasons, the clubs sitting in the bottom three after six matches included 37 of the 72 that went down: about half. The other half of the reading is sharper. No club with 11 points or more from its first six matches has been relegated, 0 of 140. And a poor start does not mean the same thing for everyone. Since 2003-04, 21 of 27 newly promoted clubs with four points or fewer after six matches went straight back down (77.8%). Established clubs with the same total went down 22 of 64 times (34.4%).
Sourcing. Every completed Premier League match on ESPN's public scoreboard from 2002-03 to 2025-26, 9,120 matches in 24 seasons of 380, from the dated pull of 9 October, data_layer/epl_breaks_2002_2027_2026-10-09.json, served here at that path. A separate pull of the same feed on 5 October agrees with it on every row. ESPN lists the 2009-10 fixtures twice, and the duplicate rows are dropped by the rule our one-goal-lead study uses. This season's table comes from the site's standing refresh as it stood on 12 October: 59 matches, everything played through 11 October, saved as data_layer/snapshots/epl_2026_27_results_2026-10-12.json. Every figure below is recomputed by charts/chart_epl_points_after_six.py, which exits non-zero if any of them stops reproducing.
Who counts as relegated, and who as promoted
The data decide both without a list typed in by hand. A club is relegated if it played in the Premier League in one season and not in the next; a club is promoted if it played in a season and not in the one before. Every season has exactly three of each. Points deductions never have to be looked up, because the rule reads who actually left. As a check, a final table built from results alone, on points, goal difference and goals scored, puts exactly those three clubs in its bottom three in all 24 seasons: 72 of 72. 2002-03 is the first season in the data, so it has no promoted label, and the promoted comparisons run from 2003-04, 23 seasons and 460 club-seasons.
Points after six means a club's own first six league matches in kickoff order, three for a win and one for a draw. Where clubs are level, the order goes to goal difference, then goals scored.
The bottom three is right about half the time
The chart's right panel follows the bottom three through the season. After one match it already holds 21 of the 72 relegated clubs, about twice the 10.8 that three clubs picked at random would hold. After six it holds 37. At halfway, after 19, it holds 49. After 30 it holds 57, and even after 37 of 38 matches it holds 68: four relegated clubs were still outside the bottom three going into the last day. Our replay of last season's table from matchweek one found the whole table settling in October; the relegation places settle later than that.
Points tell more than places. Across all 480 club-seasons, here is how often each total after six matches ended in relegation:
| Points after six | Clubs | Relegated | Share |
|---|---|---|---|
| 0 to 2 | 29 | 21 | 72.4% |
| 3 to 4 | 63 | 23 | 36.5% |
| 5 to 6 | 64 | 12 | 18.8% |
| 7 to 8 | 112 | 13 | 11.6% |
| 9 to 10 | 72 | 3 | 4.2% |
| 11 or more | 140 | 0 | 0.0% |
Two points or fewer is close to a verdict: 21 of 29 went down. Nine or ten points is close to safety: only West Bromwich Albion in 2002-03 and Burnley in 2009-10, on nine, and AFC Bournemouth in 2019-20, on ten, went down from there. Bournemouth's ten is the most any relegated club has had after six matches in these 24 seasons. Between those ends sits a wide band, three to eight points, where 48 of 239 clubs went down: one in five.
The same start, two different meanings
Split the clubs by where they came from and the wide band splits too. The chart's left panel shows it.
| Points after six | Promoted clubs | Established clubs |
|---|---|---|
| 0 to 4 | 21 of 27, 77.8% (59% to 89%) | 22 of 64, 34.4% (24% to 47%) |
| 5 to 7 | 9 of 18, 50.0% | 11 of 98, 11.2% |
| 8 to 10 | 3 of 20, 15.0% | 3 of 99, 3.0% |
| 11 or more | 0 of 4 | 0 of 130 |
| All | 33 of 69, 47.8% | 36 of 391, 9.2% |
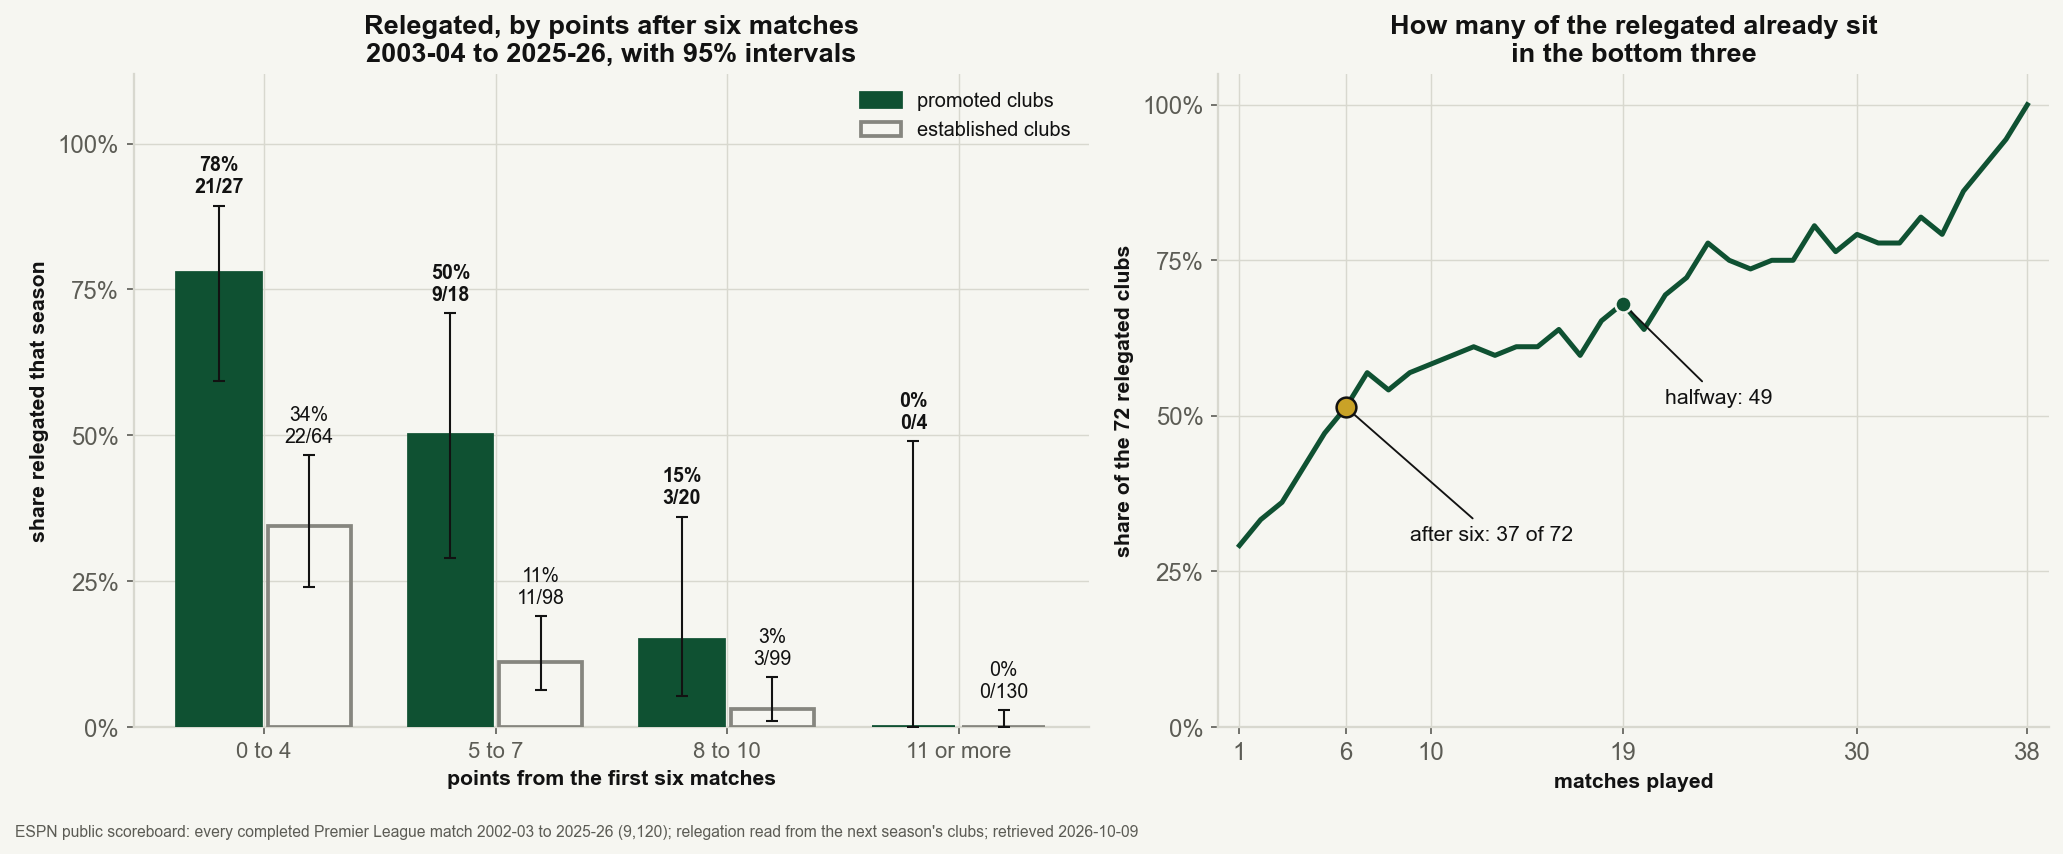
Promoted clubs go down about half the time whatever they do in August and September; established clubs about one time in eleven. Six matches are a small sample of a club's quality, and our piece on what three games can tell you found points among the least reliable numbers in a young table. So the start counts for most where it confirms what was already likely. A promoted club with four points has done what most promoted clubs that go down do. An established club with four points is more often a decent side in a bad month: two in three of them stayed up. The two intervals for the lowest band do not overlap.
The bottom of the scale is starker still. Ten promoted clubs had two points or fewer after six matches, and all ten went down. Established clubs on the same total went down 10 times in 18.
One start, worked through
Burnley came up in 2025-26. Their first six league matches: lost 3-0 at Tottenham Hotspur, beat Sunderland 2-0 at home, lost 3-2 at Manchester United, lost 1-0 at home to Liverpool, drew 1-1 at home to Nottingham Forest, lost 5-1 at Manchester City. That is 0 + 3 + 0 + 0 + 1 + 0 = 4 points, inside the band where 21 of 27 promoted clubs went down, and Burnley were one of them. The two clubs promoted with them did better early and stayed up: Sunderland had 11 points after six and Leeds United 8. In the two seasons before, all six promoted clubs had four points or fewer after six matches (Luton Town 4, Sheffield United 1 and Burnley 1 in 2023-24; Southampton 1, Ipswich Town 4 and Leicester City 3 in 2024-25), and all six went down.
Is the gap an artefact of the cut?
The bands are a choice, so the comparison was rerun at other points in the season. After five matches, with four points or fewer: promoted clubs went down 24 of 37 times, established clubs 25 of 95. After seven matches, with five points or fewer: 22 of 28 against 23 of 64. The gap holds in both halves of the period too. From 2003-04 to 2013-14, promoted clubs with four points or fewer after six went down 8 of 12 times and established clubs 12 of 27. From 2014-15 to 2025-26 it was 13 of 15 against 10 of 37. The promoted side of the comparison has got worse, which fits the last three seasons, when seven of nine promoted clubs went straight back down.
This season, through 11 October
The international break's restart round has nine of its ten matches played. The tenth, Coventry City against Newcastle United, is tonight. Through 11 October, the 59 matches leave this picture at the bottom and among the promoted clubs:
| Club | Played | Points | Goal difference | Same kind, same band, relegated |
|---|---|---|---|---|
| Hull City (promoted) | 6 | 9 | +2 | 3 of 20 promoted clubs on 8 to 10 |
| Ipswich Town (promoted) | 6 | 9 | -3 | 3 of 20 promoted clubs on 8 to 10 |
| Sunderland | 6 | 4 | -6 | 22 of 64 established clubs on 0 to 4 |
| AFC Bournemouth | 6 | 3 | -6 | 22 of 64 established clubs on 0 to 4 |
| Tottenham Hotspur | 6 | 3 | -6 | 22 of 64 established clubs on 0 to 4 |
| Coventry City (promoted) | 5 | 3 | -9 | after tonight: 21 of 27 on 0 to 4, or 9 of 18 on 5 to 7 with a win |
| Fulham | 6 | 2 | -4 | 10 of 18 established clubs on 0 to 2 |
Two of the three promoted clubs have made the kind of start that usually holds: Hull City and Ipswich Town both have nine points, a total from which 3 of 20 promoted clubs went down. Coventry City are the one in the old pattern. They have three points from five, and a draw or a defeat tonight leaves them in the band from which 21 of 27 promoted clubs went down. A win would put them on six, where the record is an even 9 of 18. At the other end, three clubs already have 11 points or more: Manchester City on 18, Arsenal on 15 and Brighton & Hove Albion on 13, a total no relegated club in these 24 seasons reached. Fulham's two points are the lowest in the division, and the record for an established club on two or fewer is close to a coin toss, 10 of 18.
What this does and does not say
It is a record, not a forecast. Each rate is the share of past clubs that went down from a similar spot. It does not know a club's squad, its spending, its manager or its schedule, and a model that did would beat it. It answers a narrower question: how much the points column alone has been worth at this stage.
The promoted samples are small. The lowest band has 27 promoted clubs and the next 18. The interval for the 77.8% runs from 59% to 89%. The gap to established clubs is clear; its exact size is not.
Promoted is a crude label. It lumps the clubs that won the Championship with the ones that came up through the play-offs, and a club in its second season counts as established. Sunderland, promoted in 2025-26, are in the established column this season.
How the numbers are made
Two steps: read relegation and promotion from which clubs appear in consecutive seasons, then total each club's first six results. In Python, with every league match in kickoff order, it looks like this. Run on the same data, it reproduces the lowest band of the table above: 21 of 27 and 22 of 64.
from collections import defaultdict

def six_game_record(matches, n=6, cut=4):
    """matches: every league match in kickoff order (season, home_id, away_id, hs, as).
    Returns {kind: [clubs with cut points or fewer after n, of whom relegated]}."""
    clubs, games = defaultdict(set), defaultdict(lambda: defaultdict(list))
    for m in matches:
        h, a, hs, as_ = m["home_id"], m["away_id"], m["hs"], m["as"]
        clubs[m["season"]] |= {h, a}
        games[m["season"]][h].append(3 if hs > as_ else 1 if hs == as_ else 0)
        games[m["season"]][a].append(3 if as_ > hs else 1 if hs == as_ else 0)
    seasons = sorted(clubs)
    out = {"promoted": [0, 0], "established": [0, 0]}
    for prev, s, nxt in zip(seasons, seasons[1:], seasons[2:]):
        for c in clubs[s]:
            if sum(games[s][c][:n]) <= cut:
                kind = "established" if c in clubs[prev] else "promoted"
                out[kind][0] += 1
                out[kind][1] += c not in clubs[nxt]
    return out
Run over every completed match from 2002-03 to the current season, the last season with a successor in the data is 2025-26, so 2026-27 is only ever the "next" season, and 2002-03 only ever the "previous" one.
Sources & Further Reading
- ESPN public soccer feeds: the eng.1 scoreboard, walked one month at a time from July 2002, for every completed Premier League match; retrieved 2026-10-09 into
data_layer/epl_breaks_2002_2027_2026-10-09.jsonbydata_layer/build_epl_breaks.py, and the 2026-27 season as refreshed on 2026-10-12 bydata_layer/refresh_epl.py, saved asdata_layer/snapshots/epl_2026_27_results_2026-10-12.json. Verified bycharts/chart_epl_points_after_six.py. - The Table Lies Until October: last season's whole table, replayed from matchweek one.
- Three Games Tell You How a Team Plays, Not How Good It Is: why points are among the least reliable numbers in a young table.
- Schedule Strength Is Real. It Still Won't Fix the Table: how much the early fixtures bend the table.
- The Round After an International Break Has Fewer Upsets, Not More: the restart round these numbers run through.
- The 2026-27 Premier League, By the Numbers: the living snapshot of the season so far.
Published by SoccerAnalytics from public data and the sources named in this piece. How this site is made.