Finishing and Saving Rates Have No Memory
The early table is built from two things, how many shots on target a club creates and allows, and what share of them go in. Last season only the first had a memory. The second is currently doing most of the talking.
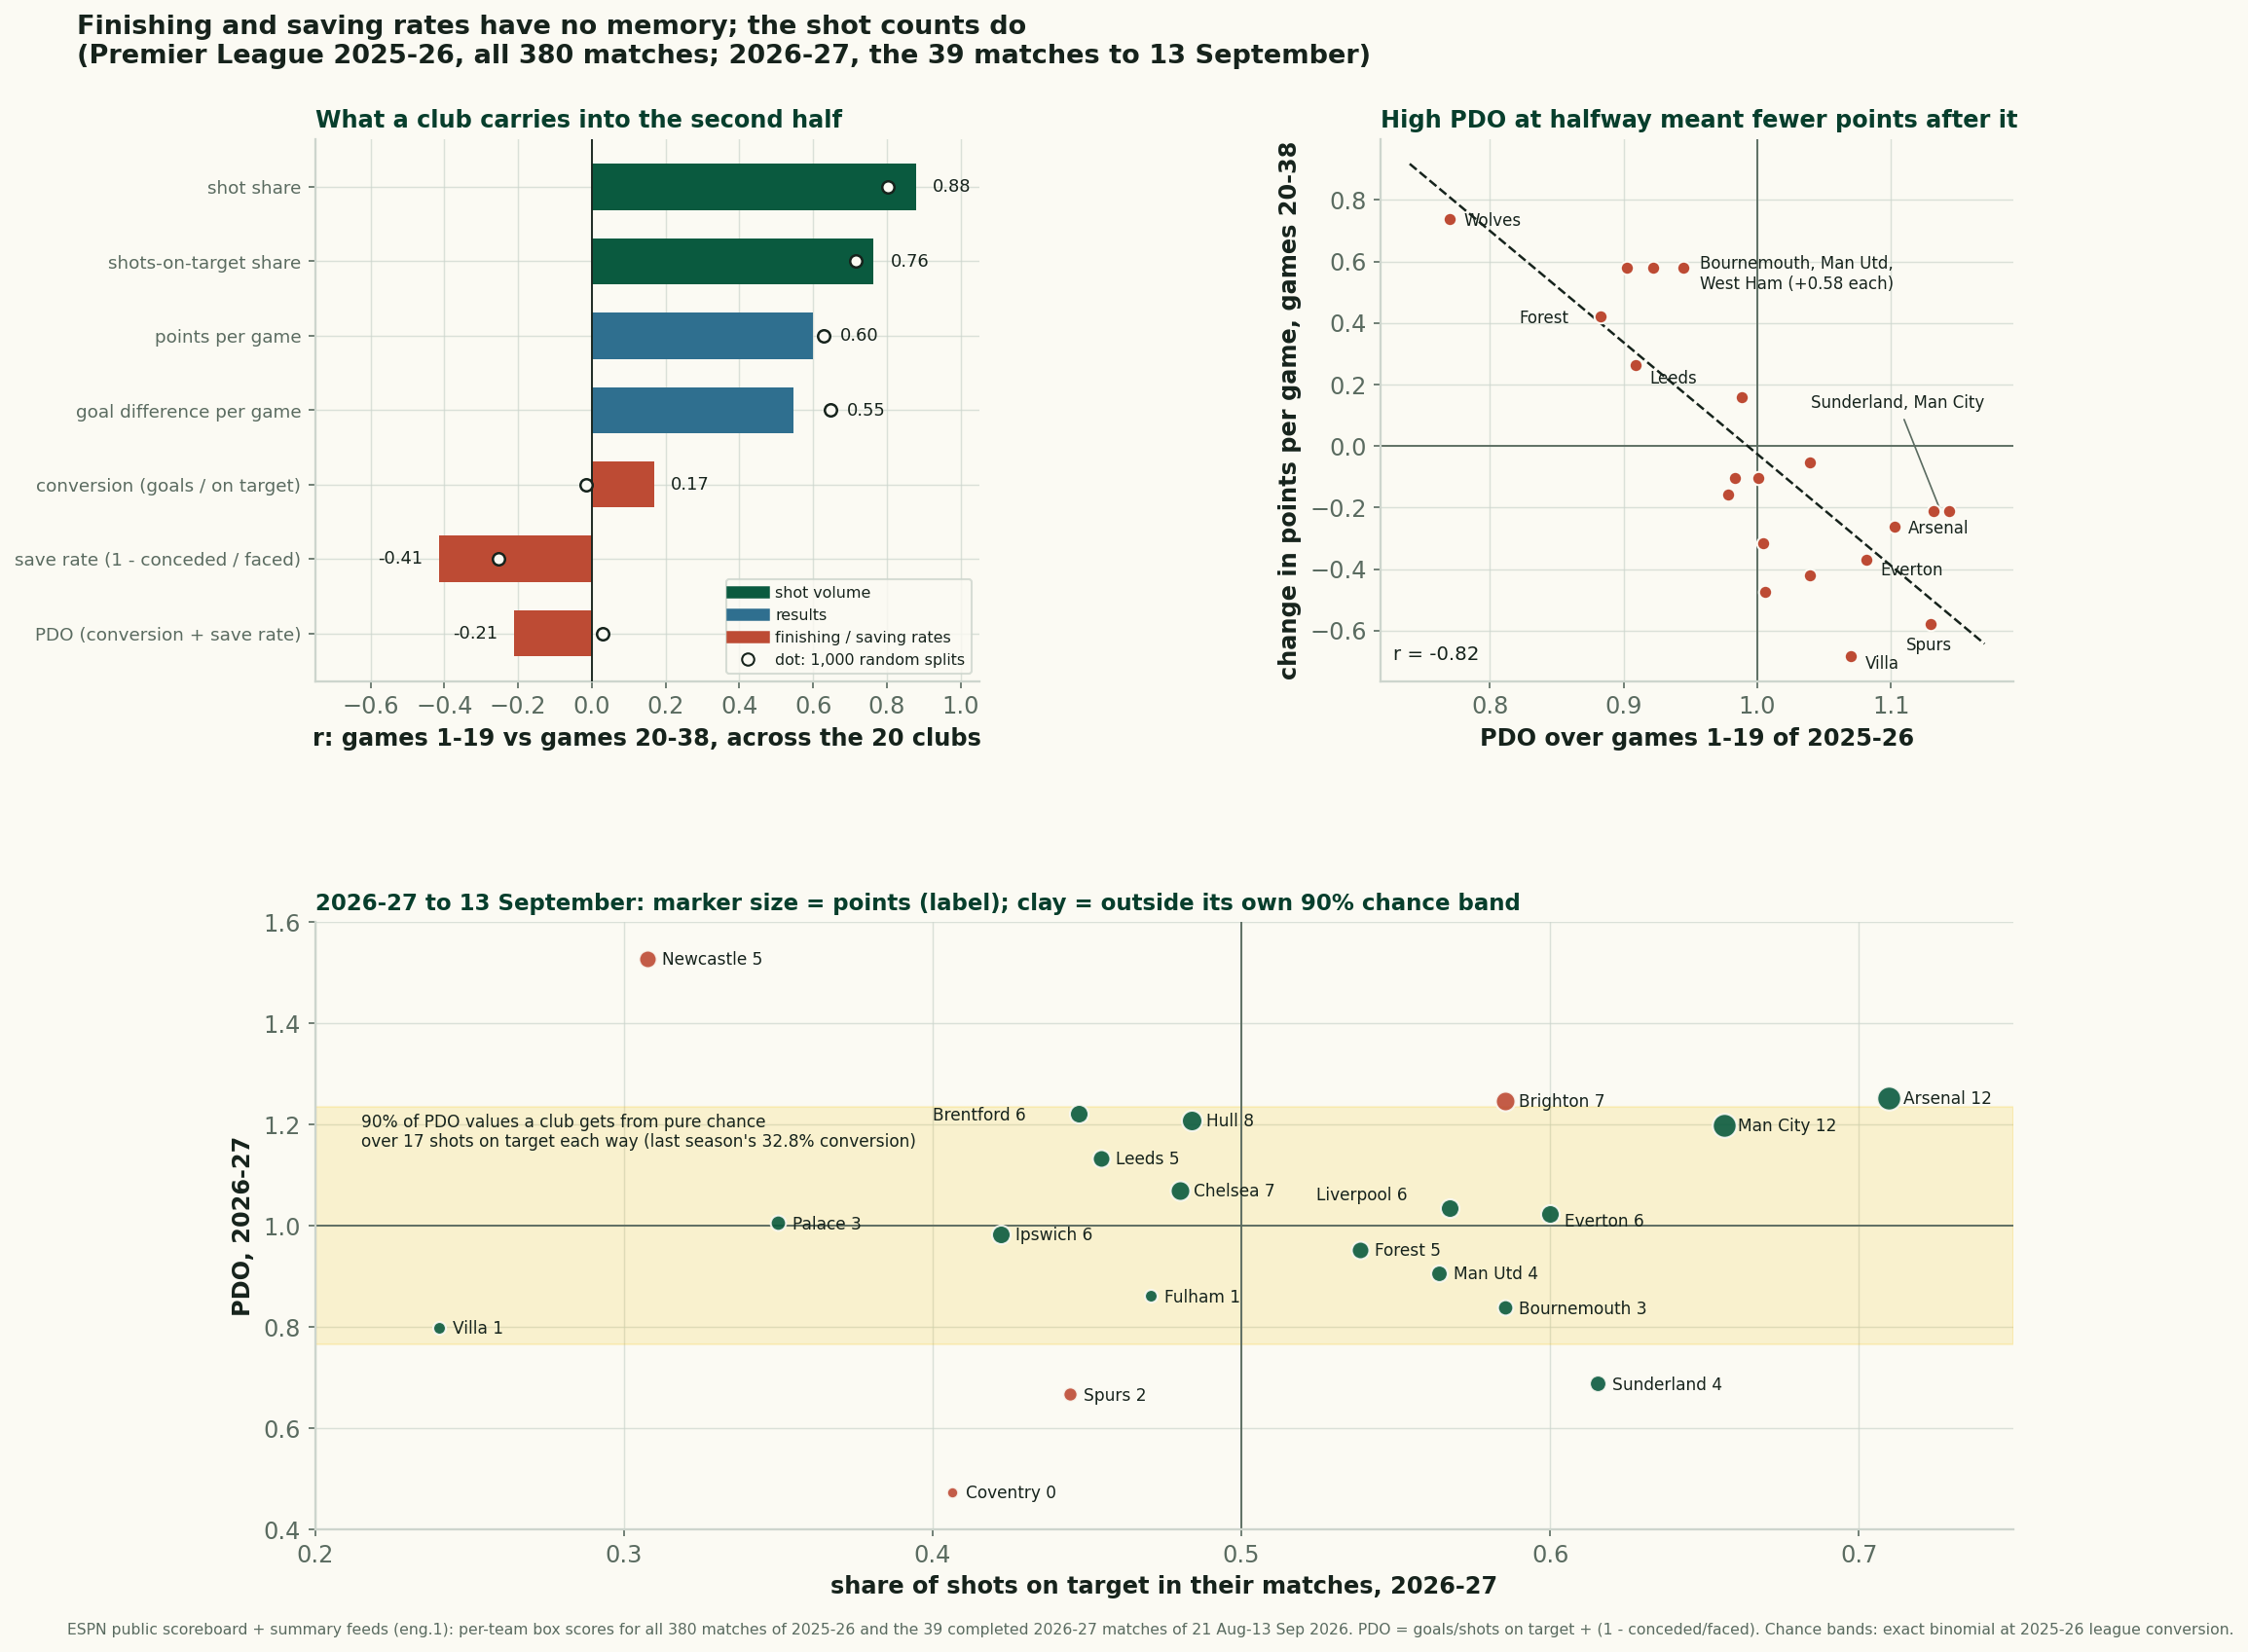
Every goal in a box score is a shot on target times a rate: a club converts a share of the shots on target it creates and saves a share of those it allows. Add the two rates and you have PDO, exactly 1.000 for the league and rarely 1.000 for any club in it. Last season makes the case against reading it: in 2025-26, a Premier League club's PDO over its first 19 games correlated −0.21 with its PDO over the last 19, while its share of the shots on target correlated 0.76. The rates had no memory; the volumes did. And four rounds into 2026-27, a club's points correlate 0.76 with its PDO and 0.56 with its share of shots on target. The table is currently reading the column that forgets.
Sourcing. Two datasets, no models, no expected goals. Last season is all 380 matches of 2025-26 with ESPN's per-team box scores, served at data_layer/epl_2025_26_boxscores.json. This season is ESPN's public scoreboard and summary feeds for eng.1, completed matches only, re-pulled by data_layer/refresh_epl.py on 14 September 2026: 39 matches from 21 August to 13 September, which is matchweeks one to three and nine of matchweek four's ten. The tenth, Leeds United against Newcastle United, is scheduled for the evening of 14 September and had not kicked off at retrieval, so Leeds and Newcastle have played three games and everyone else four. Every figure below is recomputed from those two files by charts/chart_epl_pdo_memory.py, which runs 165 checks and exits non-zero if any published number stops reproducing.
Two ratios and a volume
The definitions are box-score definitions, and the argument depends on them. Conversion is goals scored divided by shots on target. Save rate is one minus goals conceded divided by the opponent's shots on target. PDO is the sum. The name is not an acronym: it is the online handle of Brian King, the Oilers fan and hockey blogger who first added a team's shooting and save percentages together, and it reached football through the Premier League work of analysts such as James Grayson, whose writing on the total shots ratio covers the other number in this piece. Because every goal one club scores is one another concedes, and every shot on target taken is one faced, the league's PDO is exactly 1.000. In 2025-26 the league converted 1,045 goals from 3,185 shots on target, or 32.8%.
A shot on target, in the Opta definition the industry uses, is an attempt that goes in or would have without a goalkeeper's save or a last-line block. ESPN's numbers behave like that: last season a club's saves plus goals conceded equalled the opponent's shots on target in 615 of 760 team-games, and the other 145 were off by one or two, 83 short and 62 over, as clearances off the line and own goals would make them. That noise is small next to the noise in the rates.
Last season, the ratios forgot
Cut each club's 2025-26 into games 1–19 and games 20–38, and correlate the two halves across the twenty clubs. Shot share carries over at 0.88, share of shots on target at 0.76, points per game at 0.60 and goal difference at 0.55. Conversion carries over at 0.17. Save rate carries over at −0.41. PDO carries over at −0.21. The chronological cut is one cut, so we ran two more: odd games against even games gives PDO 0.12 and shots-on-target share 0.77, and the average over a thousand random 19-and-19 splits gives PDO 0.03, conversion −0.01, save rate −0.25 and shots-on-target share 0.72. The PDO correlation came out negative in 45% of those splits. The shots-on-target share correlation came out negative in none of them.
In regression terms, a club's second-half shots-on-target share kept 0.67 of its first-half distance from the league mean, and its PDO kept −0.16, which is none. As predictors of second-half points, first-half shots-on-target share scored 0.77, actual points 0.60 and PDO 0.09.
Halfway PDO told you who would fall
A number with no memory is not a useless number. It tells you which way a club's results are about to move. Last season a club's PDO over its first 19 games correlated −0.82 with the change in its points per game over the last 19; on its own it accounts for 67% of the variation in who gained and who lost ground after halfway, with every 0.1 of first-half PDO worth about 0.36 fewer points per game later.
The five clubs with the highest PDO at halfway were Manchester City, Sunderland, Tottenham, Arsenal and Everton, at an average of 1.118. All five had a lower PDO in the second half, averaging 0.963, and all five took fewer points per game: 1.78 before, 1.45 after, or about 6.2 fewer points each over nineteen games. Their share of shots on target went up, from 0.521 to 0.553. The five lowest — Wolves, Nottingham Forest, Bournemouth, Leeds and Manchester United, averaging 0.877 — all rose, to 1.036, and all took more points: 1.00 a game before, 1.52 after, about 9.8 more points each, on a shots-on-target share that barely moved, from 0.491 to 0.511.
Tottenham are the cleanest case: the third-highest PDO at halfway, 1.130, from 42.9% conversion and a 70.1% save rate, and 26 points. After it, conversion fell to 25.3%, the save rate to 54.7% and PDO to 0.800, and they took 15 points, while their share of the shots on target rose from 0.450 to 0.525. They got better at the part that persists and collected eleven fewer points.
How much of it is luck
Is the spread of PDOs wider than chance? If every club converted and conceded at the league's 32.8%, its goals for and against would be binomial draws on its own shot volumes. Simulate that league 20,000 times and the full-season spread of club PDO averages a standard deviation of 0.051. The real 2025-26 spread was 0.052, at the 57th percentile of the simulations. Conversion rates sat at the 41st percentile. Save rates sat at the 5th: narrower than chance. That is why the save-rate correlations above are negative: when clubs differ by less than the noise inside a season, a club's two halves lean against each other to add up to the whole.
This does not prove there is no finishing or goalkeeping skill in the league; it says one season of box scores cannot find it at the club level. Two clubs finished outside their own 90% chance band, Manchester City above it at 1.100 and Wolves below it at 0.840, which is the two of twenty a 90% band expects. But City and Arsenal had the top two PDOs and the top two points totals, and both stayed above 1.05 in both halves. We come back to that below.
The 2026-27 table, split in two
Through 13 September the league has converted 109 goals from 339 shots on target, 32.2%, and clubs take 4.35 shots on target a game, about 17 each way over four games. At that volume pure chance puts 90% of club PDOs between 0.765 and 1.235. The real spread is a standard deviation of 0.239, against last season's full-season 0.052. Sixteen of the twenty clubs sit inside the chance band for their own volumes. Four sit outside it: Newcastle and, by a whisker, Brighton above; Tottenham and Coventry below. Chance alone would put about two outside.
Read the table with that in mind. The five clubs on seven points or more — Arsenal and Manchester City on 12, Hull on 8, Brighton and Chelsea on 7 — all have a PDO of 1.071 or higher. Arsenal and City at least have the volume to go with it: first and second in share of shots on target, at 0.710 and 0.656. Hull have eight points from a share of 0.484 and a PDO of 1.208; at league rates their shots on target would have produced a goal difference of −0.33, and it is +3. Brighton have scored 13 goals from 24 shots on target, 54.2%.
The other end is where the table is unkindest. Sunderland are third in the league for share of shots on target, at 0.615, and eighteenth for PDO, at 0.688, with four points. They have taken 16 shots on target and faced 10; at league rates that is a goal difference of +1.97, and theirs is −2. Coventry and Tottenham have not scored at all, from 13 and 12 shots on target. At 32.8% conversion, a blank from 13 has probability 0.0057 and a blank from 12 has 0.0085: rare for any one club, not for somebody in a 20-club league. Aston Villa are the useful contrast: one point, a PDO of 0.798 that sits inside the chance band, and just six shots on target in four games, the lowest share in the league at 0.240. Villa's problem is the part that persists.
Worked: Newcastle's six from eight
Newcastle drew 2-2 with Liverpool, won 2-0 at Tottenham and drew 2-2 with Bournemouth. Across those three games they took 8 shots on target and scored 6; they faced 18 and conceded 4.
- Conversion: 6 ÷ 8 = 0.750. Save rate: 1 − 4 ÷ 18 = 0.778. PDO: 0.750 + 0.778 = 1.528, the highest in the league.
- At last season's league rate, 1,045 ÷ 3,185 = 0.328, eight shots on target are worth 8 × 0.328 = 2.62 goals and eighteen faced are worth 18 × 0.328 = 5.91 conceded.
- That is a rate-neutral goal difference of 2.62 − 5.91 = −3.28. The real one is +2. The rates are worth 5.28 goals in three matches.
- How unusual is it? Six or more goals from eight shots on target at 32.8% has probability 0.0181. Four or fewer conceded from eighteen has probability 0.2456, which is ordinary. A PDO of 1.528 or higher on these volumes has probability 0.0059.
- What to keep: last season's halfway slope for PDO was −0.16, so the honest projection for Newcastle's rates from here is the league's.
That does not make Newcastle bad; three games of shot share are not a verdict either. It says their five points, level with two other clubs in tenth, came from the rates, while their share of shots on target is 19th of 20.
What this cannot tell you
- Every shot on target is not equal. Ted Knutson's 2016 StatsBomb essay against PDO in football leads with this, and it is right: a tap-in and a 30-yard drive both count as one, and a club that creates better chances converts more for reasons that are not luck. Expected goals and post-shot xG exist for exactly this; this feed carries neither.
- Not every club regresses all the way. Knutson also argues that elite sides hold an above-average PDO season after season, and City and Arsenal's two halves above 1.05 fit that. Our test says the league-wide spread is no wider than chance in one season; it cannot rule out a small, real edge for the best two or three clubs, and we would not expect Arsenal's rates to fall all the way to the league's.
- Four games are not much of a reading of volume either. In 2025-26 a club's first four games of shots-on-target share correlated only 0.32 with the rest of its season, and predicted rest-of-season points at 0.28, no better than its first four games of points. The plain shot share did better, at 0.52. The claim is that the rates are noise, not that the volumes are already true; the reliability piece covers how slowly each count settles.
- The fixtures are not random. Three strong attacks mean better shots faced; the schedule-strength piece covers how little an opponent correction changes the early table.
- One season, twenty clubs, one provider. A correlation across twenty clubs has a standard error near 0.2. The ordering held on three different splits; the second decimals would not survive another season. Penalties and own goals sit inside the goal counts.
Reproduce it
Per club and game, take goals for and against from the scoreline and shotsOnTarget and totalShots for both sides. Conversion is goals over shots on target, save rate one minus conceded over faced, PDO the sum. Memory is the correlation across clubs between games 1–19 and 20–38, odd and even games, and 1,000 seeded random splits. The chance band enumerates goals ~ Binomial(s, p) against conceded ~ Binomial(a, p), with p = 1,045 ÷ 3,185, and reads the 5th and 95th percentiles of the resulting PDO. The chart script does all of it with fixed seeds and prints every figure above.
The live season is on the 2026-27 tracker, which updates itself after every round. The matchweek pieces kept promising that early conversion would come back to earth. Last season says it will, on no particular schedule, and that the clubs to trust are the ones whose shots are better than their table.
Sources & further reading
- 2025-26 box scores, all 380 matches:
data_layer/epl_2025_26_boxscores.json, pulled from ESPN's public summary feed bybuild_epl_2025_boxscores.py. - 2026-27 results and box scores: ESPN’s public scoreboard and summary feeds for eng.1, completed matches only, pulled by
data_layer/refresh_epl.pyand served at/data/epl_2026_27_results.json(50 completed matches as of 2026-09-25; this piece reads the 2026-08-21 to 2026-09-13 window of it, 39 matches). - The shot-on-target definition: Opta event definitions, Stats Perform.
- PDO's origin in hockey analytics: Analytics (ice hockey), Wikipedia.
- Total shots ratio in the Premier League: James Grayson, Another post about TSR (15 July 2012).
- The case against PDO in football: Ted Knutson, PDO in Football/Soccer Is Stupid – Please Stop Using It, StatsBomb (10 April 2016).
- The tournament version of the same question, where a season-long test was not possible: Clinical or Wasteful? Shot Conversion at the 2026 World Cup.
- How fast the counts themselves settle: Three Games Tell You How a Team Plays, Not How Good It Is; and the table alone, replayed: The Table Lies Until October.
- The matchweek ledger that first flagged the heists: The Shots-on-Target Rule and Matchweek Two.
- Reproduction: the two datasets above plus the recipe in “Reproduce it”, all recomputed by
charts/chart_epl_pdo_memory.py.
More from Data Deep-Dives
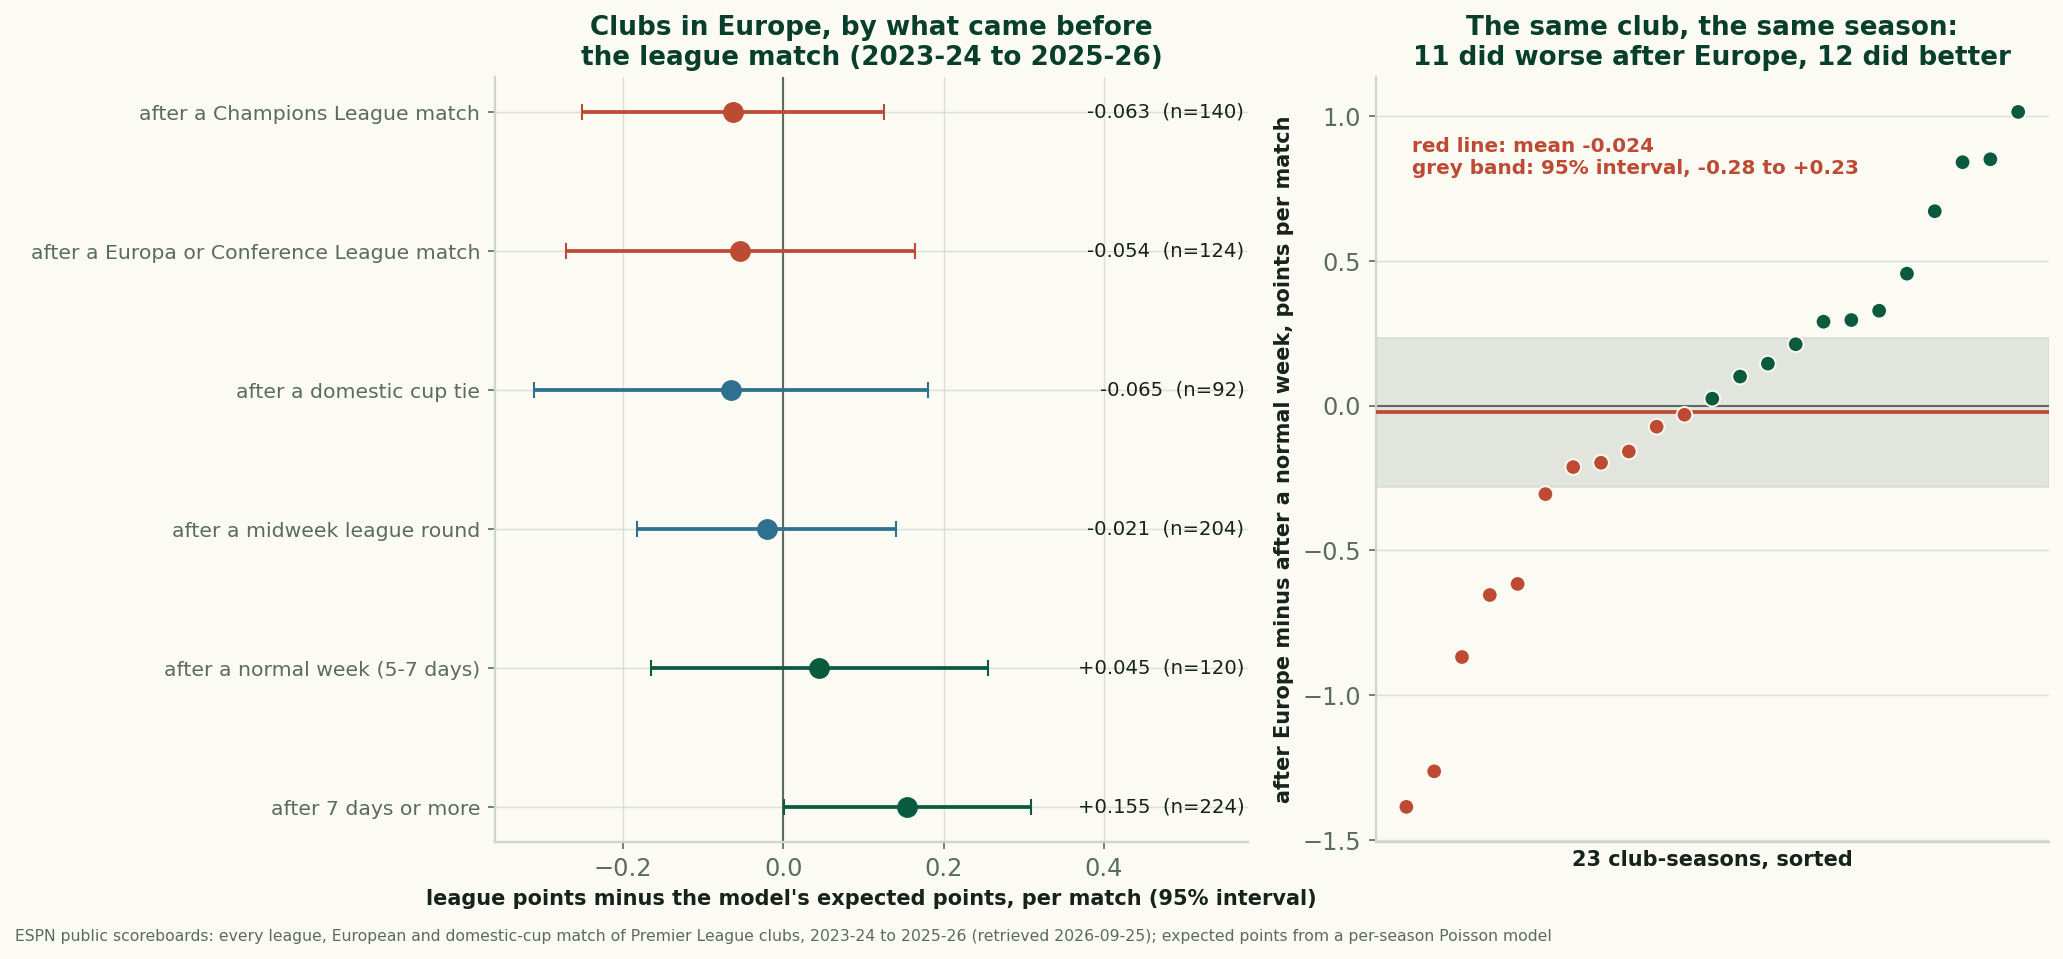
Does Europe Cost English Clubs at the Weekend? Three Seasons Can't Find It
After a European night, English clubs took 1.56 league points a match against 1.62 expected. Within the same club and season the gap is -0.024: not measurable.
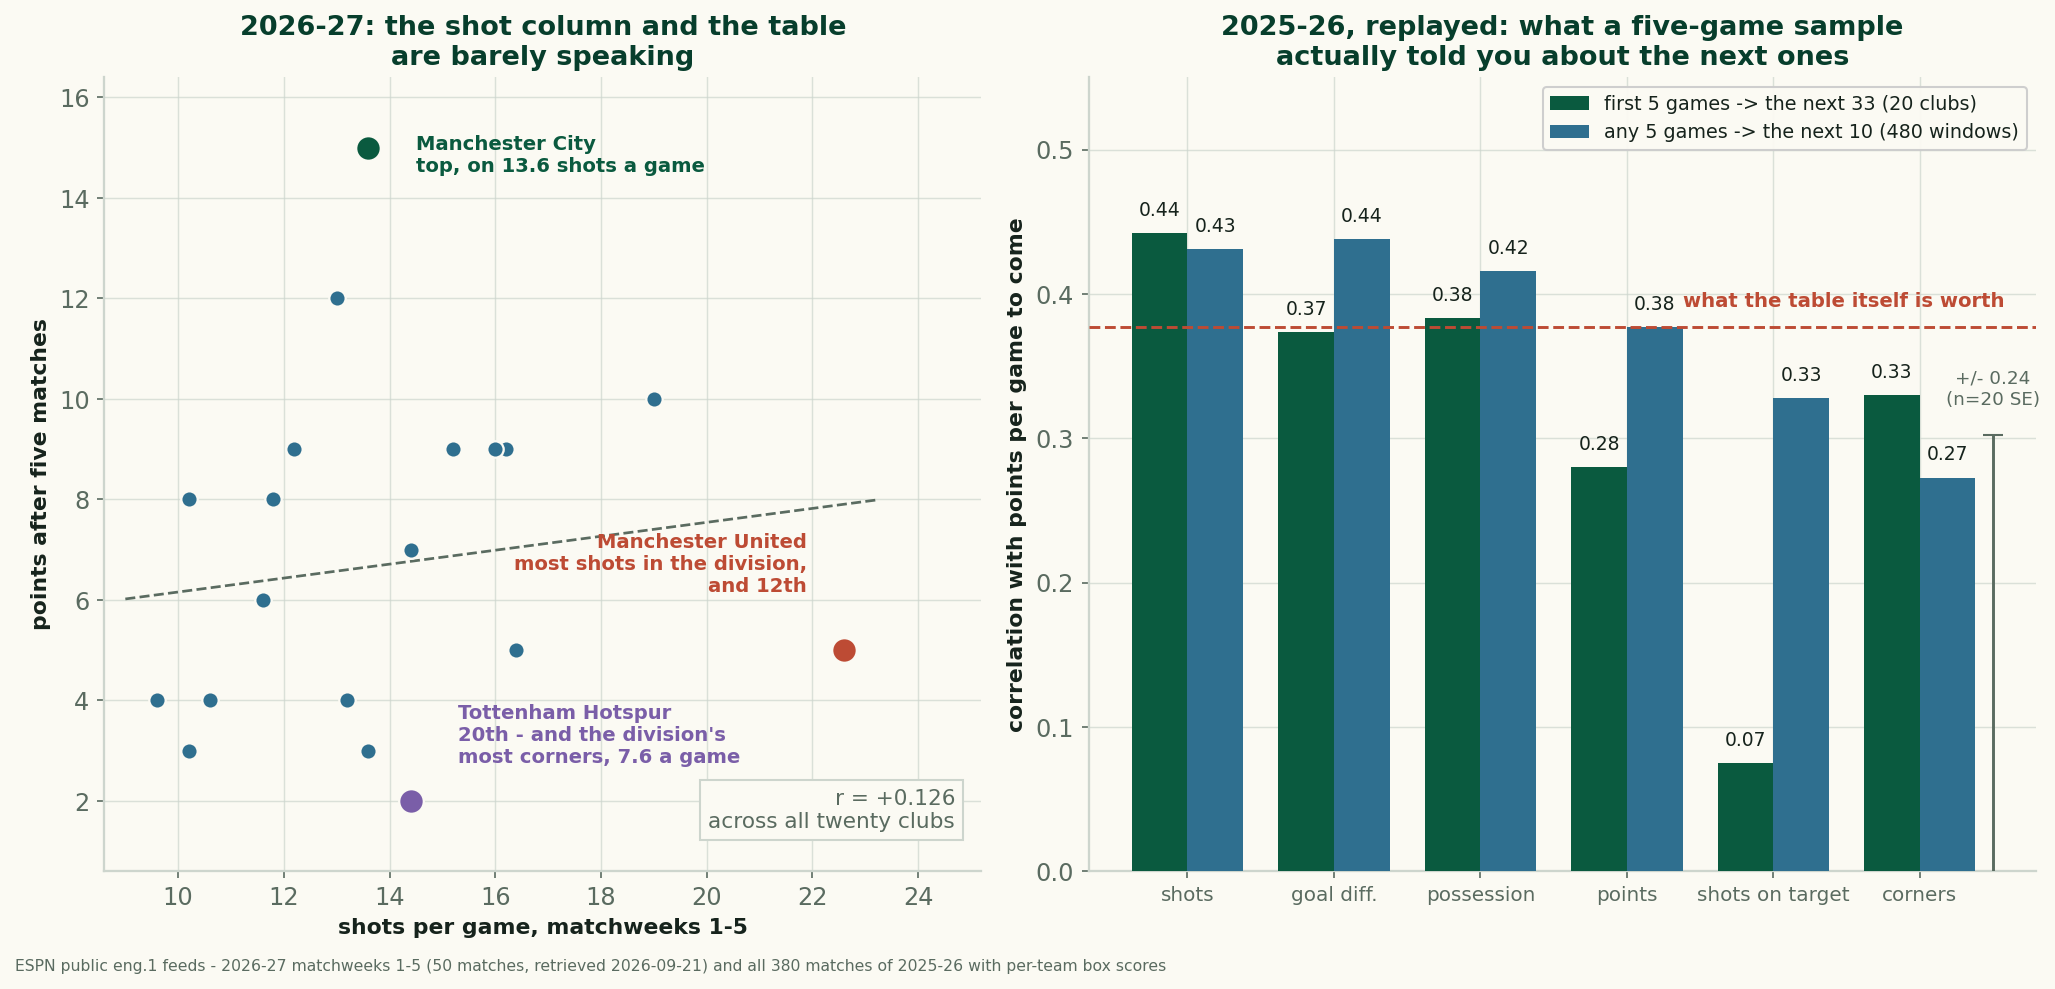
Manchester United Lead the League in Shots and Sit Twelfth
United take 22.6 shots a game and have 5 points. Across 2025-26, a club's five-game shot count predicted its next results better than its points did.
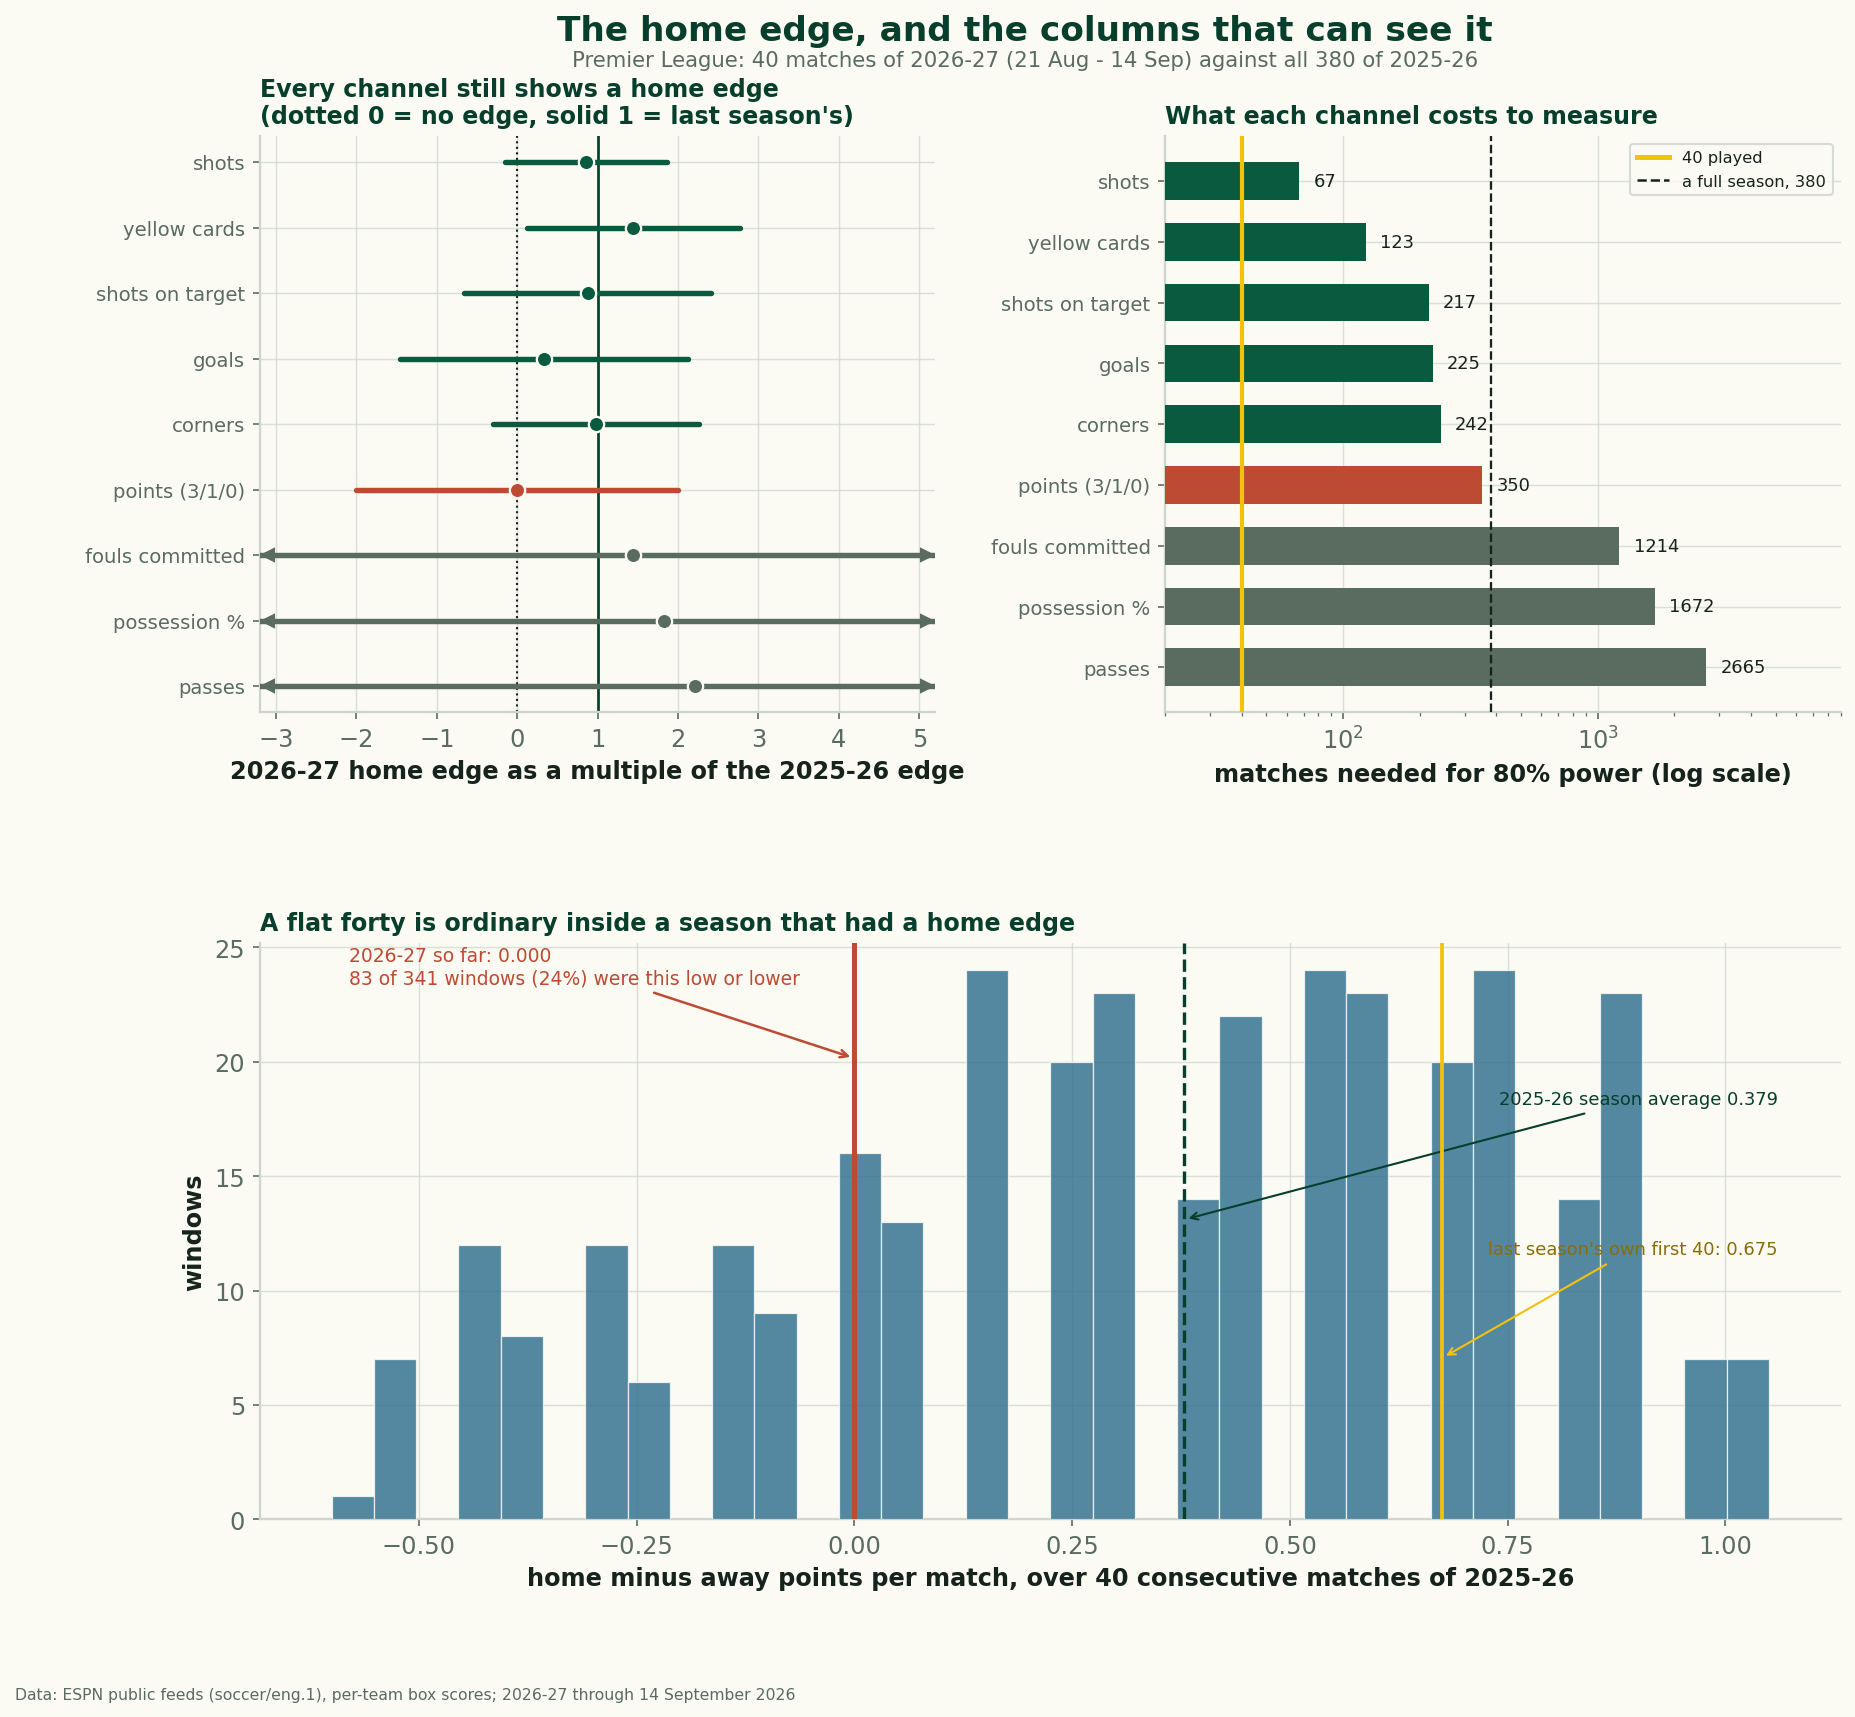
Home Advantage Didn't Die. The Results Column Can't See It
Home and away split the first 40 matches of 2026-27 evenly, yet the shot, corner and card columns keep the home edge. Plus a decade of home-advantage data.