Defensive Actions: Why Tackle and Interception Counts Mislead
The best defenders often make the fewest tackles. Here is why.
There is a quiet paradox at the heart of defensive statistics: the player at the top of the tackles chart is frequently not the best defender on the pitch but one of the worst-positioned. A tackle is a recovery from a situation that, ideally, should never have arisen. The defender who reads the danger early, steps across, and forces the attacker to play backwards registers nothing at all — no tackle, no interception, no entry in the box score. Raw defensive counts reward the cure and ignore the prevention, and that single fact is enough to make most casual readings of them wrong.
What a tackle count actually measures
Start with what has to happen for a tackle to be recorded. An opponent must have the ball, in your zone, in a position dangerous enough that someone has to physically challenge for it. That is already a loaded set of conditions. A defender who is constantly making tackles is, by definition, a defender whose team keeps allowing opponents to carry the ball into challenging positions. Sometimes that is heroism. Just as often it is a symptom — of a high line being run in behind, of a midfield that does not screen, of a full-back repeatedly isolated against a winger.
The same logic applies to interceptions and clearances, with a twist. An interception requires the opponent to attempt a pass into the space you are occupying; a clearance requires the ball to reach your defensive third in the first place. A team that defends deep, invites pressure, and lives on the edge of its own box will rack up interceptions and clearances by the dozen, not because its defenders are exceptional readers of the game but because the ball keeps arriving in their penalty area. Volume here is a story about territory conceded, not quality applied.
None of this means the counts are worthless. It means they are descriptive, not evaluative. They tell you what a defender did and roughly where, but the leap from "made many tackles" to "defends well" is exactly the kind of inference the number cannot support on its own.
The possession problem, again
Layered on top of positioning is a structural bias that affects every defensive metric equally: the amount of the ball your team has. Defensive actions can only happen when the opposition is in possession. A side that controls sixty-five percent of the ball simply hands its defenders far fewer opportunities to tackle, intercept, or block than a side pinned back with thirty-five percent. The low-possession team will always post bigger raw defensive numbers, and almost none of that gap is about defensive ability.
This is the single largest confound in the entire category, and it is correctable. The standard fix is possession-adjustment: scaling each team's raw count to a neutral fifty-fifty baseline so that two sides with wildly different styles can be compared on the same footing. We work through the formula and a full example in possession-adjusted stats; the short version is that before you compare any two teams' defensive volumes, you should ask whether the numbers have been adjusted for how much each side actually had to defend. Unadjusted, a tackle leaderboard is close to a ranking of who saw the least of the ball.
Success rate beats attempts
If the count of attempts is a weak signal, the rate of success inside those attempts is a much stronger one. Tackle success rate — tackles won as a share of tackles attempted — tells you something the raw tally cannot: when this defender does commit to a challenge, how often does it work? A player making six tackles a game at a fifty percent success rate is diving in, getting beaten half the time, and leaving space behind. A player making three tackles a game at eighty percent is picking moments and winning them.
The deeper point is that a low attempt count paired with a high success rate is often the marker of a genuinely good defender. Such a player is not avoiding duels out of timidity; they are positioning so well that the duels they do enter are ones they have already half-won before contact. The metric to be suspicious of is a high volume of attempts, whatever the success rate — it usually means the defender is reacting rather than anticipating.
A tale of two centre-backs
To see how badly the raw count can mislead, consider two fictional centre-backs over a full season. The figures below are invented purely to illustrate the effect and do not describe any real player.
| Metric | Defender A | Defender B |
|---|---|---|
| Tackles + interceptions per 90 | 9.2 | 4.1 |
| Tackle success rate | 54% | 81% |
| Team possession share | 41% | 63% |
| Opponent shots faced per 90 | 15.8 | 8.4 |
Read only the top row and Defender A is more than twice the defender — 9.2 actions to 4.1. Read the rest and the impression inverts. Defender A plays for a low-possession side that is under near-constant pressure (15.8 shots faced) and wins barely half the challenges they commit to. Defender B plays in a dominant team, sees far less of the ball arrive in dangerous areas, and wins four challenges in five when called upon. Defender B's low count is not passivity; it is the residue of a side that rarely lets the ball get that far, defended by someone who, when tested, almost always wins. The raw column flatters the busier, worse-positioned player — exactly as it usually does.
Defensive actions are a location story
The most useful thing about defensive-action data is not how many but where. A tackle won in the opponent's third is a completely different event from a clearance hacked off your own goal line, even though a naive count treats them as one apiece. Mapping where a team wins the ball tells you what kind of defending it is actually doing: a cluster of recoveries high up the pitch signals an aggressive press; a band of actions hugging the edge of the penalty area signals a deep, reactive block.
This is precisely the intuition that pressing metrics formalise. PPDA — passes allowed per defensive action — restricts itself to defensive actions in the opponent's build-up zone for exactly this reason: it is trying to isolate the high, ball-hunting behaviour and strip out the deep-block volume that would otherwise drown it. We unpack the construction in PPDA explained. The lesson carries straight back to individual defenders: the value of a defensive action depends overwhelmingly on the pitch location and game context it happened in, and a leaderboard that collapses location into a single total throws away the most informative dimension it had.
How to read defensive numbers honestly
None of this is an argument for ignoring defensive stats. It is an argument for reading them in the right order. Start by asking how much of the ball the team had, and prefer possession-adjusted figures over raw ones. Then look at success rate before volume, because rate survives the positioning problem that volume does not. Then ask where the actions happened, because a recovery in the final third and a clearance off the line are not the same currency. Only after all three filters does a raw count start to mean what a casual reader assumes it means at first glance.
Done in that order, the numbers genuinely help. They can flag a full-back being targeted, a midfield that has stopped screening, a centre-back whose engagement has quietly dropped after a transfer. Skipped, they will do the opposite — crowning the most over-worked, worst-protected defender in the league as its best, simply because the ball kept finding them and they kept having to react. The tackle is the most visible defensive act and the least informative in isolation. The defender who never has to make one has usually already done the harder work.
Sources & further reading
- Free textbook: Chapter 12: Defensive Metrics and Analysis — the theory behind this, at DataField.dev.
- FBref — tackles, interceptions, clearances and tackle-success splits (via Opta) for the major competitions.
- StatsBomb — documentation on defensive event definitions and the difference between contesting and recovering possession.
- StatsBomb open data — event-level data with locations, for mapping where defensive actions actually happen.
- Understat — season-level data for the major European leagues.
More from Stat Explainers
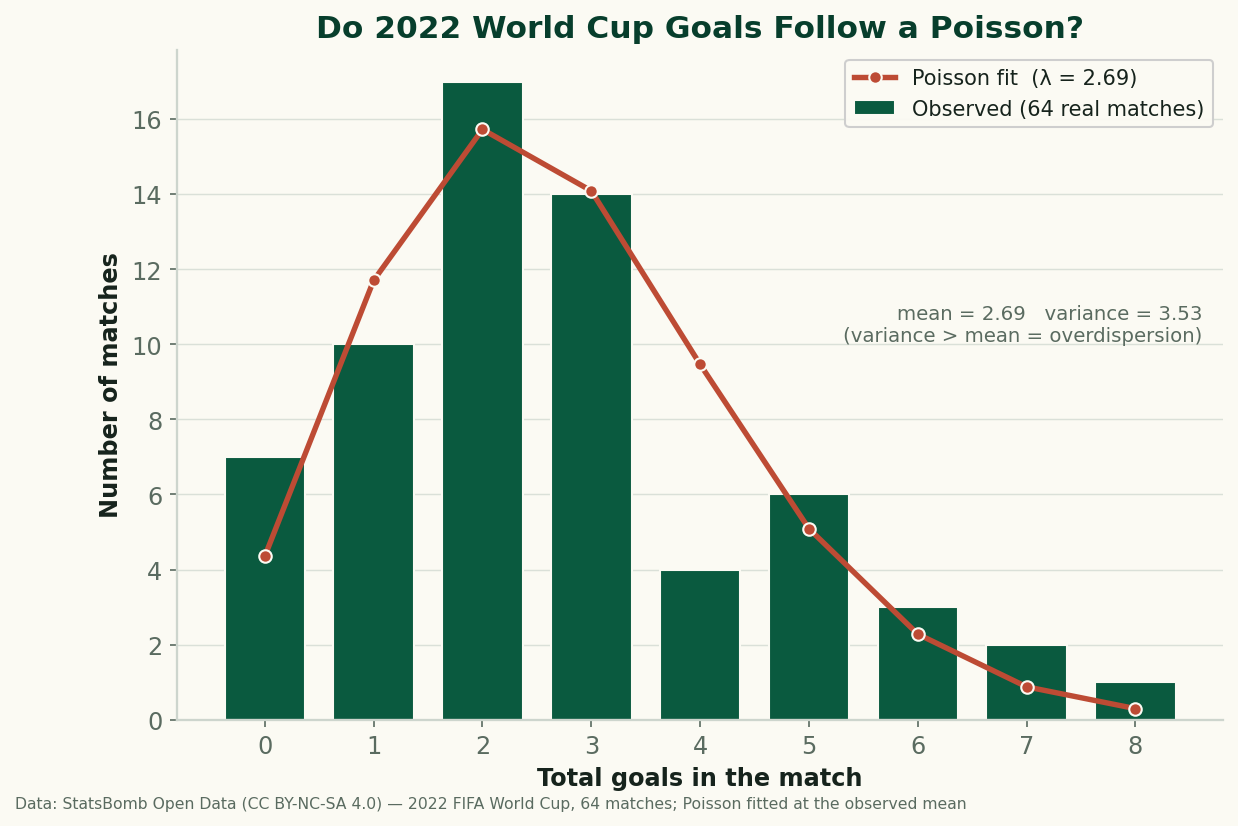
Do Football Goals Follow a Poisson? Testing the Standard Model on All 64 Games of 2022
Every scoreline prediction in football rests on the Poisson distribution. So I fit it to all 64 real matches of the 2022 World Cup and checked the residuals — it gets the shape right and fails in one specific, informative way: real goals are overdispersed. Here's why, with the formula and the code.
Aerial Duels and Heading Data: Reading Win Rate Without Getting Fooled by Volume
Aerial-duel win percentage, why raw counts mislead, where aerial dominance actually matters — set pieces, target men, defending crosses — and how to read heading data without confusing volume for quality.
Expected Points (xPts): Turning Shot-Level xG Into a Fairer Table
Expected points (xPts) simulates a match from its shot-level xG to get win, draw and loss probabilities, then a points total that rewards the chances a team created rather than the goals that happened to go in. How it is computed and what it reveals against the real table.