SCA and GCA Explained: Crediting the Two Moves Before a Shot
Why assists undercount creators, and how SCA and GCA widen the credit.
A winger drops a shoulder, beats his man, and slides a pass to the eight. The eight takes a touch and threads it to the striker, who scores. The striker gets the goal; the eight gets the assist; the winger — whose dribble pulled the whole defence out of shape — gets nothing. Shot-creating and goal-creating actions exist to fix exactly that kind of accounting, by paying not just the player who made the assist, but the player who made the pass before it.
What SCA and GCA actually count
Shot-creating actions (SCA) and goal-creating actions (GCA) are a pair of metrics popularised through the public-analytics ecosystem — you will most often meet them on FBref, built on StatsBomb’s detailed event data. The idea is disarmingly literal. Take any shot. Now look at the two offensive actions immediately before it by the attacking team. Each of those two actions earns its player one shot-creating action. If the shot becomes a goal, the same two actions instead earn a goal-creating action.
The key word is two. Conventional credit stops at the assist — the single pass that set up the shot. SCA and GCA reach one step further back, to the action before the assist. That second action is where ball-carriers, line-breaking passers, and the players who win free-kicks finally show up in the box score.
The qualifying actions are a small, fixed menu. An action counts toward SCA or GCA if it is one of the following, and it is the last or second-last team action before the shot:
- A live-ball pass — a pass in open play that helps create the shot.
- A dead-ball pass — a pass from a set-piece such as a free-kick or corner.
- A dribble (take-on) — beating a defender to carry the move forward.
- A drawn foul — being fouled in a way that leads to the shot, including winning the free-kick that is then delivered.
- A defensive action — a tackle or interception that wins the ball back and begins the move.
- The shot itself in the rebound case — a shot whose rebound or block leads directly to another shot.
A move, broken down (illustrative)
Numbers make this concrete, so here is a deliberately simple, made-up sequence — chosen to show the mechanics, not drawn from any real match.
Imagine a four-touch move. A full-back wins the ball with a tackle. He plays it to a winger. The winger beats his marker with a dribble and passes inside to the striker, who shoots and scores. Four players acted: the full-back (tackle), the winger (dribble), and a pass in between, ending with the striker’s shot.
The two actions directly before the shot were the winger’s pass (the assist) and, before it, the winger’s dribble. Both earn one SCA — and because the shot was scored, both earn one GCA.
The full-back’s tackle began the move but sits three actions back, so it earns nothing here. SCA and GCA only ever look two deep.
That example also exposes the metric’s defining limit, which we’ll return to: it credits the winger twice for one move and the full-back not at all, purely because of where each action fell in the count.
Why this widens the credit beyond the assist
The reason analysts reach for SCA is that the assist is a famously blunt instrument. It rewards one pass and ignores the action that made that pass possible — the carry that broke the lines, the dribble that committed a defender, the dead-ball delivery that fell to the assister. Across a season, two very different players can have near-identical assist totals while doing completely different jobs: one finishing moves with the final ball, the other repeatedly supplying the player who supplies the finish.
SCA pulls those two roles apart. A deep creator or a dribbling wide player who consistently makes the penultimate action will accumulate a high SCA total even with a modest assist count, because they are involved in the build-up of chances whether or not they make the final pass. It is the difference between asking “who set up the shot?” and “who were the last two players to move the ball toward this shot?” The second question has two answers, and that is the whole point.
Reading it per 90, and its place among creative metrics
Raw SCA and GCA totals are volume figures, so they reward minutes and they reward playing in a team that takes lots of shots. The standard fix is the same as for most event metrics: divide by minutes and quote them per 90. SCA per 90 tells you how often a player is one of the last two contributors to a shot in a typical match; GCA per 90 does the same for goals, but because goals are far rarer than shots, GCA per 90 is a small and noisy number over short samples — closer to a sanity check on SCA than a standalone leaderboard.
It helps to place SCA and GCA next to the creative metrics they complement rather than replace. Expected assists (xA) values the quality of the chance a player creates — the xG of the resulting shot — but only for the single creating pass. SCA values the act of creation for the last two players, but treats every shot as one unit regardless of how good the chance was. And xGChain and xGBuildup go to the opposite extreme, crediting every player in a possession with the full xG of the shot it produced, no matter how many actions back they were.
Read together, the three answer different questions. xA asks how dangerous your creation was; xGChain asks whether you were involved at all; SCA and GCA sit in between, asking whether you were one of the final two hands on the ball. A scout looking at a wide player would want all three: high SCA tells you they are repeatedly near the end of moves, xA tells you whether the chances they help make are any good, and xGChain tells you whether they matter to the build-up beyond those last two touches.
The caveats worth keeping
SCA and GCA are useful precisely because they are simple, and most of their problems are the flip side of that simplicity. First, the hard two-action cut-off is arbitrary: it credits the assist and the pass before it, but a brilliant third-action carry that set the whole move in motion gets nothing, while a trivial square pass that happens to fall in the last-two window gets full credit. The metric measures position in the sequence, not value.
Second, both are volume- and team-dependent. A player in a side that takes twenty shots a game has far more chances to register SCA than the same player in a side that takes eight, so cross-team comparisons need care and per-90 framing at a minimum. Third, GCA inherits all the noise of goals themselves — it depends on finishing, which the creating player does not control, so a low GCA next to a high SCA usually says more about teammates’ conversion than about the creator.
The honest way to use them, as with most of these numbers, is as a lens rather than a verdict. SCA and GCA do one valuable thing well: they drag the penultimate action into the light, and with it the players who quietly make chances without ever making the assist.
Sources, notes & further reading
- FBref — SCA and GCA leaderboards and definitions, with the action breakdown by type.
- StatsBomb — the event-data model the creating-action metrics are built on.
- Understat — xG, xA and possession-credit tables for the major European leagues.
- The Analyst — explainers on chance creation and advanced attacking metrics.
Expected assists and expected threat
This section was first published on 14 May 2026 as a separate article.
Here is the problem with the assist as a statistic: it credits the wrong skill to the wrong player. Thread a defence-splitting pass to a striker who is clean through, watch him blaze it over the bar, and you get nothing on the scoresheet. Roll a lazy square ball to a teammate who taps into an empty net from six yards, and you get an assist — officially the identical creative contribution. An assist isn't really a measure of creativity at all; it is an accounting of other people's finishing, filed under your name. Expected assists (xA) and expected threat (xT) are the two metrics that try to fix that, and they fix it in different ways.
What expected assists actually measure
xA attaches the xG of the resulting shot to the player who created it, rather than to whether the ball happened to go in. The mechanic is almost insultingly simple, and that simplicity is the point: for every pass a player makes that leads directly to a shot, they bank the shot's xG value as credit. Sum those across any time period and you have their xA.
That means a player who consistently finds teammates in the penalty area with good looks at goal will accumulate high xA whether or not those teammates convert. The finisher's luck — or skill — is stripped out. A through-ball that sets up a 0.4 xG shot from the penalty spot counts as 0.4 xA, always, regardless of what happens next.
The contrast with assists is pointed. The most common ways raw assists inflate the wrong player: tap-ins where the "assist" was a routine corner; set-piece deliveries where the scorer did all the work with their head; deflected crosses that bobbled in off a defender. And the ways assists undercount real creators: the player who generated twelve 0.4 xG shots whose strikers missed every one, or the playmaker who was dispossessed the moment before a teammate scored and so appears on no record at all.
The 2022 World Cup xA leaders
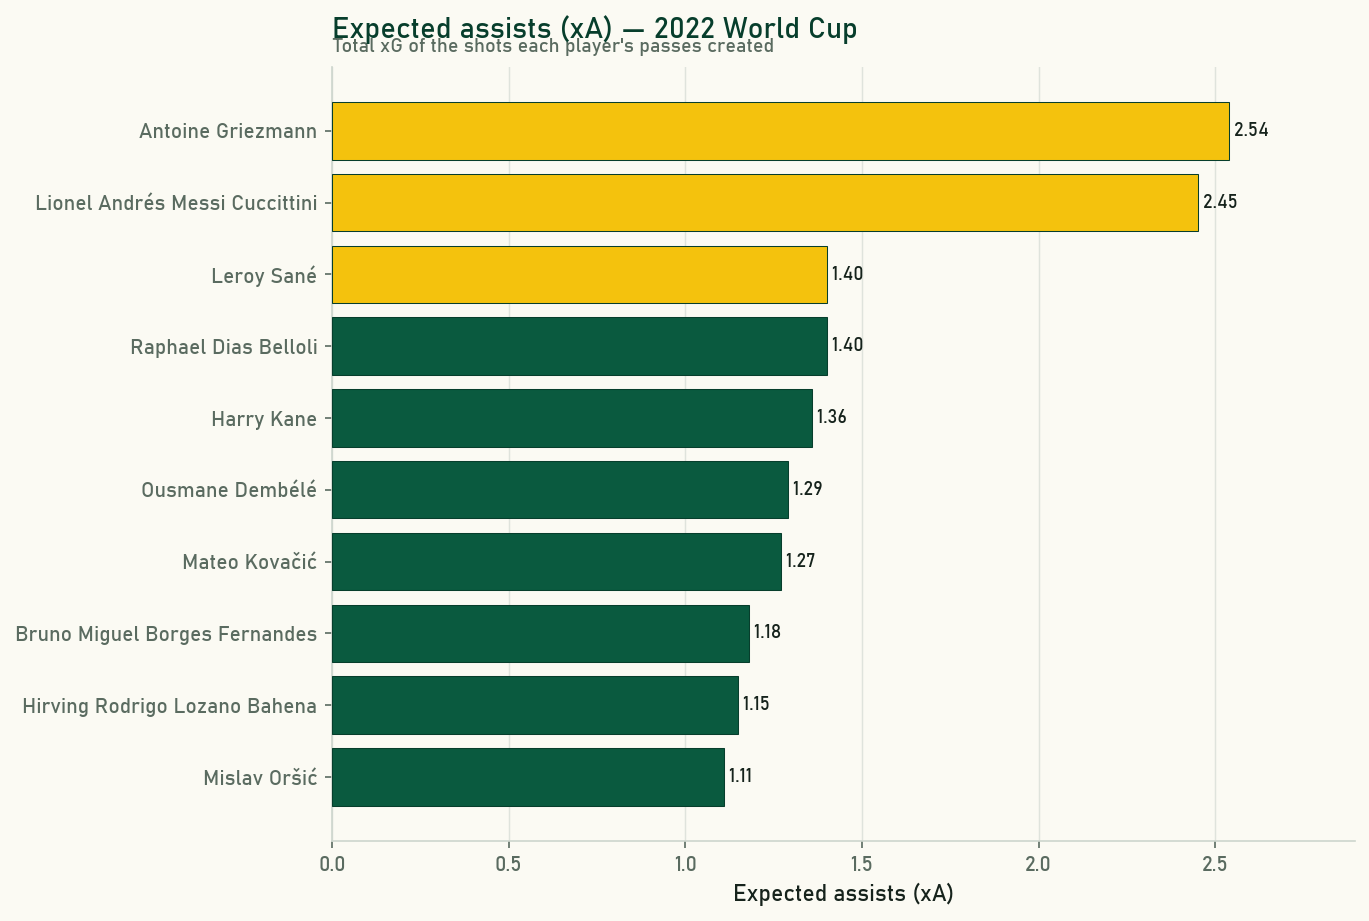
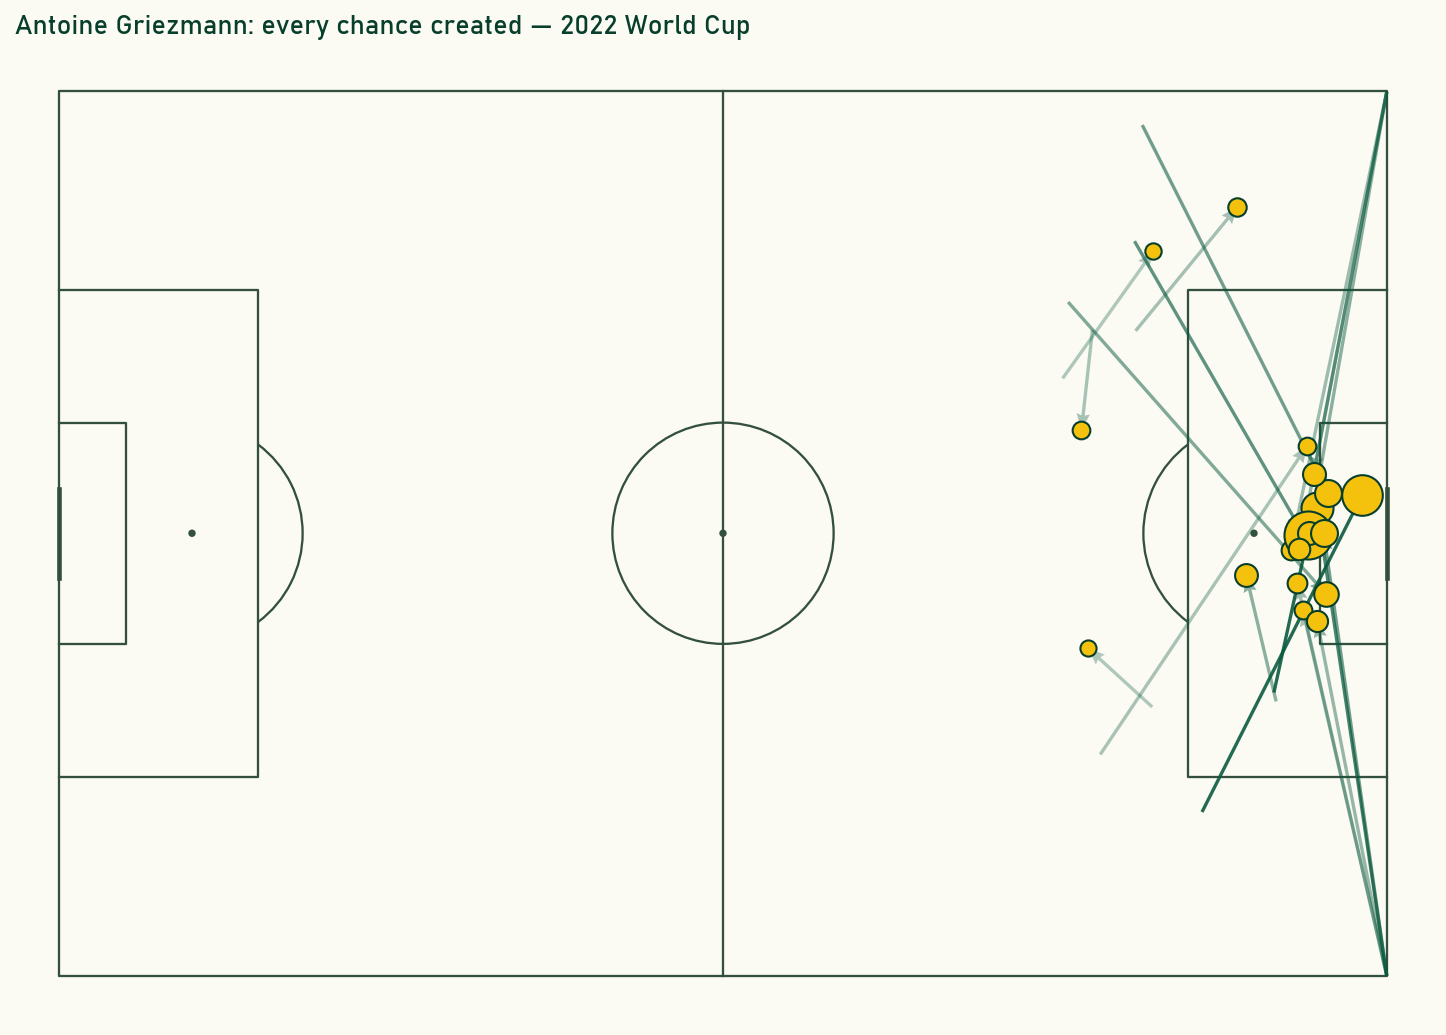
The 2022 World Cup across 64 matches provides a clean sample with every chance built from StatsBomb's detailed event data. The xA leader was Antoine Griezmann — and he is probably not the first name that comes to mind when you think "World Cup creative force." He ended up with 2.54 xA, edging Lionel Messi at 2.45. Both numbers capture something the raw assist counts buried entirely.
| Player | xA |
|---|---|
| Antoine Griezmann | 2.54 |
| Lionel Andrés Messi Cuccittini | 2.45 |
| Leroy Sané | 1.40 |
| Raphael Dias Belloli (Raphinha) | 1.40 |
| Harry Kane | 1.36 |
| Ousmane Dembélé | 1.29 |
| Mateo Kovačić | 1.27 |
| Bruno Miguel Borges Fernandes | 1.18 |
| Hirving Rodrigo Lozano Bahena | 1.15 |
| Mislav Oršić | 1.11 |
Griezmann leading that list is not a surprise to anyone who watched France closely. He spent much of the tournament operating in the half-spaces as a second striker, dropping deep to collect and then picking out runners. Most of that creation never made the assist column because French strikers spurned the chances. xA saw it anyway.
The limit xA runs into
xA is a significant improvement on raw assists, but it inherits one structural flaw: it only credits the player if their action directly preceded a shot. That last pass gets everything; the one before it gets nothing. Think about the midfielder who plays a quick turn-and-release out of pressure to an overlapping fullback, who then delivers the cross — the midfielder's contribution vanishes from the xA record. And an entire category of creative action is invisible to xA: carrying the ball through midfield, switching the play to open up the width, drawing defenders to create pockets for others. A box-to-box runner who breaks defensive lines with carries every other game and never touches the ball at the point of the shot simply doesn't exist in xA's world.
That is the gap expected threat was designed to fill.
Expected threat: valuing every action on the pitch
Expected threat (xT) is a possession-value model built around a simple question: given that a player has the ball in zone X, what is the probability that the team scores within the next few actions? The model assigns each point on the pitch a number between 0 and 1 that represents that probability. Any pass or carry that moves the ball from a lower-value zone to a higher-value zone gets credited with the difference. Any action that moves the ball backward — or gives it away — incurs a cost.
The intuition lands immediately. The areas near the opposing goal are worth a lot; deep in your own half, almost nothing. Nobody is going to argue with that. What xT makes rigorous is every gradient in between — the half-space outside the penalty area is more valuable than the same distance from goal directly down the wing, because the angle to shoot is better and defenders are split. The model learns those gradients from data, not from anyone's opinion.
Divide the pitch into, say, 192 cells (16 columns × 12 rows). For each cell, estimate two probabilities from historical data: pshoot — how often a team with the ball here takes a shot within the next three actions — and pgoal | shot — how often those shots become goals. The cell's xT value is pshoot × pgoal | shot, plus a weighted sum over every zone the ball could move to next (a pass or carry), capturing the downstream value. Solve the system of equations and you get a value map. A pass from deep midfield to the edge of the penalty box might raise the ball from an xT of 0.04 to 0.13, crediting the passer with 0.09 xT.
A worked example
Suppose a central midfielder on the halfway line — xT roughly 0.02 — plays a precise diagonal to a winger at the corner of the penalty area, where the xT value is approximately 0.10. That single pass earns the midfielder 0.08 xT. The winger then cuts inside to the penalty spot, a carry from xT 0.10 to maybe 0.20, earning 0.10 xT. The winger shoots — at that point, the shot is handled by the xG model rather than xT — and misses. Under xA, neither player gets anything. Under xT, the midfielder's diagonal and the winger's carry are both credited, capturing the genuine value they added to the attacking move. The miss is the striker's problem, not theirs.
That is the philosophical difference. xT is a model of progression; xA is a model of shot creation. They measure different things, and the most complete picture of a creator uses both.
Reading xA and xT together
A player who leads in xA almost certainly creates high-quality shots directly. A player who leads in xT might be driving dangerous ball progressions that end in shots for others — a deep-lying playmaker or an advancing fullback whose involvement is always three passes before the chance. High xT with modest xA is the signature of a player who shifts the structure of an attack rather than making the final key pass. High xA with modest xT could be an efficient final-third operator who contributes less to the build-up.
Neither stat is a verdict on a player's total value, and treating them that way is a mistake. xT can be gamed somewhat — if a player only ever receives the ball in high-value zones, their carry xT looks impressive for fairly modest effort. And xA, like xG, is noisy in small samples: a player can rack up 1.5 xA in one game and nothing across the next four. Both metrics stabilise with larger samples, and both are most useful as a diagnostic rather than a single-number ranking.
The old assist column told you who touched the ball last before a goal. xA and xT together tell you who made dangerous things happen and at what stage — irrespective of what a keeper or striker did about it. That is a truer account of creativity.
Sources, notes & further reading
- StatsBomb open data — match events including shot xG and key-pass links used to derive the xA figures here.
- StatsBomb — documentation on their event model and possession-value research.
- Karun Singh's blog — the original public description of the xT framework.
- FBref — xA and progressive passing data for domestic leagues.
- Understat — xA and xG breakdowns for top European leagues.
More from Stat Explainers
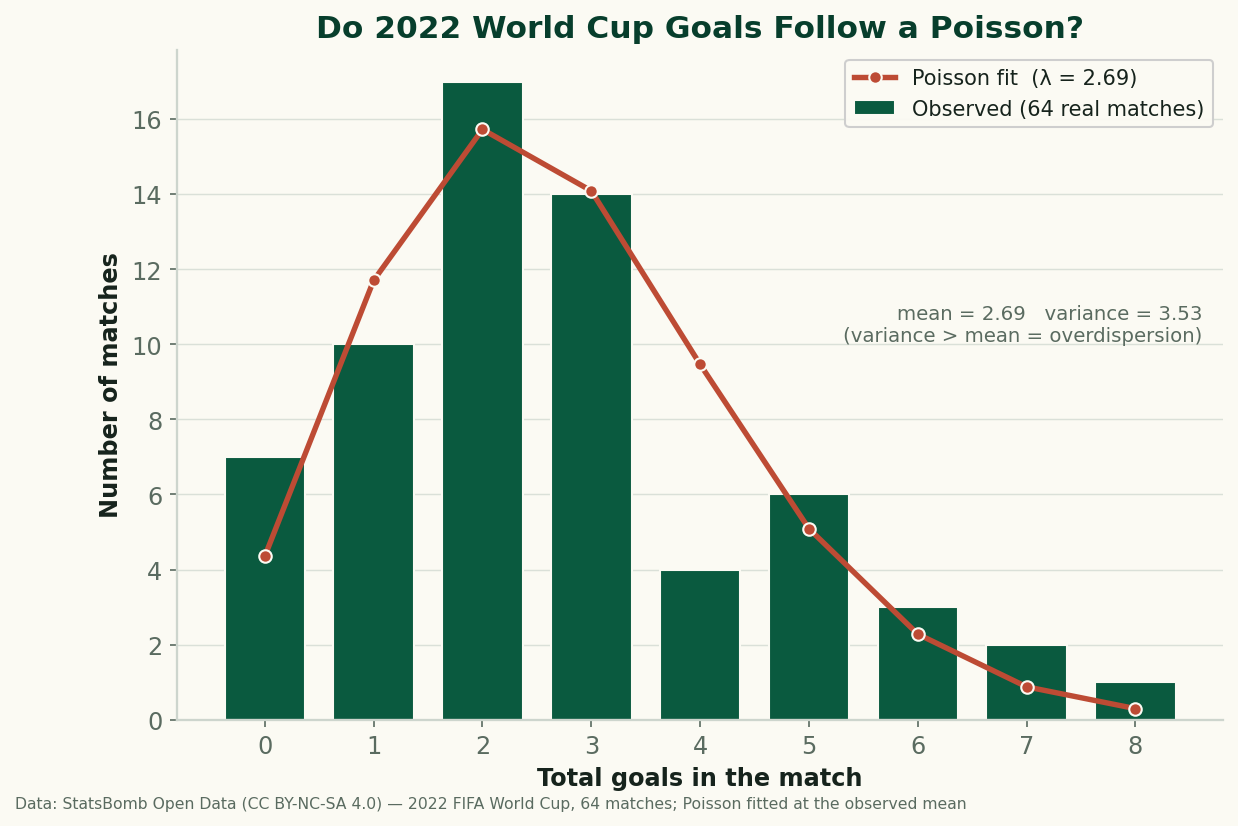
Do Football Goals Follow a Poisson? Testing the Standard Model on All 64 Games of 2022
Every scoreline prediction in football rests on the Poisson. We fit it to all 64 games of 2022 — it gets the shape right, but real goals are overdispersed.
Aerial Duels and Heading Data: Reading Win Rate Without Getting Fooled by Volume
Aerial-duel win percentage, why raw counts mislead, and where aerial dominance actually matters — set pieces, target men, and defending crosses.
Expected Points (xPts): Turning Shot-Level xG Into a Fairer Table
Expected points (xPts) simulates a match from its shot-level xG to get win, draw and loss odds — points that reward chances created, not goals that went in.