When World Cup Goals Are Scored: The Timing of 2022's 152 Goals
The second half outscored the first 91 to 58. Goals build toward halftime, and stoppage time punches far above its weight. A minute-by-minute map.
A football match isn't 90 uniform minutes — goals arrive in a distinct rhythm, and knowing it changes how you watch. Take every goal from all 64 matches of the 2022 World Cup, strip out the penalties, and sort the remaining 149 in-regulation goals by when they were scored. The clock tells a clear story: the second half produced 61% of the goals to the first half's 39%, the single busiest phase is the stretch right before halftime, and stoppage time is the most productive real estate on the pitch for the few minutes it gets. The scoreboard moves most when legs tire, substitutes arrive, and the game opens up.
Sourcing. Every figure is computed from StatsBomb's free, public 2022 World Cup data — all 64 matches, each goal tagged with its period and minute. Penalties are excluded throughout (they're awarded in an instant rather than built up to, so they'd smear the timing). Nothing is from memory or invented.
The exhibit: goals by 15-minute phase
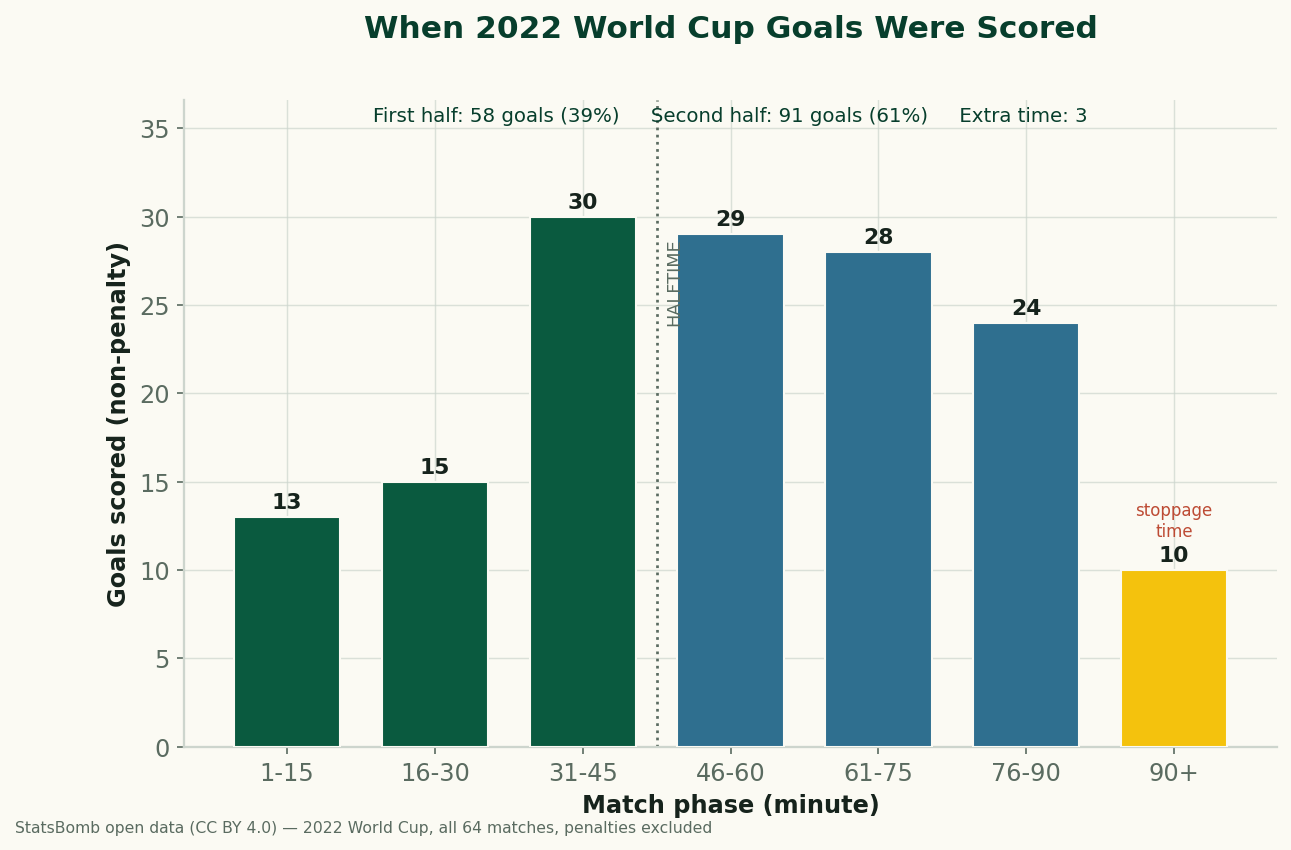
Read it left to right. The opening quarter-hour is the quietest stretch of the match — just 13 goals — as teams feel each other out. Scoring then climbs steadily to a first-half peak of 30 goals in the 31–45 window, the busiest single phase of the whole match. After the break the second half opens hot (29 in the 46–60 window) and stays busier than the first half throughout, before 10 more arrive in second-half stoppage time alone.
The second-half tilt
The headline split is stark: 91 second-half goals to 58 in the first. That's not noise — it's a structural feature of football, and it has clear causes. Legs tire, so defensive concentration and physical recovery both fade in the closing half-hour. Substitutes inject fresh attacking legs against tiring defenders. And the game state matters: by the second half, a team that's behind has to chase, abandoning caution and opening the game up for goals at both ends. The first half is where teams protect what they have; the second is where the game cracks open.
Why stoppage time punches above its weight
Ten goals in second-half stoppage looks modest next to the 24–30 in the full 15-minute phases — until you account for how little stoppage time there is. A typical second half gets perhaps 5–8 added minutes, so per minute on the clock, stoppage time is among the most productive of the match. The reasons compound everything above: it's the most desperate phase, with a losing team throwing numbers forward, a winning team sometimes sitting too deep, and exhausted defenders making mistakes. The cliche that “the game's never over until the whistle” is, in goals-per-minute terms, simply true.
A worked example: watching the clock
Suppose you tune into a tied World Cup match at the hour mark. From here the data says you're entering the goal-rich part of the game: the 61–75 and 76–90 windows together produced 52 goals, and that's before stoppage. If the game is still level late, the probability of a decisive goal is rising, not falling — the opposite of the intuition that a tight game is “settling for a draw.” Conversely, the goalless tension of the opening 15 minutes is the norm, not a sign of a dull match. The clock should calibrate your expectations: early quiet is ordinary; late drama is the base rate.
The honest caveats
- This is 2022, one tournament. The second-half tilt and late-goal pattern are well-documented across competitions, but the exact phase counts belong to these 64 matches and will vary tournament to tournament.
- Stoppage minutes are uneven. We bucket all second-half added time into one bar; the actual minutes of stoppage vary by match, so the “per minute” productivity is an estimate, not an exact rate.
- Penalties and extra time are set aside. Penalties are excluded (they'd distort timing), and only three non-penalty goals came in extra time, too few to chart — so this is a regulation-time picture.
- Goal timing isn't goal value. A 5th-minute goal and a 90th-minute goal count the same here, even though their effect on win probability is wildly different — that's the territory of live win-probability models, not a timing histogram.
The takeaway
The clock is not a neutral backdrop — it shapes when goals happen. At the 2022 World Cup the second half outscored the first by half again, scoring built toward each halftime, and stoppage time delivered far more than its handful of minutes should. For a viewer, the lesson is patience early and attention late: the quiet opening is the base rate, and the closing stages are when the tournament is most likely to turn. For where those goals come from on the pitch, see where World Cup goals are scored from, and for who finished their chances, who beat their xG.
Reproduce it
From data_layer/wc2022_shots.json, drop penalties, then bin each goal by its period and minute into 15-minute phases (period 1 for the first half, period 2 for the second, with a separate 90+ stoppage bucket). The chart is drawn by charts/chart_wc2022_goal_timing.py. No network at build time, nothing hand-entered.
Sources & further reading
- Free textbook: Chapter 5: Introduction to Soccer Metrics — the theory behind this, at DataField.dev.
- Goal data: StatsBomb open data (CC BY 4.0), FIFA World Cup 2022, all 64 matches, bundled as
data_layer/wc2022_shots.json. Data provided by StatsBomb. - Companion: where goals are scored from · who beat their xG.
- More: extra time and late goals · the World Cup analysis & prediction hub.
More from Data Deep-Dives
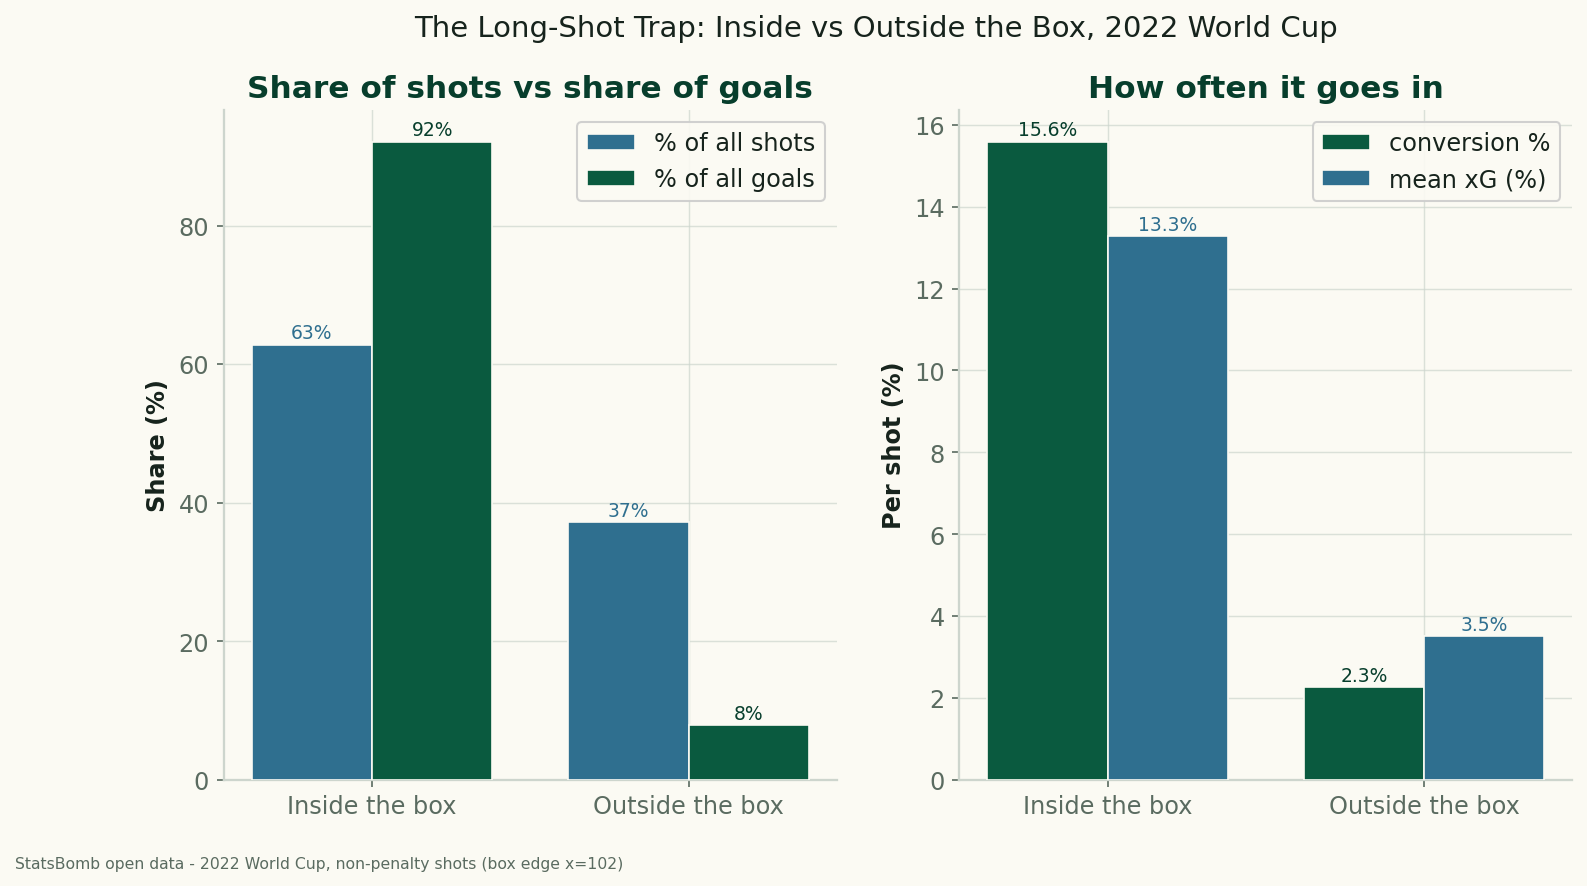
The Long-Shot Trap: Inside vs Outside the Box at the 2022 World Cup
Using StatsBomb data for all 64 matches of the 2022 World Cup, shots from outside the penalty box were 37% of all attempts but produced just 8% of the goals — a 2.3% conversion rate against 15.6% from inside. The data behind 'stop shooting from there.'
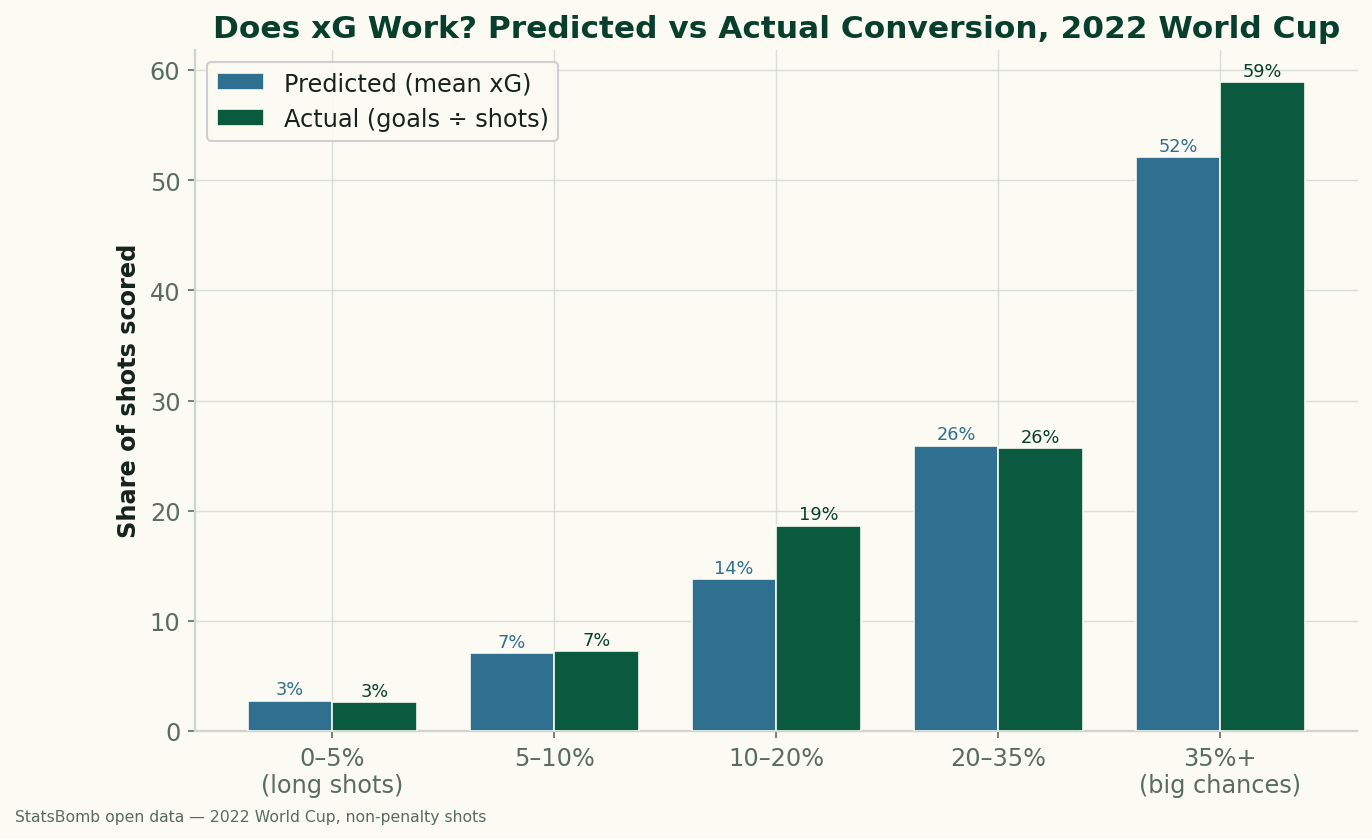
Does xG Actually Work? Big Chances vs Long Shots at the 2022 World Cup
We sorted every non-penalty shot from the 2022 World Cup by its expected-goals value and checked how often each band actually went in. xG holds up well: a 0–5% shot scored 2.6% of the time, a 'big chance' of 35%+ went in 58.9%. The calibration, and what a big chance is really worth.
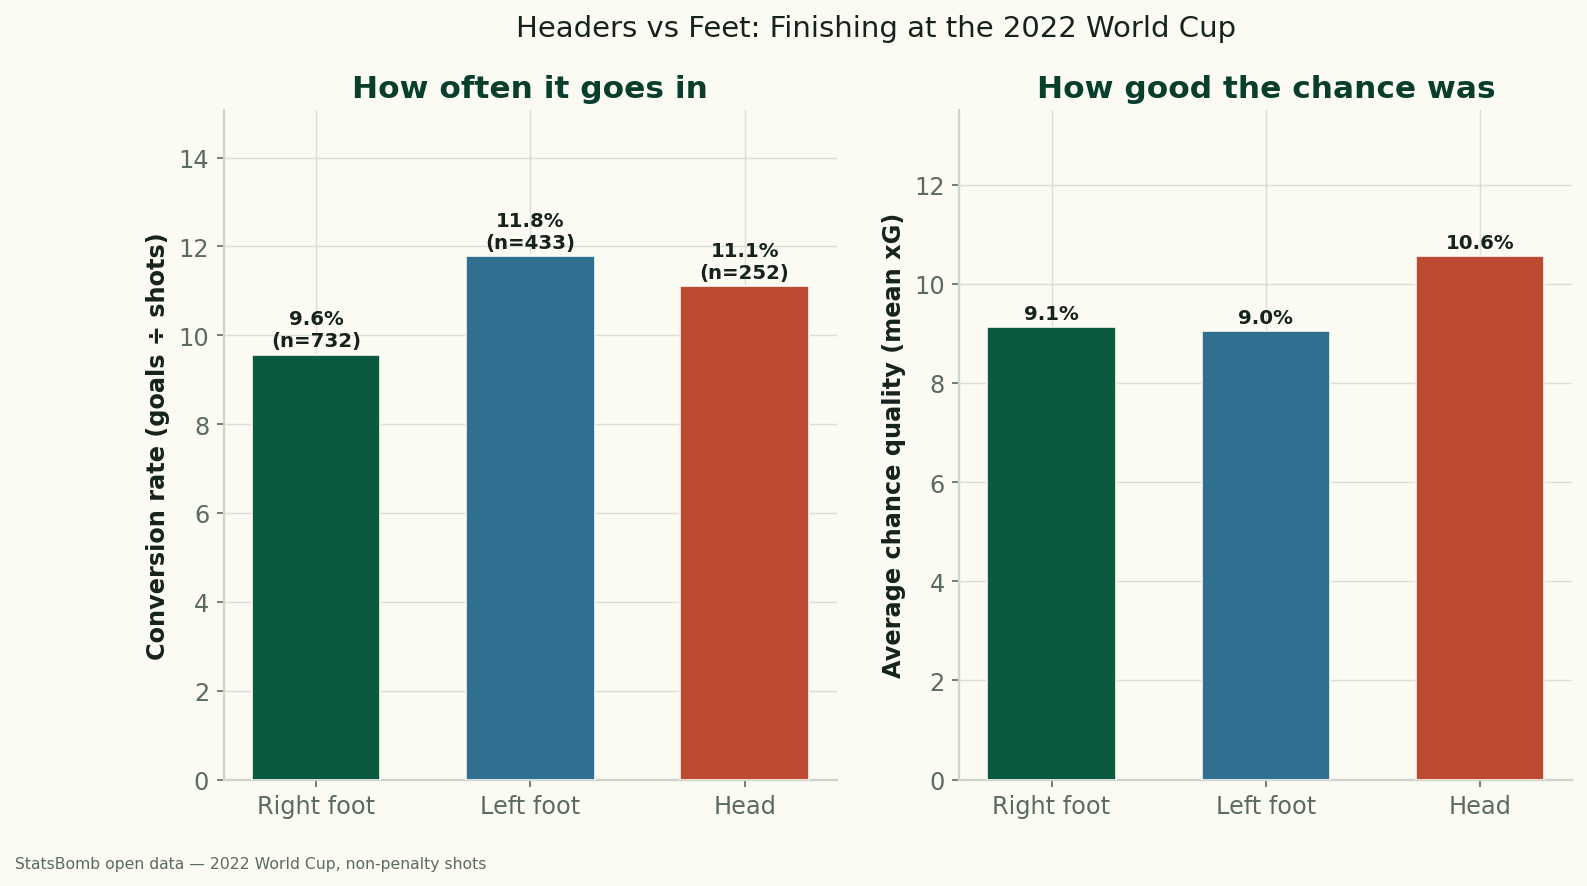
Headers vs. Feet: Which World Cup Shots Actually Go In?
Using StatsBomb data for all 64 matches of the 2022 World Cup, headers and feet convert at almost the same rate (11.1% vs 10.5%) — but only because headers come from higher-quality positions. Relative to chance quality, foot finishing beat the model, and the left foot was the most clinical of all.