Where World Cup Shots Are Taken vs. Where Goals Are Scored From
Map 1,430 shots against the 152 goals they produced and the lesson is stark — attempts come from everywhere, goals come from almost one place.
Footballers shoot from everywhere. They score from almost one place. Take every shot from all 64 matches of the 2022 World Cup, strip out the penalties, and you have 1,430 attempts that produced 152 goals — a 10.6% conversion rate. But that single number hides the most important fact about shooting: where the shot came from decides almost everything. Plot the attempts on one pitch and the goals on another and the two pictures barely look like the same sport. Attempts fan out across the whole final third, plenty of them from distance and from tight angles. Goals shrink into a small central rectangle a few yards from the line.
Sourcing. Every figure here is computed from StatsBomb's free, public event data for the 2022 World Cup — all 64 matches, the real recorded (x, y) location of every shot. Penalties (both in-game and shootout) are excluded throughout: they're taken from a fixed spot and would smear the geography. Nothing is from memory or invented.
The exhibit: two pitches, one lesson
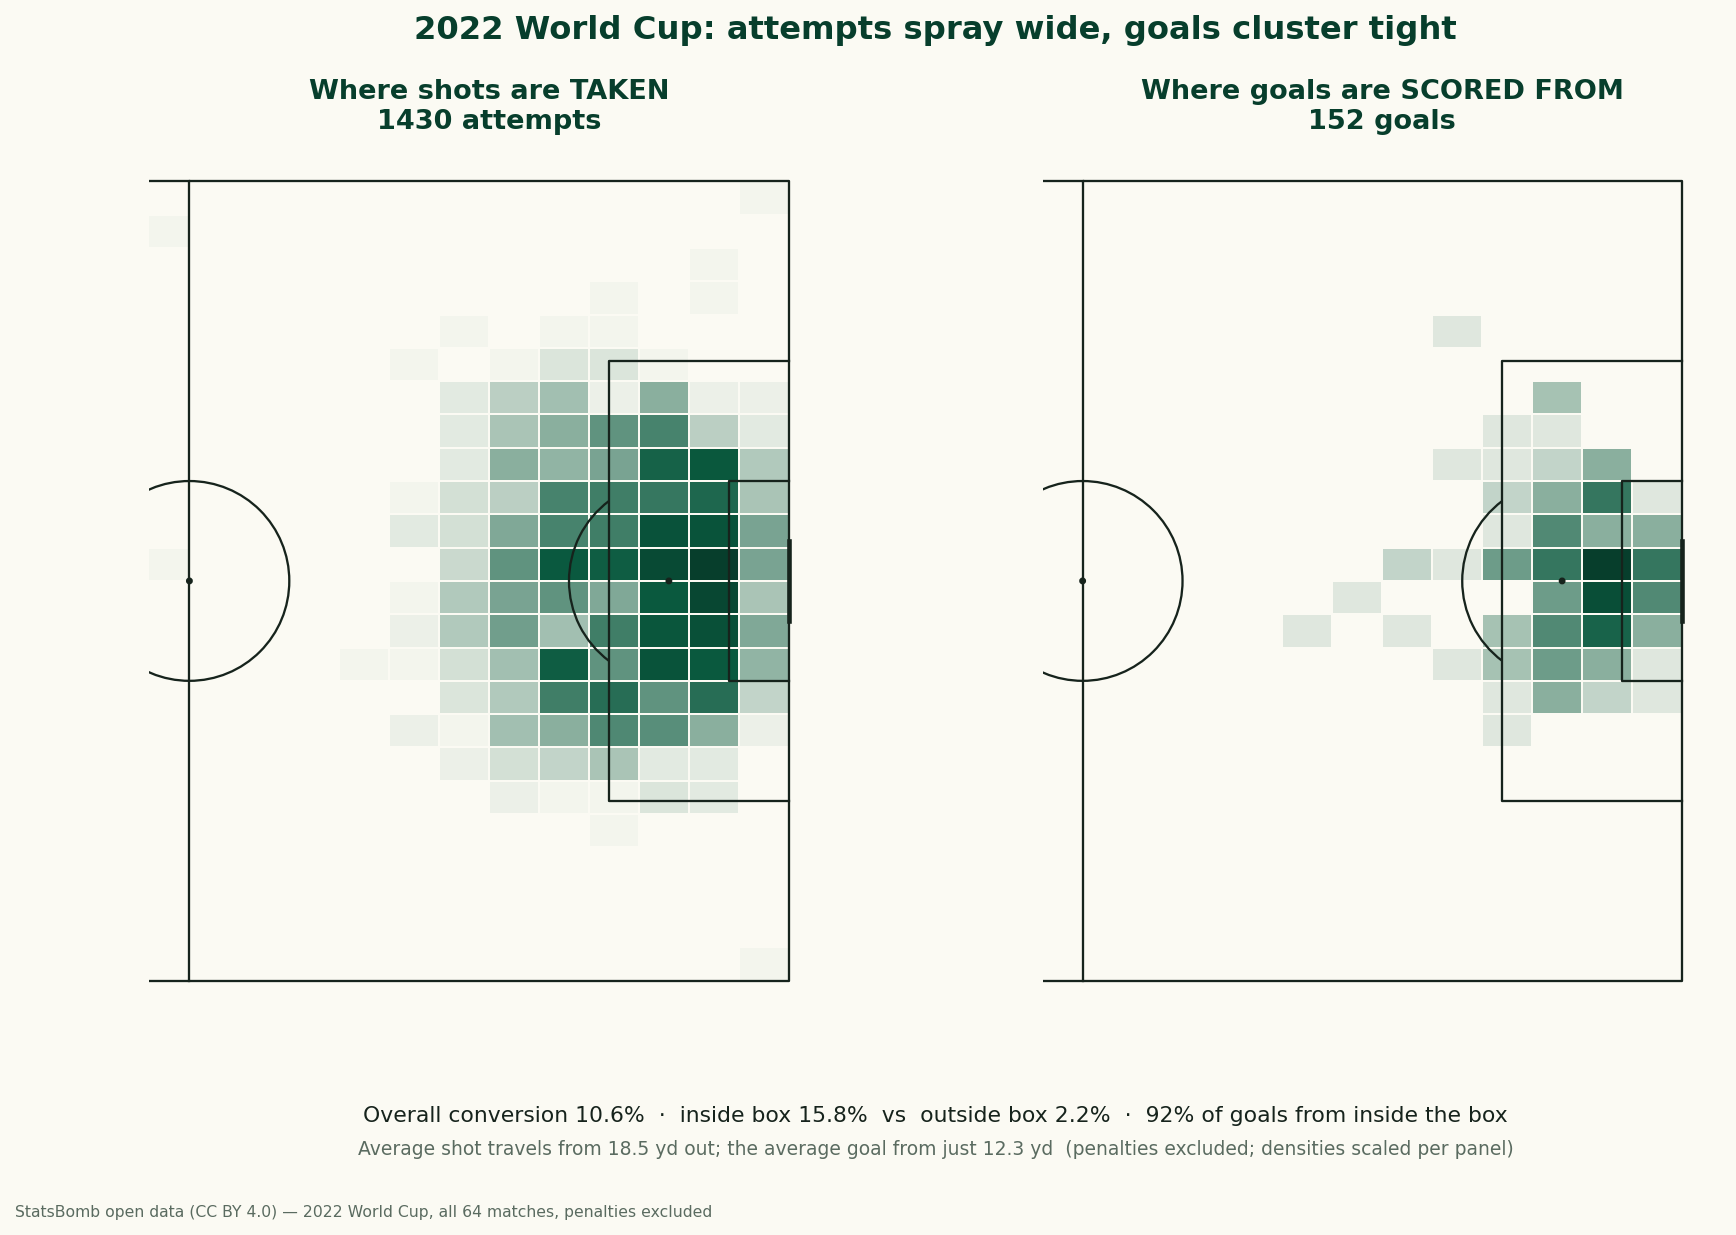
The left panel is a cloud. It bulges toward the penalty spot but spills well outside the box, into the 20- and 25-yard zones and out to the wide channels — all the hopeful efforts, the half-chances, the speculative drives. The right panel is a knot. The goals concentrate in the central corridor between the penalty spot and the six-yard line, and they fall away fast as you move outward or wider. The difference between the two images is the difference between shooting and scoring.
The numbers behind the picture
Split the pitch into inside-the-box and outside-the-box and the gap is enormous:
- Inside the box: 888 shots, 15.8% scored. Roughly one in six.
- Outside the box: 542 shots, 2.2% scored. Roughly one in forty-five.
- 92% of all goals came from inside the box. The famous worldie from 30 yards is real, but it's the exception that proves the rule — only three goals in the entire tournament came from beyond 30 yards (out of 128 such attempts).
The average shot was taken from 18.5 yards from goal; the average goal was scored from just 12.3 yards. Six yards closer, on average, is the whole story. Shooting from distance feels productive — you got a shot off, it counts in the box score — but the conversion math is brutal the moment you step outside the 18-yard line.
A worked example: conversion by distance
Bucket every non-penalty shot by its straight-line distance to the centre of the goal and the decay is almost geometric:
- 0–6 yards: 50 shots, 44.0% scored. Tap-in territory — almost a coin flip in your favour.
- 6–12 yards: 314 shots, 19.1% scored. The heart of the box; one in five.
- 12–18 yards: 366 shots, 12.6% scored. Edge-of-box and penalty-spot range.
- 18–30 yards: 572 shots, 3.7% scored. The single most common bucket, and a poor one.
- 30+ yards: 128 shots, 2.3% scored. Lottery tickets.
Notice the trap: the 18–30-yard band is where players take the most shots (572 of them) and convert the fewest worth taking (3.7%). That mismatch — high volume, low yield — is exactly the inefficiency that expected goals was invented to expose, and it's why modern coaching pushes so hard to trade a 25-yard shot for a pass into the box.
This explorer needs JavaScript. It turns two teams' total expected goals into win/draw/loss odds, so you can feel how a handful of high-quality central chances outweighs a pile of long-range efforts.
Why goals cluster where they do
Two forces compress the goal map. The first is geometry: the closer and more central you are, the more of the goal mouth you can see and the less time the keeper has to react. Distance shrinks the angle and gifts the goalkeeper reaction time; both crush the chance of scoring. The second is defence: the highest-value real estate — the six-yard box and the central pocket in front of it — is exactly where defenders concentrate, so shots from there are harder to get off in the first place. That's why the 0–6-yard bucket has only 50 shots despite converting 44%: those chances are rare precisely because they're so valuable. The art of attacking is manufacturing the shots the map says are worth taking, against a defence trying to deny them.
How the goals were finished
The body-part split of the 152 goals is a reminder that this is a close-range game: 70 were scored with the right foot, 51 with the left, 28 were headers, and three came off other body parts. Nearly one in five World Cup goals was a header — almost all of them from inside the six-yard area or the central box, where crosses and set pieces are aimed. It's another way of saying the same thing: goals live close to goal.
The honest caveats
- This is 2022, not 2026. Shot-level
(x, y)coordinates simply don't exist publicly for the in-progress 2026 tournament — StatsBomb's open data covers 2022 in full, so that's the honest, complete dataset for a shot map. The geography of shooting is stable across tournaments, but the exact percentages here belong to 2022. - “Where scored from” means the shot's origin, not where the ball crossed the line. We're mapping the launch point of goal-scoring shots, which is the right comparison to launch points of all shots.
- Penalties are excluded on purpose. Including them would add a fake spike at the spot (penalties convert ~75%) and distort both the attempt and goal maps.
- Location isn't everything. Distance and angle drive most of shot quality, but defender positions, the keeper, assist type and whether it's a first-time shot all matter — that's what a full xG model adds on top of raw location. A six-yard shot into a crowded box is not the 44% the bucket average implies.
The takeaway
If you remember one thing from the 2022 shot map, make it this: shots are cheap and goals are expensive, and the price is paid in yards. Attempts come from all over the final third, but 92% of goals — and almost all of the high-percentage ones — come from inside the box, most of them within a dozen yards of the line. The teams that win aren't usually the ones who shoot the most; they're the ones who shoot from the right places. The geography of the goal map is the geography of winning.
Reproduce it
Pull every shot for all 64 matches with data_layer/build_wc2022_shots.py (StatsBomb open data, competition 43 / season 106), drop penalties, then bin the shot (x, y) locations into the attacking half for attempts and for goals separately. Conversion-by-zone is goals ÷ shots within each region; distance is the straight line to the goal centre at (120, 40) on StatsBomb's 120×80 pitch. The figure is drawn by charts/chart_wc2022_shot_map.py with mplsoccer. No network at build time, nothing hand-entered.
Sources & further reading
- Free textbook: Chapter 7: Expected Goals (xG) Models — the theory behind this, at DataField.dev.
- Shot data: StatsBomb open data (CC BY 4.0) — FIFA World Cup 2022, all 64 matches, bundled as
data_layer/wc2022_shots.json. Data provided by StatsBomb. - Companion: Clinical or wasteful: 2026 finishing and what a clean sheet is worth.
- Background: Expected goals explained and post-shot xG and goalkeeper metrics — the models that turn shot location into a probability.
- Method: Do football goals follow a Poisson? and our World Cup analysis & prediction hub.
More from Data Deep-Dives
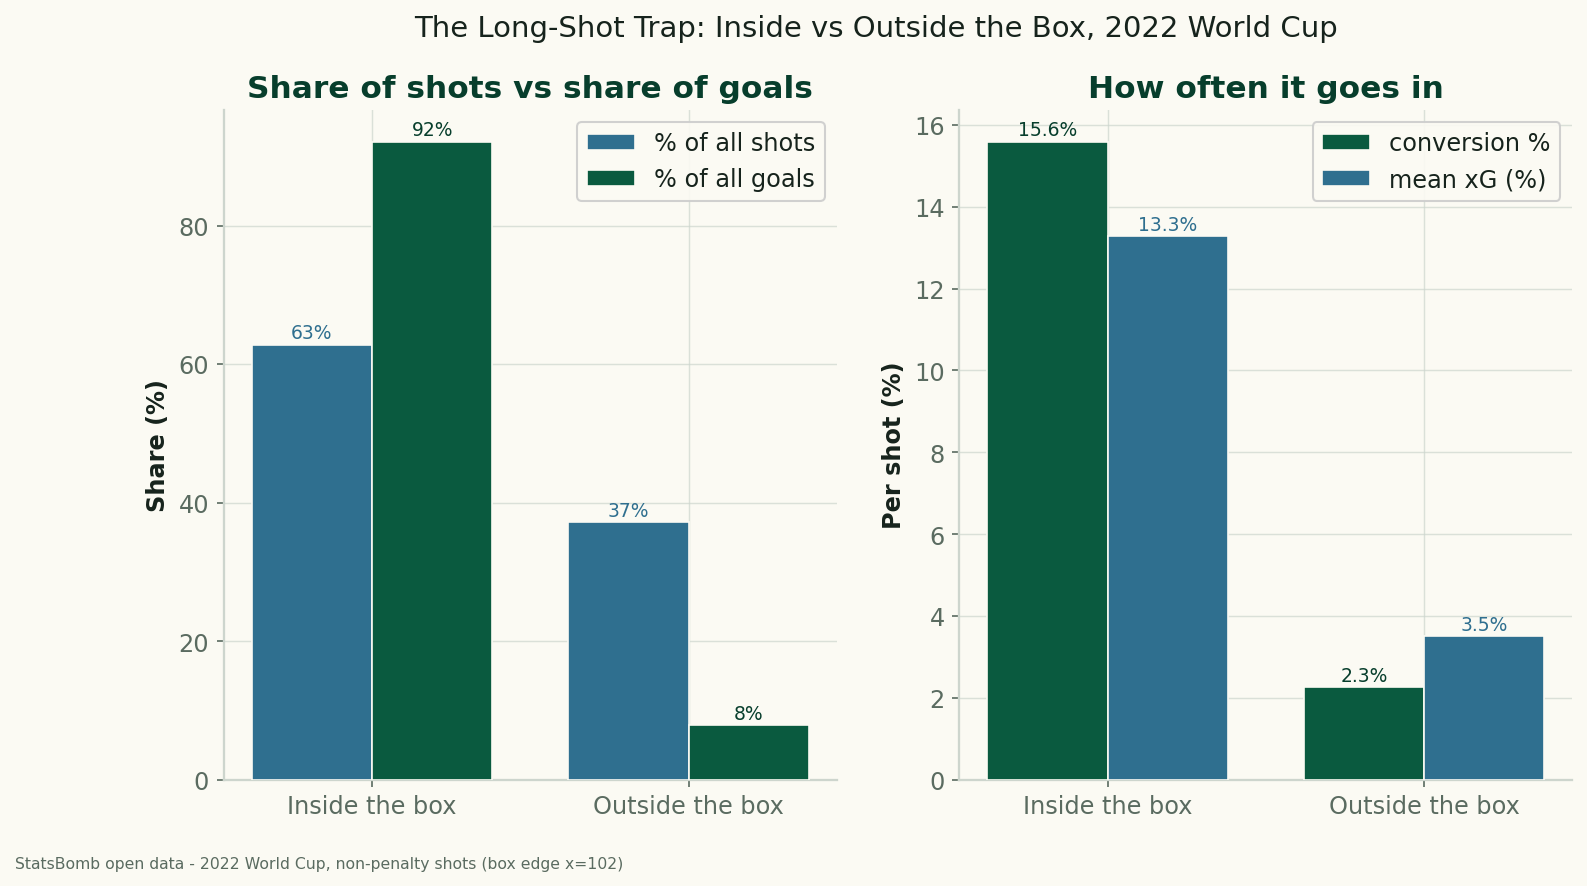
The Long-Shot Trap: Inside vs Outside the Box at the 2022 World Cup
Using StatsBomb data for all 64 matches of the 2022 World Cup, shots from outside the penalty box were 37% of all attempts but produced just 8% of the goals — a 2.3% conversion rate against 15.6% from inside. The data behind 'stop shooting from there.'
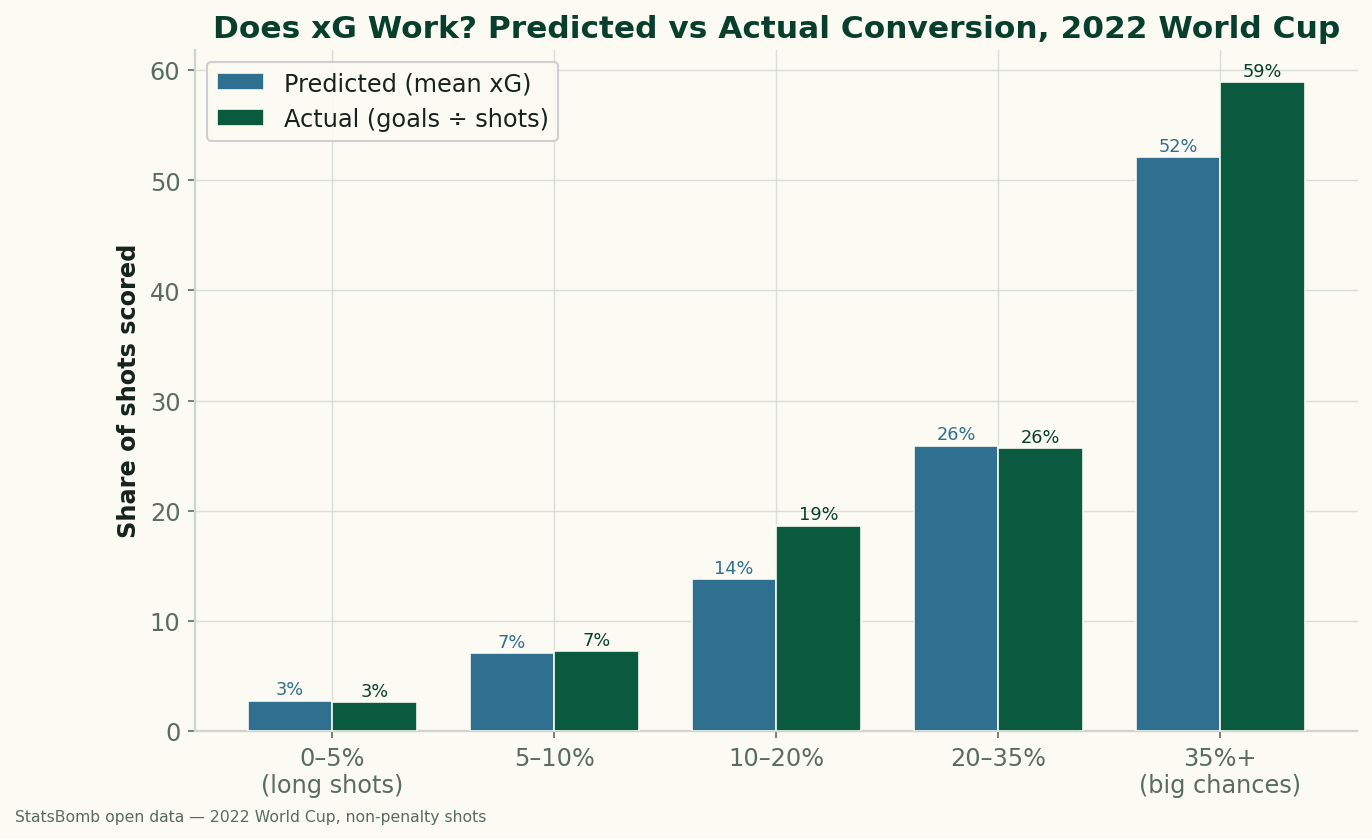
Does xG Actually Work? Big Chances vs Long Shots at the 2022 World Cup
We sorted every non-penalty shot from the 2022 World Cup by its expected-goals value and checked how often each band actually went in. xG holds up well: a 0–5% shot scored 2.6% of the time, a 'big chance' of 35%+ went in 58.9%. The calibration, and what a big chance is really worth.
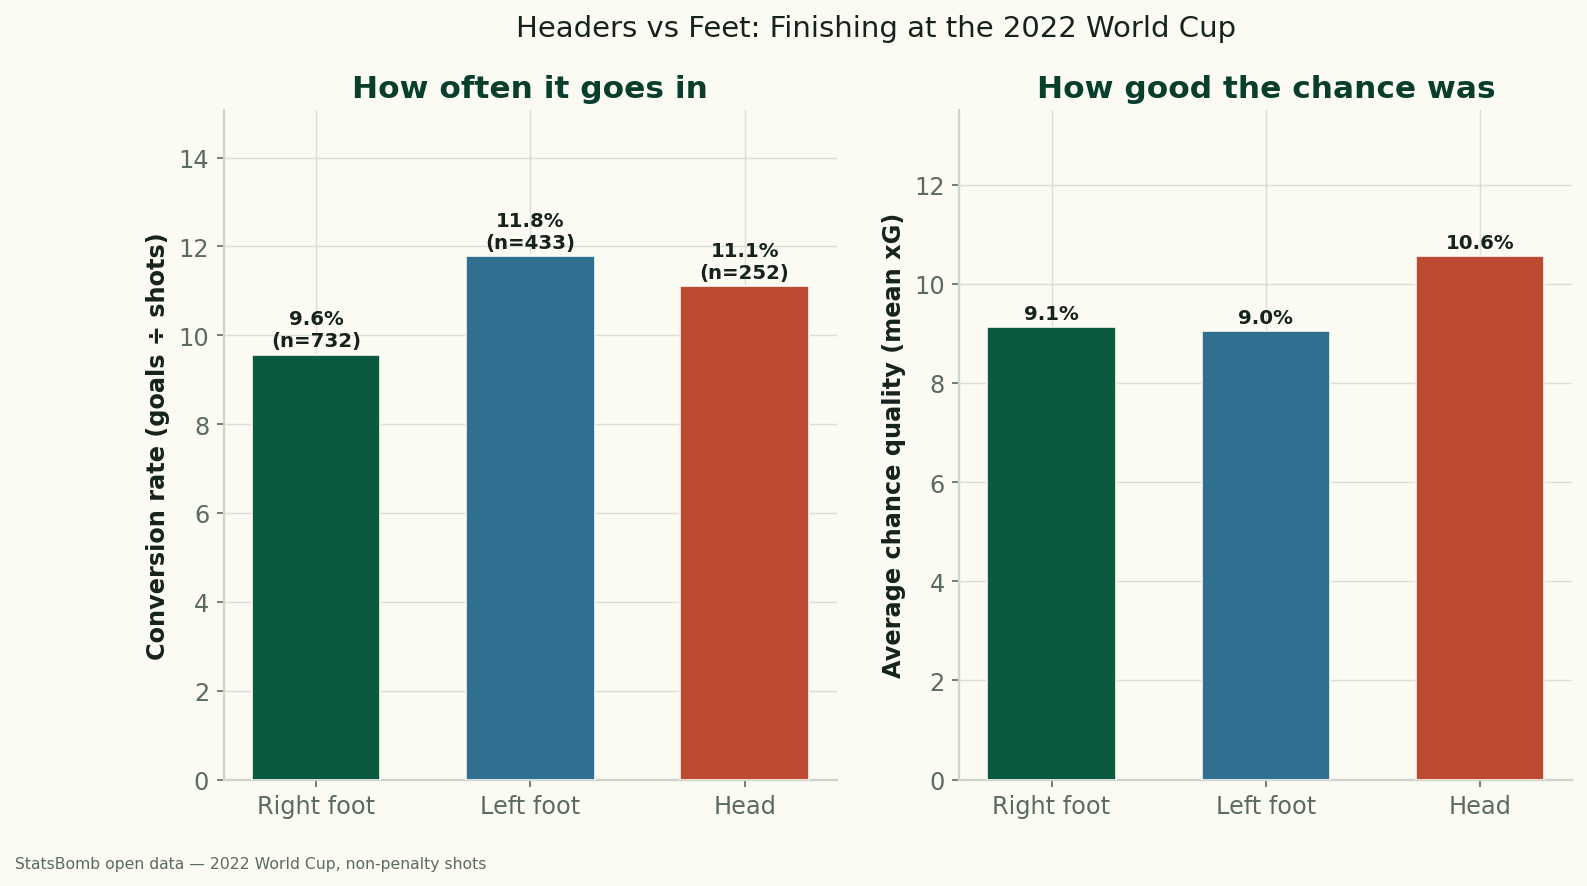
Headers vs. Feet: Which World Cup Shots Actually Go In?
Using StatsBomb data for all 64 matches of the 2022 World Cup, headers and feet convert at almost the same rate (11.1% vs 10.5%) — but only because headers come from higher-quality positions. Relative to chance quality, foot finishing beat the model, and the left foot was the most clinical of all.