The Table Lies Until October: Last Season's Premier League, Replayed From Matchweek One
The 2026-27 season kicks off tonight, and by Monday there will be a table — sorted, colour-coded, and mostly fiction. Before the first ball, we replayed all 380 matches of last season to measure exactly how long the table lies, which opening-day results told the truth, and why two games somehow mislead more than one.
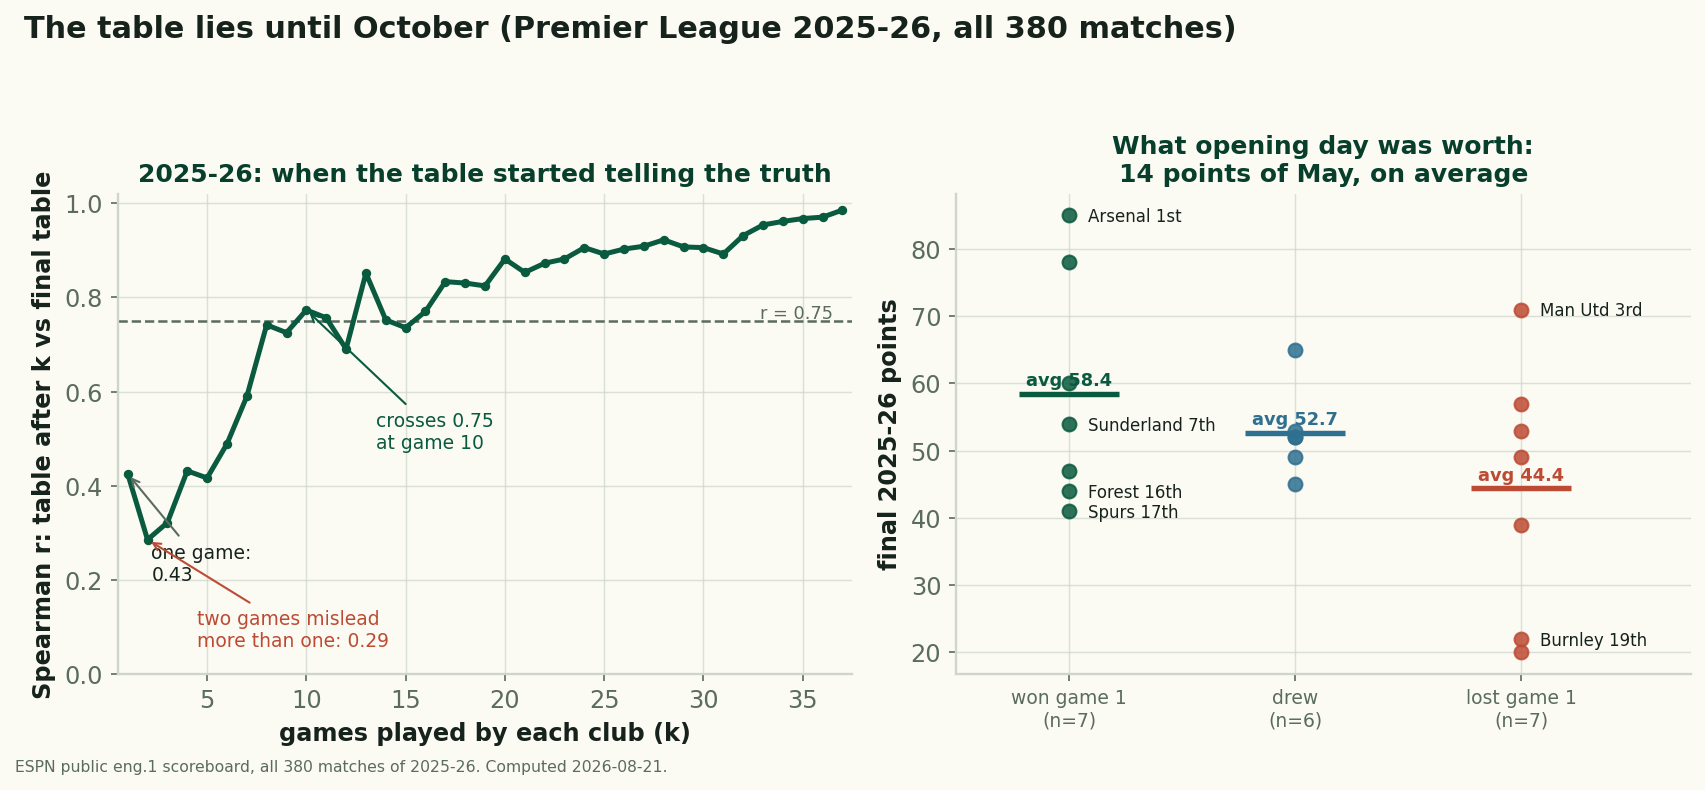
Tonight the 2026-27 Premier League opens, and within 72 hours every site in football — this one included — will print a league table. It will be sorted and authoritative-looking, and it will be mostly noise. That claim can be measured instead of asserted, so we replayed all 380 matches of 2025-26 in each club's own order and asked, after every round of games: how much did the table-so-far agree with the final one? The answers: 0.43 after one game (rank correlation), down to 0.29 after two, past 0.75 only around game ten — late October — and not durably above it until game thirteen. And yet opening day wasn't worthless: the seven clubs that won their first match finished on an average of 58.4 points, the seven that lost on 44.4 — a fourteen-point echo from a single August result.
Sourcing. Every number is computed from ESPN's public eng.1 scoreboard — the complete 2025-26 season, 380 matches, pulled 2026-08-21 by data_layer/build_epl_2025_results.py and replayed by charts/chart_epl_table_truth.py, which recomputes every figure in this piece at build time. "Table after k" ranks clubs on cumulative points, then goal difference, then name — per-club game count rather than calendar matchweek, so winter postponements can't smear the axis. One season is one sample: the shape of these curves is durable statistics, the exact crossing points would wobble in another year, and we say which is which as we go.
The curve, and its strange first step
The left panel is the piece. After every club had played once, the table's rank correlation with the final standings was 0.43 — better than nothing, far from truth. Then the genuinely odd result: after two games it fell to 0.29. Two results per club produced a table that agreed with May less than one result had. There's no paradox once you think in coin flips: with only seven points-values available after two games, the table is mostly tie-breaks and accident, and one strange weekend — an opening-day truth-teller losing its second match, a bad side stealing a draw — can shuffle whole clusters. Small samples don't just carry noise; adding a second noisy observation can genuinely outweigh the first's information. The table doesn't climb out of the mud reliably until five or six rounds in.
The 0.75 line — the threshold where the table explains more than half the rank variance and starts deserving its colour-coding — falls around game ten, which last season meant late October. Even that came with an asterisk: the curve wobbled back below the line around games eleven and twelve before crossing for good at thirteen. By the halfway mark it sat at 0.82; by game 25, around 0.89; the final week, 0.98 (not 1.00 — final-day results still swapped neighbours). The honest summary for the season starting tonight: treat every table you see before Halloween as a rumour.
What opening day is actually worth
Here is the other half, and it cuts the opposite way. Group last season's clubs by nothing more than their opening-day result and follow them to May: winners 58.4 final points on average, drawers 52.7, losers 44.4. Fourteen points is the gap between a Europa League push and a relegation glance, echoed from a single match in August. With seven clubs per group the standard errors are wide — this is one season, not a law — but the ordering is exactly what the bigger samples on this site keep finding: single early results carry real but heavily diluted signal.
Both things are true at once, and the reconciliation matters: opening day tells you something about clubs on average, while the table — twenty clubs' worth of noise stacked and sorted — stays fiction for two more months. An average carries signal that any individual row can betray. Which brings us to the liars.
The 2025-26 liars' ledger
Tottenham won on opening day and finished seventeenth. They beat Burnley 3-0 in August — the kind of scoreline that writes season previews — and spent spring in a relegation scrap. Nottingham Forest won their opener and finished sixteenth. On the other side, Manchester United lost their opening match and finished third — with the honest footnote that the defeat came against Arsenal, who would win the title; losing to the champions-elect in week one is the least informative loss the fixture computer can hand you. That's a caution about the opponent axis: an opening result is one draw from a deck where the cards differ enormously in what they can teach.
Meanwhile some opening results were simply the truth arriving early. Sunderland beat West Ham 3-0 on day one and finished seventh — the promoted overachievers of the season announcing themselves inside ninety minutes. Burnley lost 0-3 on day one and finished nineteenth; their opener was a preview played straight. And Arsenal won 1-0 at Old Trafford and won the league — though the table took its time agreeing: the champions sat sixth after the first round, third after three games, and didn't take over first place until game ten. The eventual champion of a 38-game season was invisible at the top of the table for a quarter of it. (How a title run's underlying numbers diverge from its points is the xPts piece's territory; this one is only about the standings themselves.)
How to watch the next ten weeks
Three rules fall straight out of the replay. First: until each club has played about ten matches — call it Halloween — read results, not the table; the sorted list adds noise to information you already have. Second: weight opening results by opponent before reacting; a loss to a title favourite is close to a free pass, a 3-0 over a promoted side is the single most over-read scoreline in football (it fooled everyone about Spurs and told the plain truth about Sunderland — indistinguishable at the time). Third: when this site's live 2026-27 tracker starts publishing the running table tonight, hold it to this piece's standard — we'll say plainly, right in the tracker, that early tables are weather, not climate. The first table that historically deserved your trust arrives around matchweek ten. Set a reminder for October the 24th.
Published by SoccerAnalytics from public data and the sources named in this piece. How this site is made.