What Keepers Actually Save: 483 On-Target Shots, Measured
Flip the shot map around. From the keeper's side of the 2022 data, save rates are less about reflexes and more about what kind of shot arrives — which is exactly why raw save percentage misleads, and why post-shot xG exists.
Goalkeeping analysis usually starts with a highlight reel. Start with a census instead: the 2022 World Cup produced 483 on-target, non-penalty shots, and keepers saved 331 of them — 69%. But that average is hiding the entire story. Sort the same shots by chance quality and the save rate runs from 84% on weak shots to 33% on big chances. A keeper’s save percentage is mostly a description of the shots he faced, not the hands he has — the single most important caveat in goalkeeping stats, here measured on a complete tournament.
Sourcing. Shot-level data: StatsBomb’s free open event data for the 2022 World Cup (attribution required), bundled as data_layer/wc2022_shots.json. The sample is every non-penalty shot that ended as a goal or a save — 483 of the tournament’s 1,494 shots (blocked and off-target attempts never reach the keeper and are excluded). Penalties get their own census. Chart script in the repo.
The exhibit
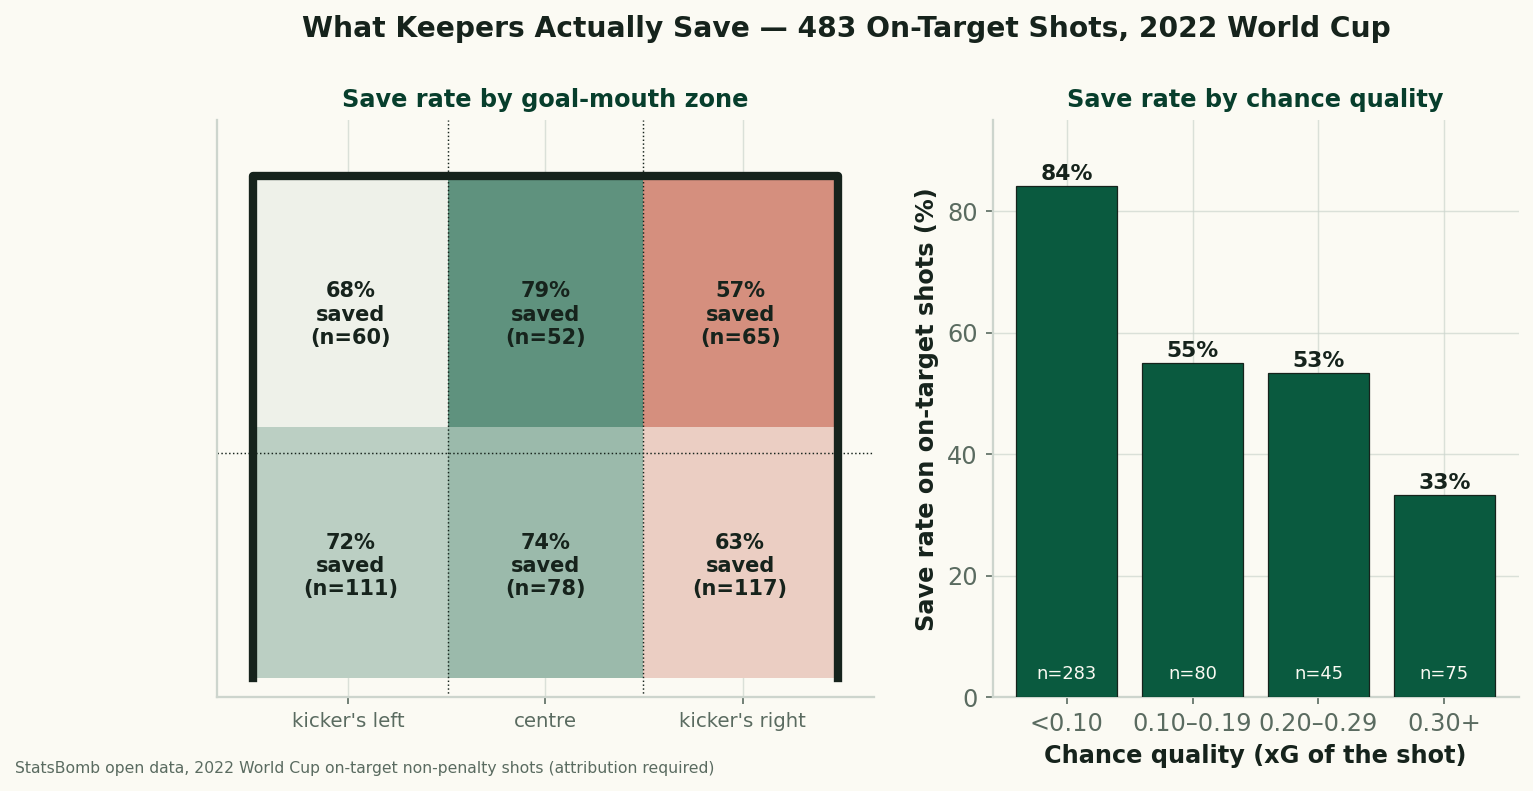
Zone by zone: corners beat keepers, height mostly doesn’t
The six-zone grid holds two surprises. First, the middle of the goal — where the keeper stands — is the safest place to shoot at any height: 74% of low-central and 79% of high-central on-target shots were saved. Shooters know this, which is why so few goals go there; what the keeper’s view adds is that even the on-target shots that do go central mostly die. Second, height is worth less than width: the low band (72–63–74% saved) and high band (68–57–79%) are broadly similar, but both flanks beat keepers far more than the centre, and one flank — the kicker’s right, the keeper’s left — was beaten most of all: 57% saved high, 63% low. With 60–117 shots per zone we’d treat the left/right asymmetry as an observed 2022 fact rather than a law of goalkeeping; footedness mix and a handful of exceptional shooters can tilt a tournament’s corners.
Chance quality is the whole ballgame
The right panel is the finding that reorganizes everything else. Bucket the same 483 shots by their pre-shot expected-goals value and the save rate falls off a cliff: 84% on shots under 0.10 xG (n=283), 55% at 0.10–0.19, 53% at 0.20–0.29, and 33% on big chances of 0.30+ (n=75). More than half the on-target shots keepers face are the easy kind — long-range, tight-angle, defender-cluttered — and they save nearly all of them. The shots that decide matches, the one-on-ones and six-yard-box chances, go in two times out of three even when on target.
This is precisely why raw save percentage misleads, and why the field moved to post-shot expected goals: a keeper behind a leaky defence faces a big-chance diet and posts an ugly save rate with heroic hands, while a keeper behind a low block feasts on 0.05-xG speculation. The concept gets a full explainer in our PSxG and goalkeeper-metrics piece, and the tournament-lore version — the keepers who carried nations — in how shot-stopping wins tournaments. What this census adds is the base rates underneath both: when a knockout-round keeper “stands on his head,” the arithmetic usually means he saved one or two shots from the 0.30+ column, worth roughly a goal of swing on their own.
Why this matters for the 2026 knockouts
No shot-location data exists publicly for 2026, so nobody can compute these numbers for the current tournament yet — but the structure travels. The round of 16 so far has been decided by on-target efficiency in tiny samples: England put five of six shots on target past Mexico’s keeper; Norway’s entire run is built on converting an outlier share of few shots. In games that tight, the difference between an 84%-save night and a 33%-save night is simply which column of this chart the opposing attack forces you into. Teams that manufacture even one extra big chance per knockout game are, in effect, betting on the 33% row — the best odds in football.
Honest limitations
- “On target” conditions on the shooter. This census starts after the shot is struck and on frame; it says nothing about positioning that forced shots wide, sweeping, claims, or distribution — keeper skills the shot record can’t see (our sweeper-keeper piece covers one of them).
- Pre-shot xG, not post-shot. Bands use the chance’s xG, which ignores where in the frame the shot went; a proper keeper rating uses post-shot xG. Our zone grid is the descriptive half of that idea, not the model.
- One tournament, 483 shots. Zone cells run n=52–117; treat cell-to-cell gaps of a few points as noise. The xG gradient (84% → 33%) is far too large to be noise.
- Keeper anonymity by design. This is a league-wide census; per-keeper save rates over ~20 shots are exactly the kind of small-sample ranking this article warns against.
Sources
- Shot-level data: StatsBomb open data (free public dataset; attribution required), bundled as
data_layer/wc2022_shots.json; 483 on-target non-penalty shots. Chart:charts/chart_wc2022_keeper_saves.py. - Related: post-shot xG and goalkeeper metrics (the model this data motivates), how shot-stopping wins tournaments, and where players aim (the shooter’s view of the same goal mouth).
More from Data Deep-Dives
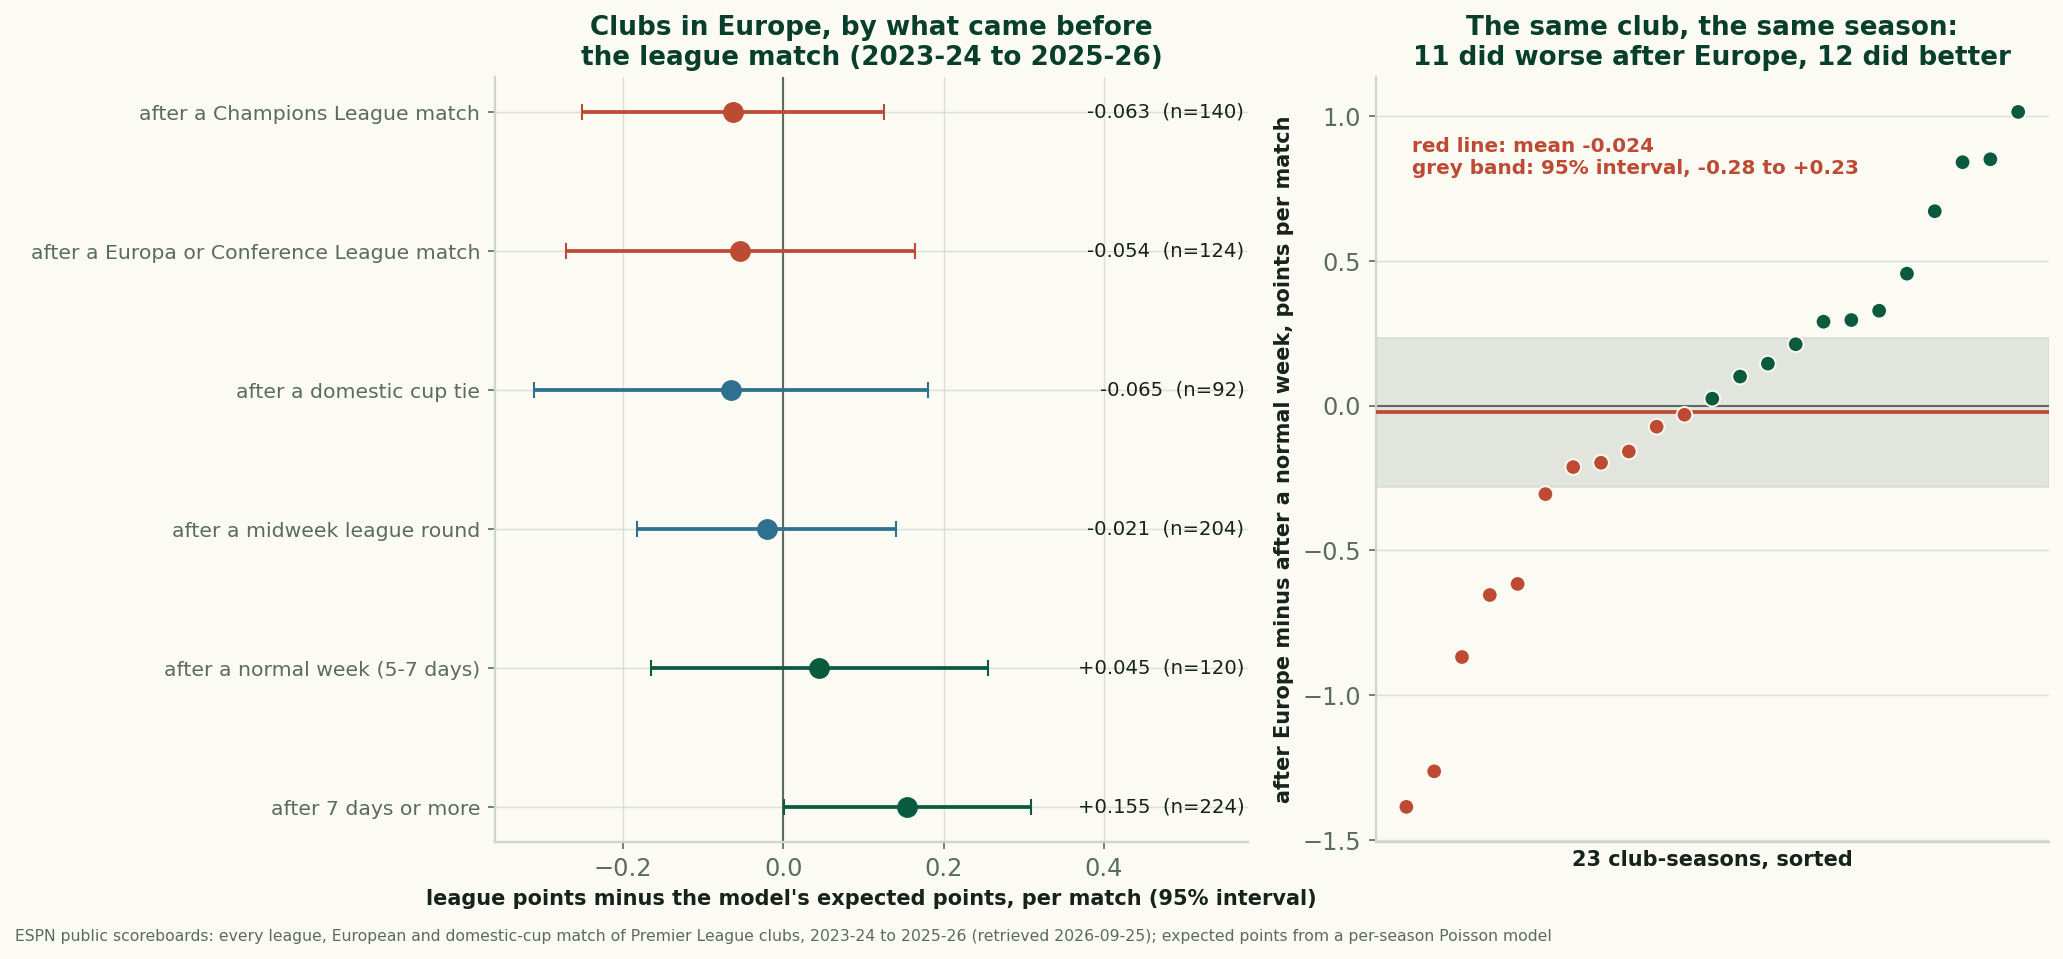
Does Europe Cost English Clubs at the Weekend? Three Seasons Can't Find It
After a European night, English clubs took 1.56 league points a match against 1.62 expected. Within the same club and season the gap is -0.024: not measurable.
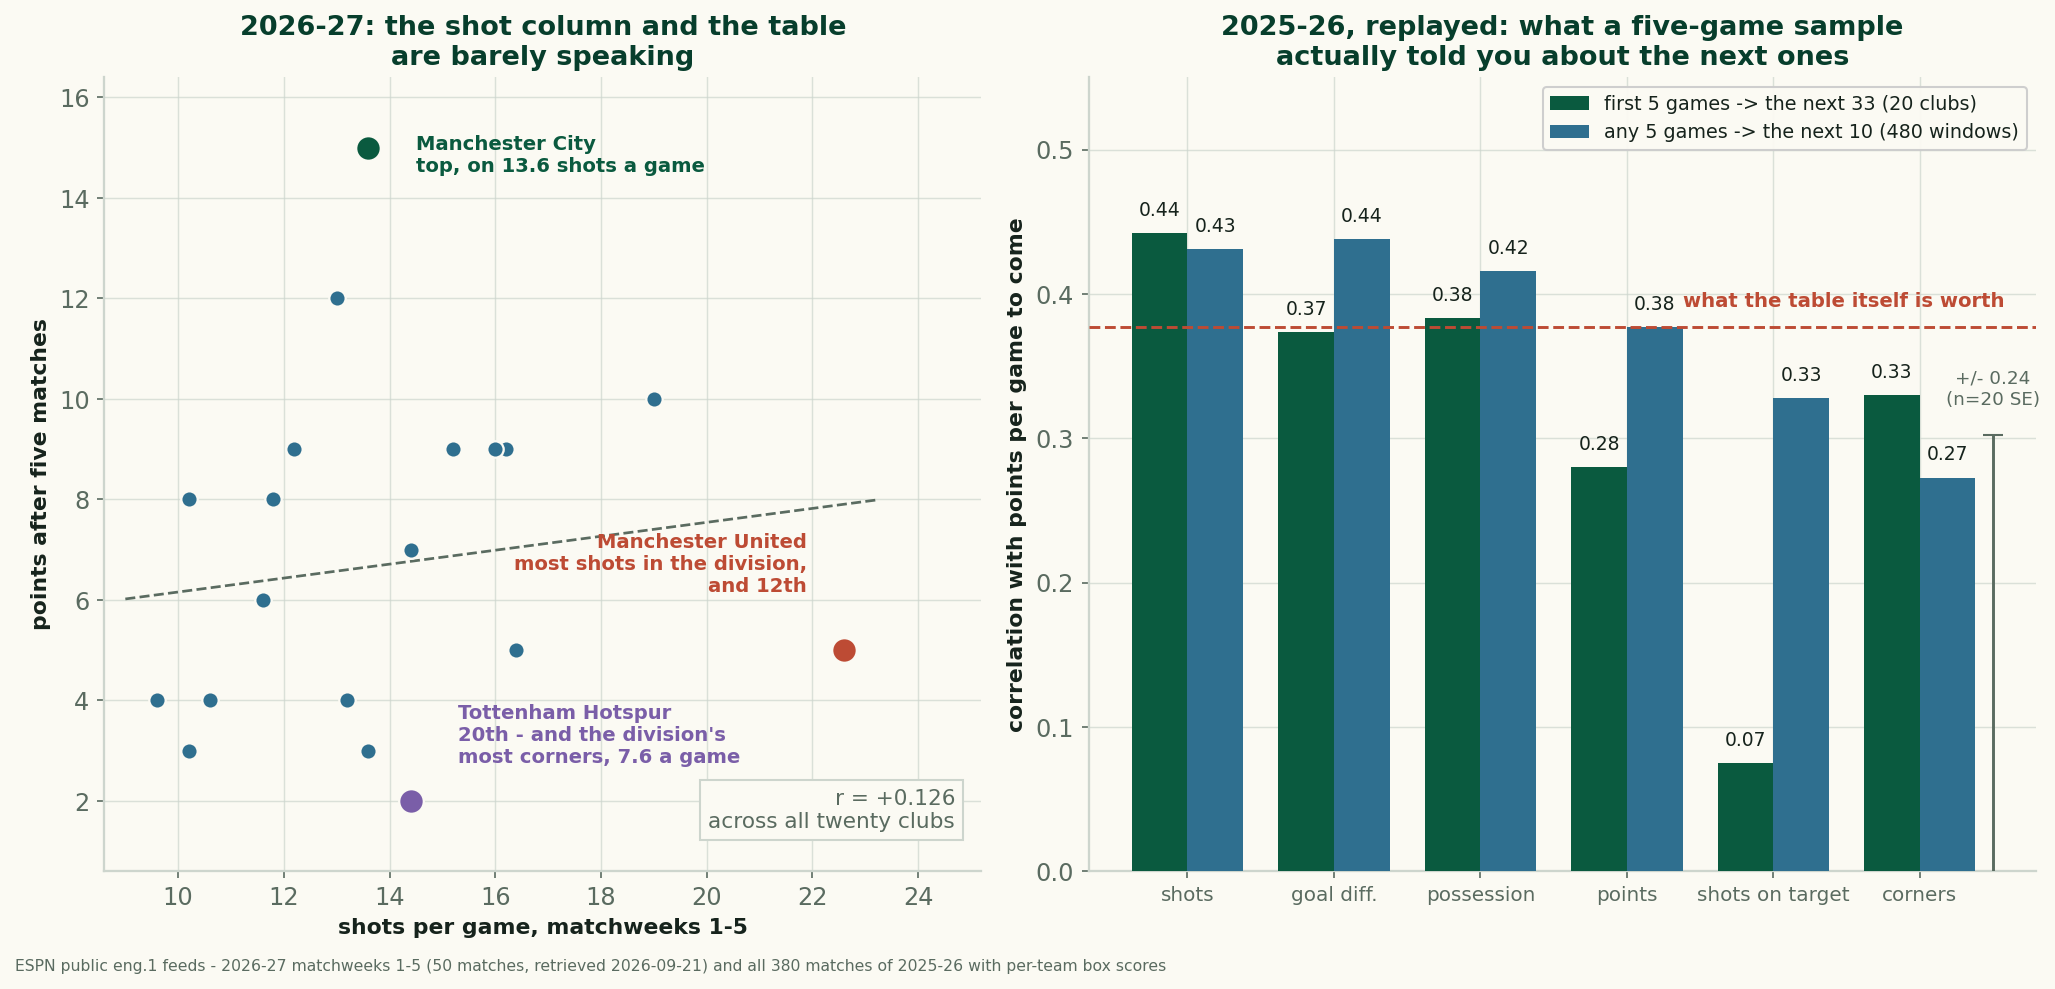
Manchester United Lead the League in Shots and Sit Twelfth
United take 22.6 shots a game and have 5 points. Across 2025-26, a club's five-game shot count predicted its next results better than its points did.
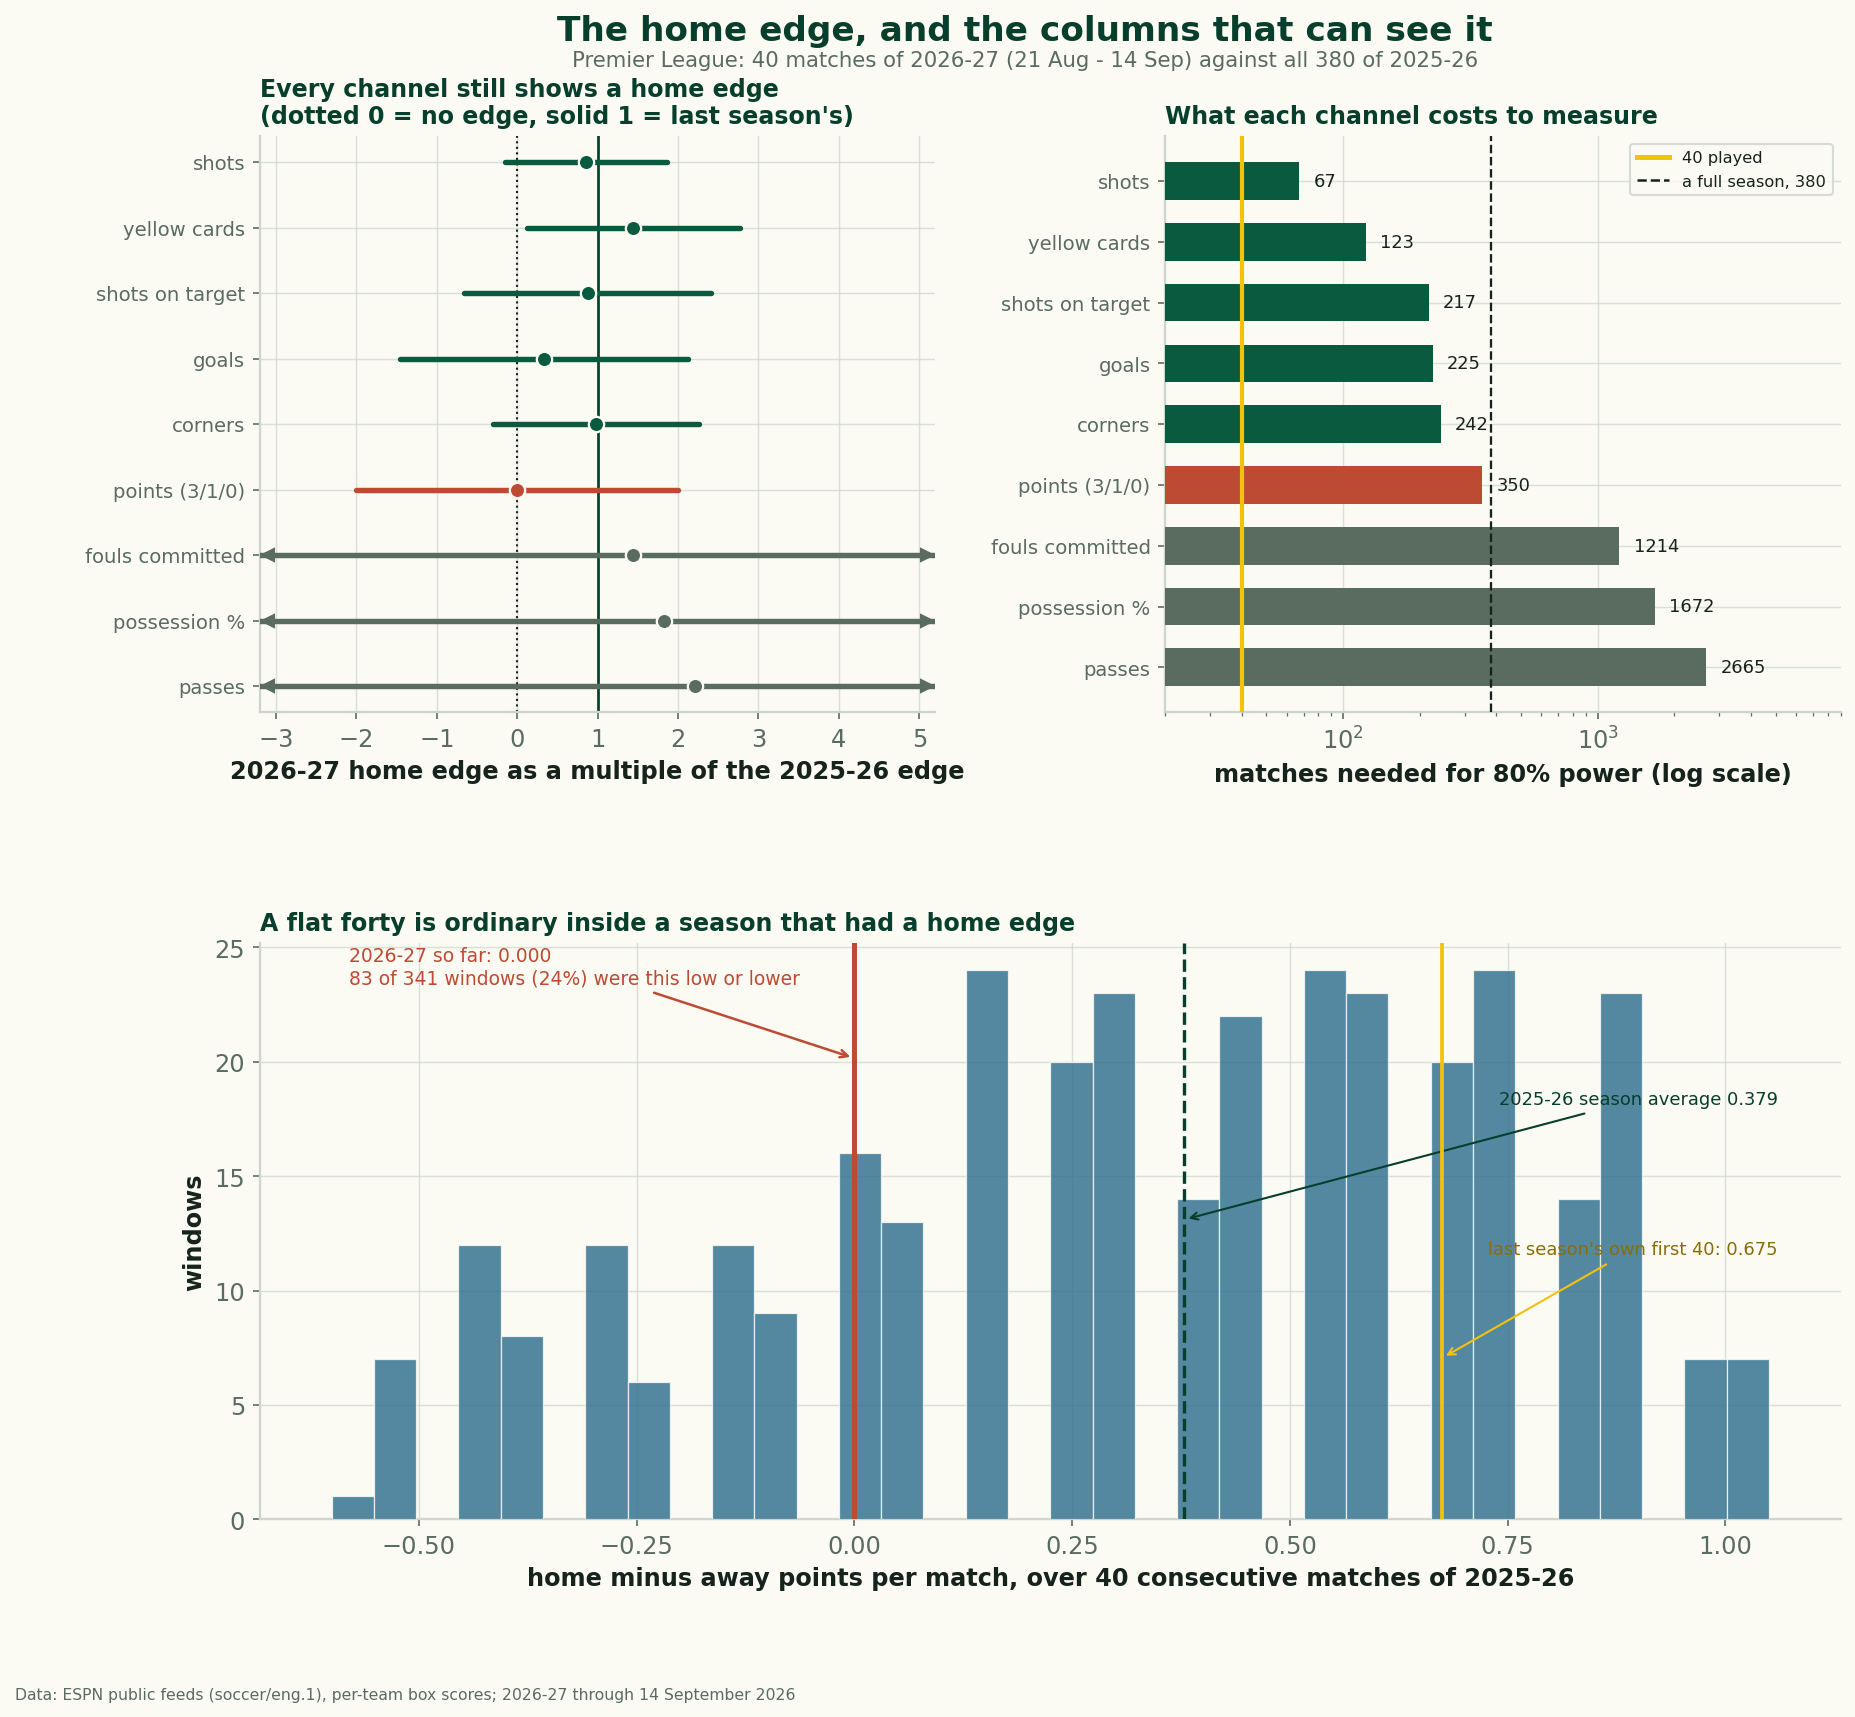
Home Advantage Didn't Die. The Results Column Can't See It
Home and away split the first 40 matches of 2026-27 evenly, yet the shot, corner and card columns keep the home edge. Plus a decade of home-advantage data.